Share crypto content and earn up to 60% commissions through content mining.
placeholder
gatefun
No big-picture thinking—I can’t hold, and the profit on this move was paper-thin, but I absolutely loved it. I had my eye on it when it kept oscillating intraday. Every push upward fell just short, and nobody bought into the move—this kind of price action clearly reeked of a bull trap. While everyone else was running, I stayed calm: I didn’t buy the pullback or trade the rebound, just waited for it to lose support on its own. I had just finished lunch and was checking the charts when the price plunged straight from 4486.7 to 4458.8. I nailed the short timing and pocketed +56.76%—felt amazing.
ZEC16.84%
DOGE4.74%
View Original
post-image
  • Reward
  • Comment
  • Repost
  • Share
$BTC Signal】4H MACD bullish continuation, dip-buying opportunity amid order book depth imbalance
$BTC Selling pressure is concentrated in the order book and bids are paper-thin, but the 4H MACD histogram is positive, with price trading above EMA20. The 1H RSI has retreated to 64, leaving limited room for a pullback, while the Bollinger midline provides support. Short-term low-volume sideways trading has compressed price into the 80710-80953 range, with the funding rate at a normal 0.0067% and OI stable.
🎯 Direction: long
⚡ Entry/limit order: 80710.440 - 80953.300
🛑 Stop-loss: 80143.767
🚀
BTC3.89%
View Original
post-image
  • Reward
  • Comment
  • Repost
  • Share
so here we go again, at the end of next week
hopefully will update you all about my liquidation or good pnls
say a word of prayer for my new $100
post-image
post-image
post-image
post-image
  • Reward
  • Comment
  • Repost
  • Share
$TRIA Signal】Long | 1H pierces the Bollinger upper band, volume follow-through
$TRIA 1H RSI hit 84, and the price pierced the Bollinger upper band. The 4H MACD red histogram narrowed and turned bullish, with volume expanding simultaneously. Order book bid/ask depth is imbalanced by 25.92%, with a Bid/Ask Ratio of 1.70 and dense buy orders below. EMA20/50 converged around 0.0042 before diverging upward, while the current price is approximately 20% away from the moving averages.
🎯Direction: Long
⚡Entry/Limit order: 0.00527313 - 0.00528900
🛑Stop-loss: 0.00523611
🚀Target 1: 0.00536834
🚀Target
TRIA37.47%
BTC3.90%
ETH4.72%
SOL3.25%
View Original
post-image
  • Reward
  • Comment
  • Repost
  • Share
Farming and making money. Underrated combo
post-image
  • Reward
  • Comment
  • Repost
  • Share
Golden September and Silver October are now fully underway—the perfect opportunity is here!
The market exploded across the board at the start of September, with Bitcoin, Ethereum, gold, sndk, and numerous other assets taking off simultaneously. Bullish sentiment has spread throughout the market, and the window for a new wave of trend-driven gains is wide open.
There is no universal formula for trading. Different capital sizes call for their own tailored trading systems, and steady compounding is the key to long-term success:
80k–150k U or more
Focus on long-term accumulation in major cryptocur
BTC3.89%
View Original
post-image
post-image
post-image
post-image
post-image
post-image
  • Reward
  • 2
  • Repost
  • Share
$VANA #VANA
Preparing to test resistance of Falling Wedge.
Breakout could provide 80-90% rise ✍️
VANA11.20%
  • Reward
  • 3
  • Repost
  • Share
CryptoShine:
2026 GOGOGO 👊
View More
#晒出我的持仓收益 is currently in a consolidation and adjustment phase from a technical analysis perspective. The 0.3 take-profit level should not be much of a problem today. Brothers, many hands make light work—just go for it.
View Original
post-image
USELESS_USDT
Long
Cross 50X
Return %
+813.25%
Entry Price(USDT)
0.20883
Mark Price(USDT)
0.24407
  • Reward
  • Comment
  • Repost
  • Share
I didn’t do anything—I just went to the bathroom, and when I came back, the candlestick chart had already done the work for me. I was watching when the early-session dump started; the rebound was weak, overhead resistance was obvious, and every push upward looked like doing push-ups—clearly lacking sincerity. When the screen was full of green and people were panicking and cutting losses, I instead thought it was a good time to open short positions. And what happened? It went straight from 0.9133 to 0.593, with +2488.45% secured. This move was purely the market being in a good mood and casually
SOL3.18%
BNB2.08%
View Original
post-image
  • Reward
  • Comment
  • Repost
  • Share
Gm bulls ☕️
Another 100m+ runner on rh chain
post-image
  • Reward
  • Comment
  • Repost
  • Share
SOL retests the 102–100 support; if it holds, remain bullish, with targets at 110–120–130.
SOL3.25%
View Original
post-image
  • Reward
  • Comment
  • Repost
  • Share
#GateTops7DayNetInflowsGlobally
Gate is making a strong statement through capital flows. According to DeFiLlama data, Gate recorded approximately $273.72 million in net capital inflows over the past 7 days, placing it among the top three centralized exchanges globally. For an exchange, this is more than just a large number on a dashboard—it shows that a significant amount of capital has moved onto the platform after accounting for outflows.
The important word here is “net.” If users deposit $500 million but withdraw $226 million during the same period, the net inflow is roughly $274 million.
post-image
Luna_Star
#GateTops7DayNetInflowsGlobally
Gate Tops Global 7-Day Net Inflows: What This Signal Says About Investor Confidence
Gate ranking first globally in 7-day net inflows is more than a short-term platform statistic. It is a market signal that deserves a closer look because net inflows can provide valuable insight into how users are positioning capital, where trading activity is moving and how investor confidence is changing across the digital asset market.
When capital enters a trading platform, it can represent several different intentions. Some users may be preparing to trade, others may be moving assets for portfolio management, while some may simply be increasing their available liquidity during periods of changing market conditions.
This makes net inflows different from simple trading volume.
Trading volume tells us how much activity is taking place.
Net inflows tell us more about the movement of capital into a platform.
When a platform records strong net inflows over a seven-day period, it suggests that the amount of capital entering the platform is exceeding the amount leaving it during that period. That can indicate growing user engagement, increasing trading preparation and stronger demand for access to available financial products.
Gate ranking at the top of the global seven-day net inflow metric therefore creates an interesting market narrative.
The first question is where the capital is coming from.
Crypto markets operate continuously across global regions, meaning capital flows can change rapidly as investors respond to Bitcoin price movements, altcoin opportunities, macroeconomic developments, interest-rate expectations and broader risk sentiment.
A strong inflow ranking can indicate that users are actively preparing for new market opportunities rather than simply reducing exposure.
However, inflows should never be interpreted as a guaranteed bullish signal for the entire crypto market.
Capital can enter an exchange before both buying and selling activity.
Some traders may deposit funds because they expect volatility.
Others may move assets to take advantage of derivatives, spot opportunities, new listings or portfolio rebalancing.
Therefore, the most useful way to interpret net inflows is together with other market indicators.
Bitcoin price structure remains one of the most important factors.
If BTC is holding key support levels while exchange inflows increase, it may suggest that market participants are positioning capital for potential upside opportunities.
If BTC is approaching major resistance, higher inflows could also indicate that traders are preparing for increased volatility.
The same logic applies to Ethereum and major altcoins.
Crypto markets are increasingly interconnected. Capital entering a large global platform can eventually move across different asset categories depending on market conditions.
This is where Gate's broad ecosystem becomes particularly relevant.
A platform supporting thousands of digital assets provides users with access to multiple market segments rather than limiting activity to only a handful of major cryptocurrencies.
That creates more flexibility for investors and traders who constantly adjust their strategies according to changing market conditions.
One of the biggest developments in modern crypto markets is the increasing importance of liquidity.
Liquidity allows traders to enter and exit positions more efficiently and can help markets absorb large orders without excessive price disruption.
Growing capital flows can contribute to deeper liquidity, although the relationship is not automatic and depends on how those assets are distributed across markets and trading pairs.
This is why a sustained inflow trend may be more meaningful than a single-day spike.
Seven-day performance provides a broader window.
It reduces the importance of one isolated transaction or one unusually active trading session and gives a better indication of recent capital movement.
If strong inflows continue over multiple periods, the signal becomes more interesting.
It may indicate that users are consistently increasing their presence on the platform rather than responding to one temporary event.
There is also a broader industry trend behind this development.
Crypto investors today have access to significantly more financial products than they did several years ago.
Spot trading, futures, options, staking, earn products, Web3 applications and other services are increasingly becoming part of the same digital financial environment.
This means that exchange platforms are no longer competing only on trading fees or the number of listed tokens.
They are competing on liquidity, security, product depth, technology, accessibility and the overall user experience.
Gate's global positioning is therefore important when interpreting its seven-day inflow ranking.
A platform serving users across different regions can experience capital movements influenced by multiple market cycles at the same time.
Asian trading hours, European market activity and US macroeconomic developments can all affect crypto liquidity and sentiment.
This creates a continuously evolving flow of capital throughout the global market.
Another factor worth watching is stablecoin liquidity.
Stablecoins often act as the bridge between traditional currency and crypto markets. When traders move stablecoins onto an exchange, they can potentially deploy that capital into Bitcoin, Ethereum, altcoins or other available products.
Therefore, changes in stablecoin balances and exchange inflows can provide additional context for understanding market positioning.
At the same time, investors should avoid assuming that every inflow immediately becomes buying pressure.
Capital can remain unused, move between products or eventually leave the platform.
The real significance comes from combining inflow data with price action, open interest, funding rates, trading volume and broader market sentiment.
This is especially important during volatile market conditions.
When uncertainty increases, investors often become more active in managing risk.
Some increase cash or stablecoin positions.
Some hedge through derivatives.
Others search for opportunities created by large price movements.
A platform experiencing strong net inflows can therefore become an important center of this activity.
The seven-day timeframe also makes the metric particularly relevant for short-term market analysis.
Long-term adoption tells us about structural growth.
Short-term net inflows tell us more about current positioning.
Both are important, but they answer different questions.
Long-term user growth shows whether a platform is expanding its reach.
Net inflows show where capital has recently been moving.
Trading volume shows how actively that capital is being used.
Liquidity shows how efficiently markets can absorb that activity.
Together, these indicators provide a much clearer picture than any single metric.
This is why #GateTops7DayNetInflowsGlobally deserves attention beyond the headline ranking.
It highlights the importance of capital flows in understanding the modern crypto market.
The digital asset industry has matured significantly. Investors now monitor not only token prices but also exchange reserves, ETF flows, stablecoin supply, derivatives positioning, institutional activity and macroeconomic liquidity.
Capital movement has become one of the most important pieces of the market puzzle.
If Gate can maintain strong net inflows while continuing to expand liquidity, products and global accessibility, the significance of this ranking could become even greater.
But sustainability will be the key.
One strong seven-day period is interesting.
Repeated strong inflows across multiple periods would be a much stronger signal.
That would suggest that capital is not simply moving temporarily but that users are increasingly choosing the platform as part of their ongoing trading and investment activity.
The broader market environment will also remain important.
Interest-rate expectations, inflation data, central-bank policy, equity-market performance, geopolitical risks and global liquidity conditions can all influence how much capital investors are willing to allocate toward digital assets.
Crypto does not operate in isolation anymore.
Bitcoin increasingly trades within the same global liquidity environment that affects technology stocks, commodities, currencies and other risk assets.
This makes exchange-level capital flows even more useful.
They provide a real-time window into how market participants are preparing for the next phase of volatility.
The most interesting question is therefore not simply why Gate ranked first in seven-day net inflows.
The bigger question is what happens next.
Will these inflows translate into higher trading activity?
Will liquidity continue improving?
Will capital rotate toward Bitcoin and Ethereum, or toward higher-beta altcoins?
Will traders increase derivatives exposure?
Will stablecoin balances remain elevated?
And most importantly, will strong capital inflows continue beyond a single seven-day period?
Those developments will determine whether this ranking becomes a temporary market event or part of a longer-term trend.
For traders and investors, the lesson is simple.
Do not look at price alone.
Watch where capital is moving.
Watch liquidity.
Watch volume.
Watch derivatives positioning.
Watch macroeconomic conditions.
And watch whether capital flows remain consistent over time.
Gate topping the global seven-day net inflow ranking provides another data point for that analysis.
It does not guarantee that prices will rise, and it should not be treated as a standalone buy or sell signal.
But it does highlight an important development: significant capital is moving through Gate's ecosystem, and that movement deserves attention.
As crypto continues evolving into a broader digital financial market, capital flow data will become increasingly important for understanding investor behavior.
The next stage of the market will not be defined only by who has the highest trading volume.
It will also be defined by where capital is moving, why it is moving and whether those flows can remain sustainable.
That is what makes more than a ranking.
It is a snapshot of current market positioning and another indication of how quickly the global digital asset ecosystem continues to develop.
#GateSquare
#ContentMining
@Gate_Square
repost-content-media
  • Reward
  • Comment
  • Repost
  • Share
September 4 Gate Top Strategy Profit Rankings
ETHUSDT Futures Grid 200x Long | 36,960.40 USDT
SOLUSDT Futures Grid 100x Long | 32,292.07 USDT
PONSUSDT Futures Grid 2x Long | 25,460.62 USDT
Long and short, up to 200x leverage
Use Gate Futures Grid to trade $PONS and capture opportunities in the hot market
‍# 网格交易 #Range-bound market
PONS35.73%
View Original
post-image
  • Reward
  • 1
  • Repost
  • Share
ThisIsTranslateContent::
Just go for it 👊
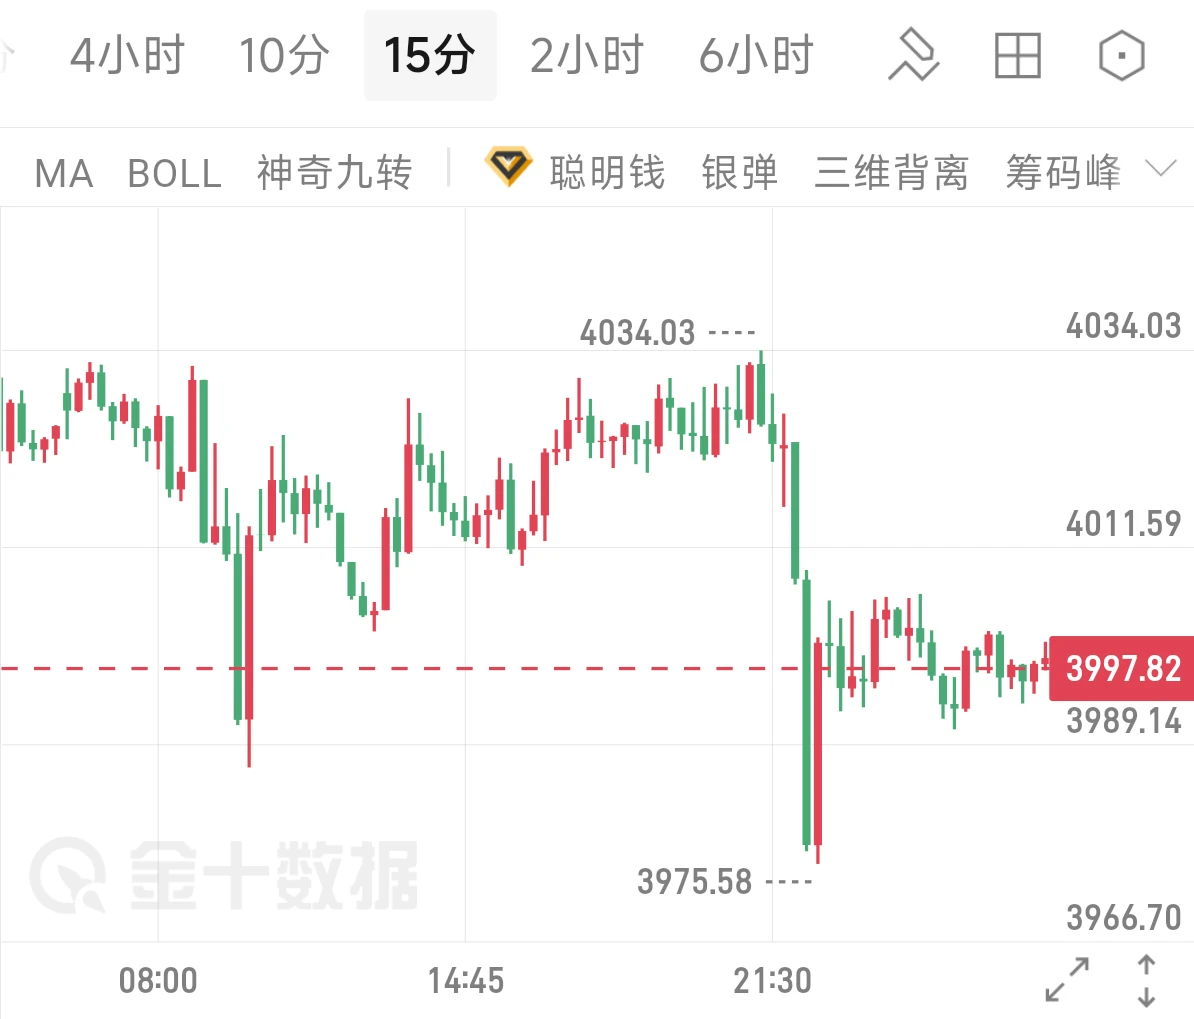
9.4 Gold Afternoon Analysis
Waller’s dovish remarks weighed on the dollar and U.S. Treasuries, while heightened geopolitical risk aversion also helped bulls regain dominance. The major nonfarm payrolls report is due tonight; light positions and waiting are recommended ahead of the data, and blind trading should be avoided.
The daily chart has formed two large bullish candles and held above 4500. The MACD bullish crossover has seen expanding red bars, indicating emerging short-term bullish momentum. Avoid chasing highs this afternoon.
Go long after a pullback stabilizes around 4440-4450; consid
XAUT1.01%
View Original
post-image
  • Reward
  • Comment
  • Repost
  • Share
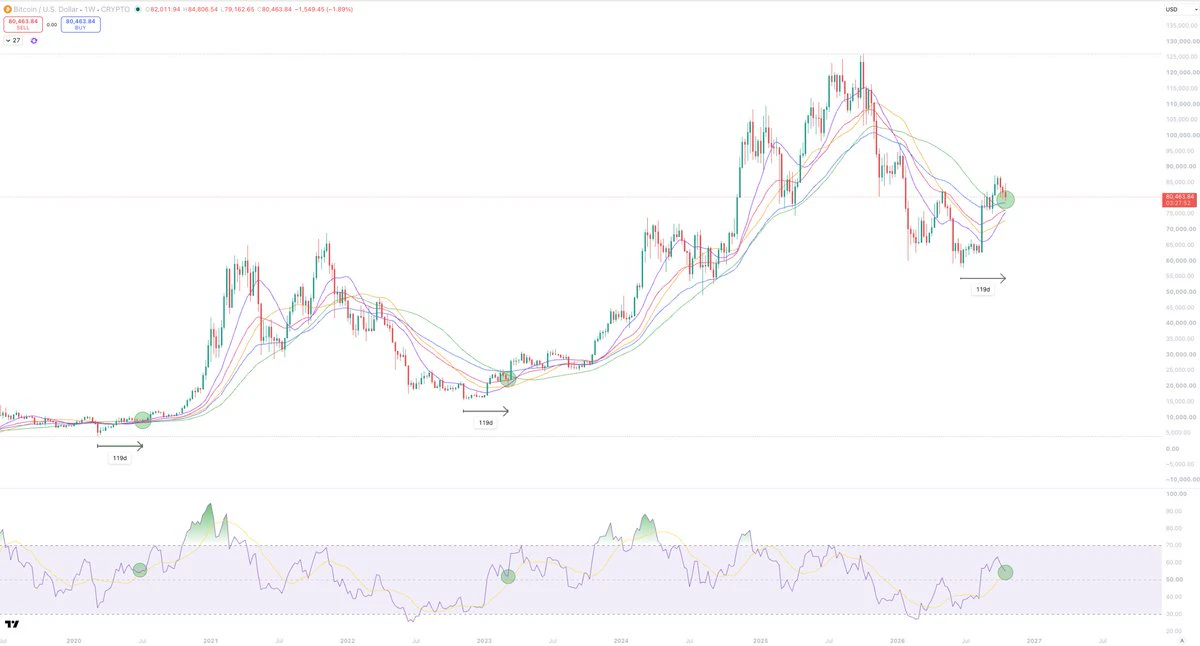
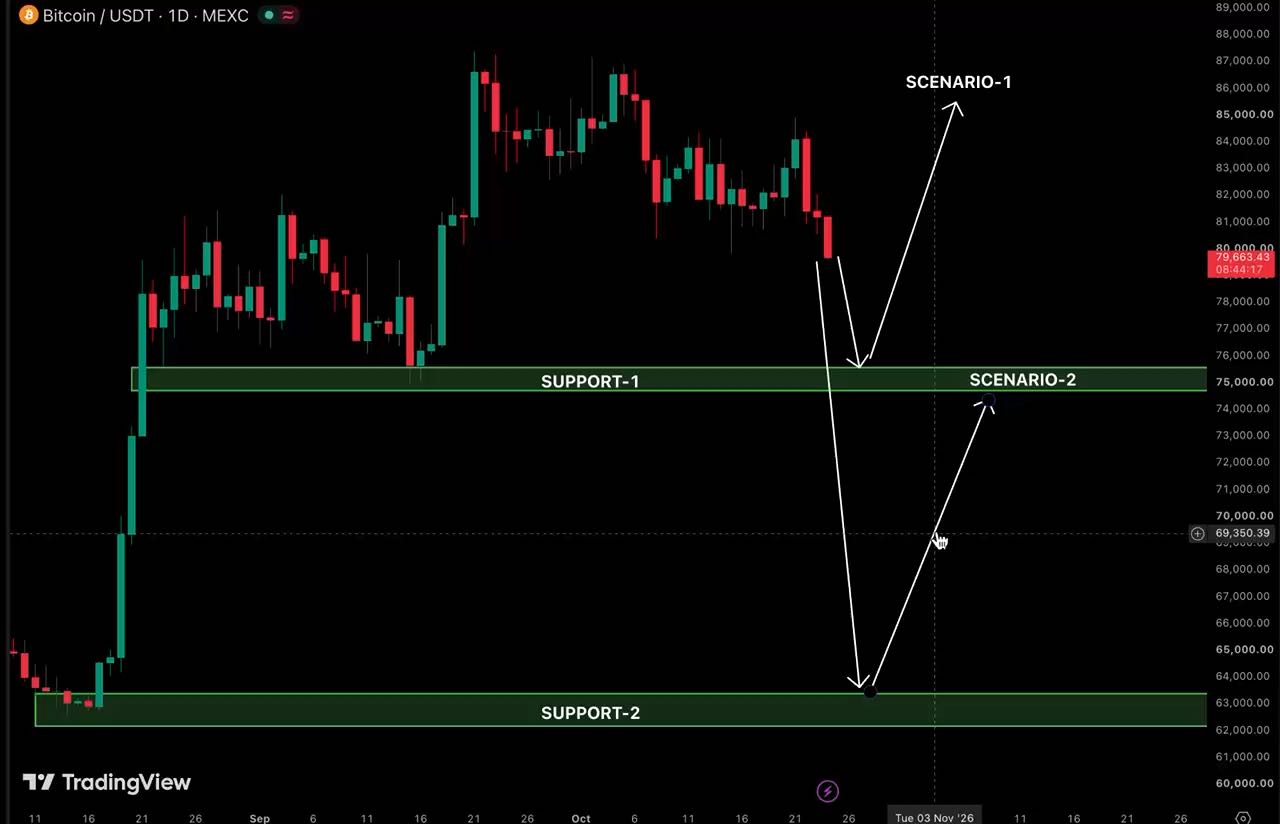
✨️ $BTC is currently about 35% below its all-time high, which puts the market at an interesting level for investors watching for the next major move.
A recovery above $82,800 and $87,500, backed by strong buying volume, could strengthen the bullish setup going into Q4.
For a stronger Q4 rally, I’d watch Bitcoin ETF inflows, Fed rate expectations, liquidity, Treasury yields, the U.S. dollar, spot trading volume and BTC holding key support around $75,000 to $72,000.
When these indicators improve together and Bitcoin starts making higher highs and higher lows, it could provide stronger confirmati
BTC3.90%
post-image
  • Reward
  • Comment
  • Repost
  • Share
#ETH 🚀
One of the most bullish monthly candles in ETH's history. 📈
Any fullbacks into 2-2.1k zone are BIG BUY. 💰
No real monthly resistance until 4k level. 🛡
I do believe next time we go to 4k we break it and we do new ATH's 🌟 $ETH
ETH4.72%
post-image
  • Reward
  • Comment
  • Repost
  • Share
No need to rush in the short term; no need to panic in the long term.
A solo player across all assets, officially back in position.
I don't care about others' opinions; I'm only responsible for my own account.
Profit or loss is my own responsibility; long live happiness.
View Original
post-image
  • Reward
  • Comment
  • Repost
  • Share
Good morning future crypto millionaires 🩵
Rise and shine.
post-image
  • Reward
  • Comment
  • Repost
  • Share
BTC Briefly Breaks Above $82K ! Bulls Regain Momentum. Can Bitcoin Break Through the $83K–$86K?
gate liveLIVE
2,027
live-coin
  • Reward
  • 2
  • Repost
  • Share
ThisIsTranslateContent::
Hop on! 🚗
View More
Load More

Join 40 M users in our growing community

⚡️ Join 40 M users in the crypto craze discussion
💬 Engage with your favorite top creators
👍 See what interests you
  • Pinned