Square
Following
Hot
News
Profile
Share your thoughts
placeholder
Article
crypto market update
live-cover
LIVE2,102
One #Crypto that's about to be painted green
👇
post-image
#USSeptemberPPIBeatsExpectations Which sector is most worth positioning for?🔮 Which sector is most worth positioning for?🔮 Which sector is most worth positioning for?🔮 Which sector is most worth positioning for?🔮 Which sector is most worth positioning for?🔮 Which sector is most worth positioning for?🔮 Which sector is most worth positioning for?🔮 Which sector is most worth positioning for?🔮 Which sector is most worth positioning for?🔮 Which sector is most worth positioning for?🔮 Which sector is most worth positioning for?🔮 Which sector is most worth positioning for?🔮 Which sector is
AI
Next Fable Model (5.2+) released by...?
December 31
99%1.01x
October 31
88%1.14x
$57.86K 24H+10 more
High-rise residences still aren’t safe.
If one apartment catches fire, the entire floor suffers.
anyway all ragebait posts & misogynistic retweets aside;
- I remain bullish on HTF, Q4, 2027-2028
- I don't think we trade under 65-70k ever again, bear lows were in and I will ride my bottom buys into the end of decade
- Macro is a bit scary here, things could get choppy, nothing goes up in a straight line
- On macro point however, many headwinds right now that, for most of the time throughout history, usually resolve themselves and become tailwinds for risk/liquidity driven assets
- Spot and chill is key, have liquidity for high conviction trades, slam them hard when they come
- There will b
post-image
Strive Buys $280M in BTC, Its Largest Purchase in Months
Strive is piling into Bitcoin at its fastest clip of the year, scooping up another 3,311 BTC worth roughly $280 million in its biggest single purchase since January.
The Nasdaq-listed asset manager, which trades under the ticker ASST, disclosed in a filing Monday that it bought the Bitcoin between Oct. 5 and Oct. 9 at an average price of about $84,500 per coin, including fees. The buy lifts Strive’s total holdings to 32,773 BTC, worth roughly $2.73 billion at today’s prices, up from 29,462 BTC a week earlier.
⚠️ Personal market analysis
post-image
ASST+3.93%
BTC+0.78%
Let me say one thing for those who are bullish $ONDO , and one thing for those who are bearish.
The bullish side needs to prove that buyers are stepping in above 0.4716; the bearish side needs to prove that no one will catch it after 0.4221 is lost. $ONDO is currently at 0.4687, up 5.23% in 24 hours. The 1-hour support is 0.4221, resistance is 0.4716, and current volume is 0.37 times the average volume of the past 20 bars.
Before both sides have presented all their evidence, I am more concerned that $ONDO remains strong and that the crowded positioning is already out in the open. I acknowledge
post-image
ONDO+5.57%
BREAKING: Google reduces quantum computing errors by 40x using magic state cultivation on its Willow processor, published in Science.
post-image
GOOGL+0.37%
$HYPE HYPE: Bullish Structure Faces Another Important Test
HYPE has pulled back sharply from its September all-time high at $97.99, with the subsequent rally failing at $95.22. Price has retraced almost 50% of its August–September advance, weakening short-term momentum.
The 100/50-day EMAs remain bullishly crossed, suggesting the broader recovery has not broken down. However, price is below the 100-day EMA and trading between the two averages.
HYPE is approaching the significant $75–$77 support zone, which has attracted buyers several times over the last four months. The 50-day EMA and 0.5 Fib
post-image
HYPE+1.54%
( new streamer) market overview
live-cover
LIVE1,520
Insiders are calling the SYMBOL long setup the best kept secret of 2026.

$BTC /USDT - LONG

Trade Plan:
Entry: 82016.6 – 82308.2
SL: 80762.7
TP1: 83212.2
TP2: 83912.0
TP3: 84961.8

Why this setup?
Why now? The daily trend is firmly bullish, the 1h ATR of 583.19 signals strong volatility, the 15m RSI at 48.41 shows room to run before overbought, and the entry zone around 82162.4 aligns with the 1h price of 82163.9. The first target sits at 83212.2, the second at 83912.0, and the third at 84961.8, giving the trade defined upside. The line in the sand is 82416.4; breaking below invalidates th
BTC+0.75%
$FET What is most interesting right now is not guessing whether prices will rise or fall, but seeing who is forced to change their stance first.
The bulls’ test is at 0.2122, while the bears’ test is at 0.1898. $FET is currently at 0.2075, up 4.32% over 24 hours. The 1-hour support is 0.1898, resistance is 0.2122, and current volume is 0.25 times the average volume of the past 20 candles.
I’ll first note that $FET’s 1-hour chart has moved, while the 4-hour chart has yet to confirm it, because I treat shorter timeframes as alerts, not conclusions; without confirmation from the larger timeframe,
post-image
FET+4.21%
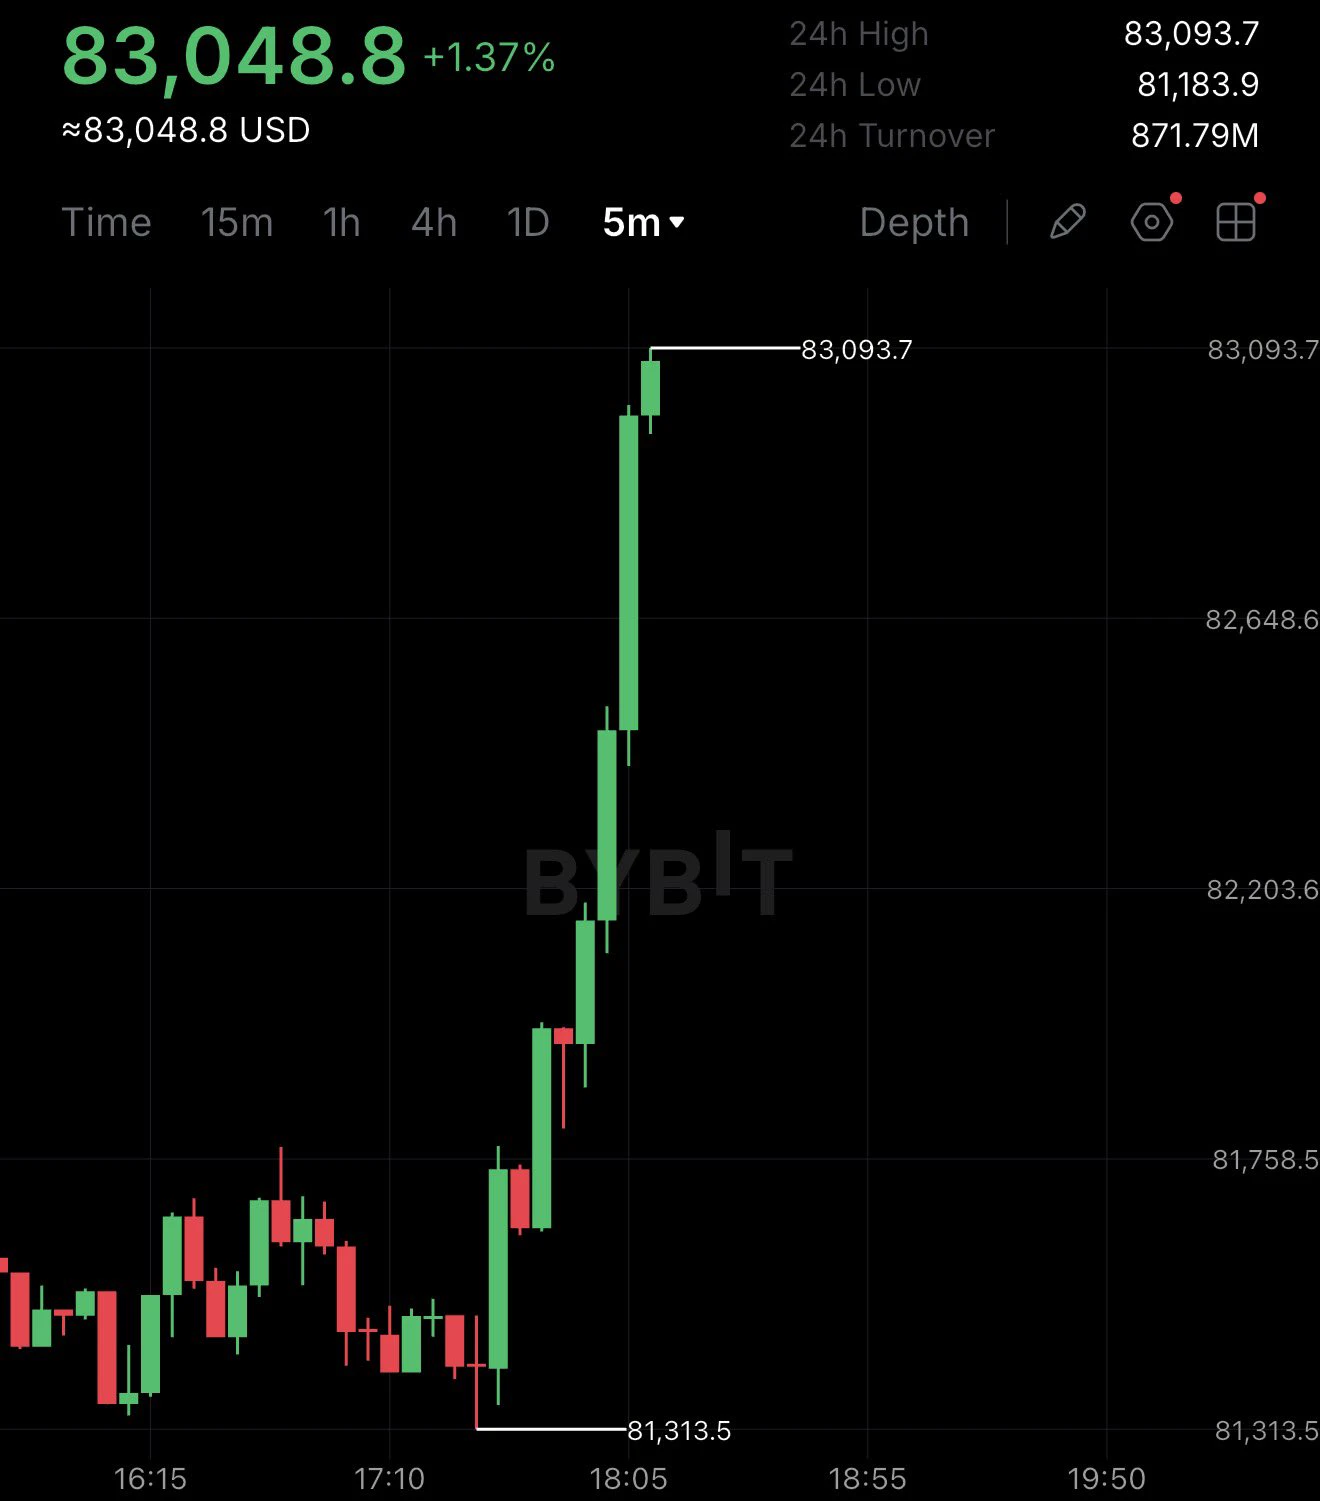
Yang Guang bit | October 16 $BTC CPI-triggered V-shaped rebound after an unexpectedly sharp plunge, short at 82700 resistance and long at lower levels
【Today's Plan】
Short on rebound (main strategy): Lightly short at 82700–83000 on a rebound, stop-loss at 83400, targets 82000–82200 and 81300–81500
Long on pullback (secondary): Enter a short-term long at 82000–82200 on a pullback, stop-loss at 81600, targets 82700–82900
【Key Conclusion】
BTC plunged to a low of 79725 yesterday after CPI exceeded expectations, then rebounded sharply to around 82500, driven by a rebound in U.S. stocks and a pullba
post-image
BTC+0.75%
$PYTH What is most interesting right now is not guessing whether prices will rise or fall, but seeing who is forced to change their tune first.
The bulls' test is at 0.10094, while the bears' test is at 0.08063. $PYTH is currently at 0.09293, up 8.79% over 24 hours. One-hour support is 0.08063, resistance is 0.10094, and current volume is 0.21 times the average volume of the past 20 candles.
First, I note that after $PYTH's sharp 24-hour rise, momentum and continuation are not the same thing, because I do not extrapolate an already completed large move into the next leg; I first look at whethe
post-image
PYTH+9.83%
10.16 BTC morning review:
The current 4-hour chart shows a “big rise, short decline” oscillatory recovery pattern. Looking back, after yesterday’s wick broke below 80,000 and touched around 79,700 at the lowest, it rebounded; BTC is currently trading around the 82,200 level, while ETH is trading above 2,440. The 4-hour structure remains below the middle band, with the overall price in the middle-to-lower Bollinger Band region.
Resistance around 82500-83000, down to around 81500-80800
Resistance around 2460-2490, down to around 2420-2380
The above is solely a personal view and does not constitu
post-image
BTC+0.78%
ETH+0.71%
October 16 Strategy Plan Priority Ranking, for Followers Only
Execution Priorities for Today
My execution order:
2455—2467: short if rejected
2420—2430: go long on a pullback
If it breaks below 2398, short near 2400 on a rebound
If it breaks effectively above 2467, go long after a pullback confirmation
No operation in the middle range of 2435—2448
Current bias:
> Above 2400, favor range-bound bullish movement; handle 2455—2467 with a bearish bias. The real direction confirmation points are: a break above 2467 or a break below 2398.
$ETH
post-image
ETH+0.70%
#USSeptemberPPIBeatsExpectations BITCOIN TARGETS $93,000
$BTC appears to be trading inside an ascending parallel channel.
After bouncing from the channel’s lower boundary, Bitcoin could now be setting up for a rally toward the mid-range at $88,000.
If momentum continues, the next target sits at the top of the channel around $93,000.
BTC+0.78%
  • 1
Mantle's treasury holds $2,278,697,265 as of October 14. Beyond MNT, it includes $289,957,751 in ether, $241,777,567 in bitcoin and $111,168,809 in stablecoins.
@Mantle_Official
MNT+1.64%
BTC+0.78%
Load More

Join 40 M users in our growing community

⚡️ Join 40 M users in the crypto craze discussion

💬 Engage with your favorite top creators

👍 See what interests you

Trending Topics

USSeptemberPPIBeatsExpectations

91.35k Views1.89k Discussing

US September PPI came in at 6.3% YoY, well above the 5.3% market expectation, pointing to renewed producer-side inflation pressure. Weekly jobless claims were 199K, broadly in line with forecasts. Could hotter inflation further reduce room for rate cuts, and what does it mean for $BTC, US stocks, and gold?

DrLinHanSpeaksAtOxfordUnion

135.63k Views1.86k Discussing

JapanAndKoreaStocksPlunge

47.27k Views1.76k Discussing

View More