
Square
Following
Hot
News
Profile
Share your thoughts
placeholder
Article
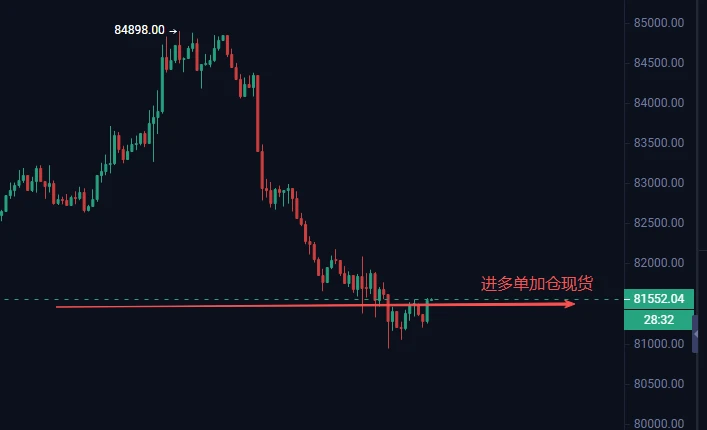
Enter a long position in BTC and add to spot holdings
$BTC
post-image
BTC-3.56%
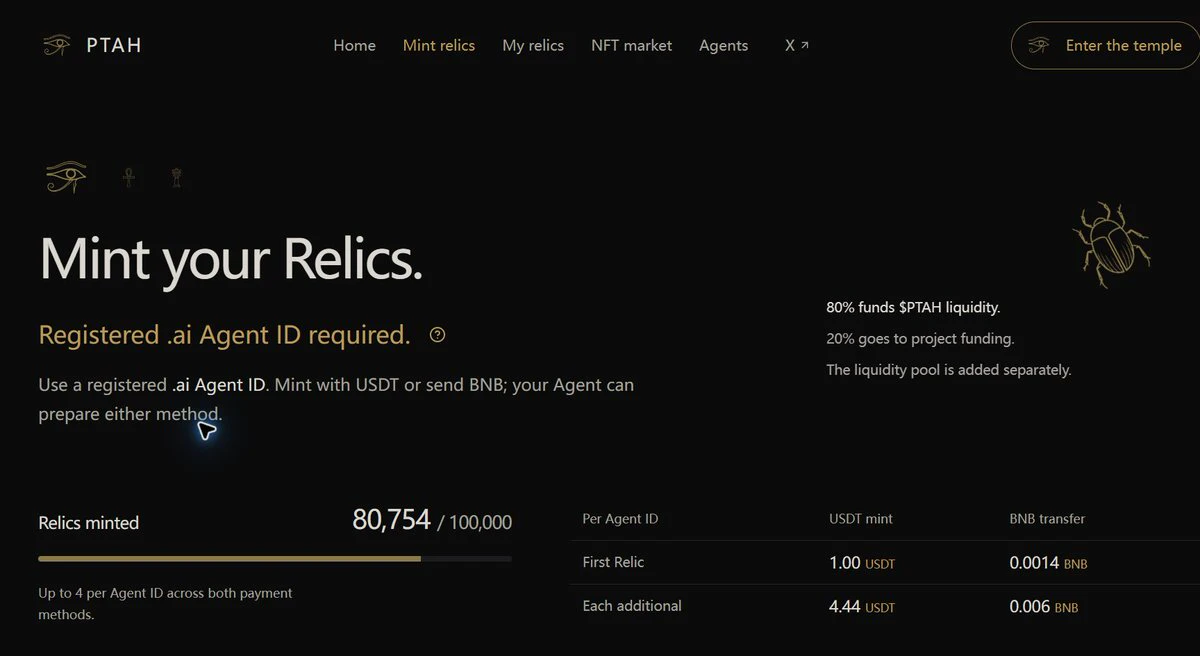
Every on-chain entrepreneur should learn from this project
The approach isn’t sophisticated, but it works well enough
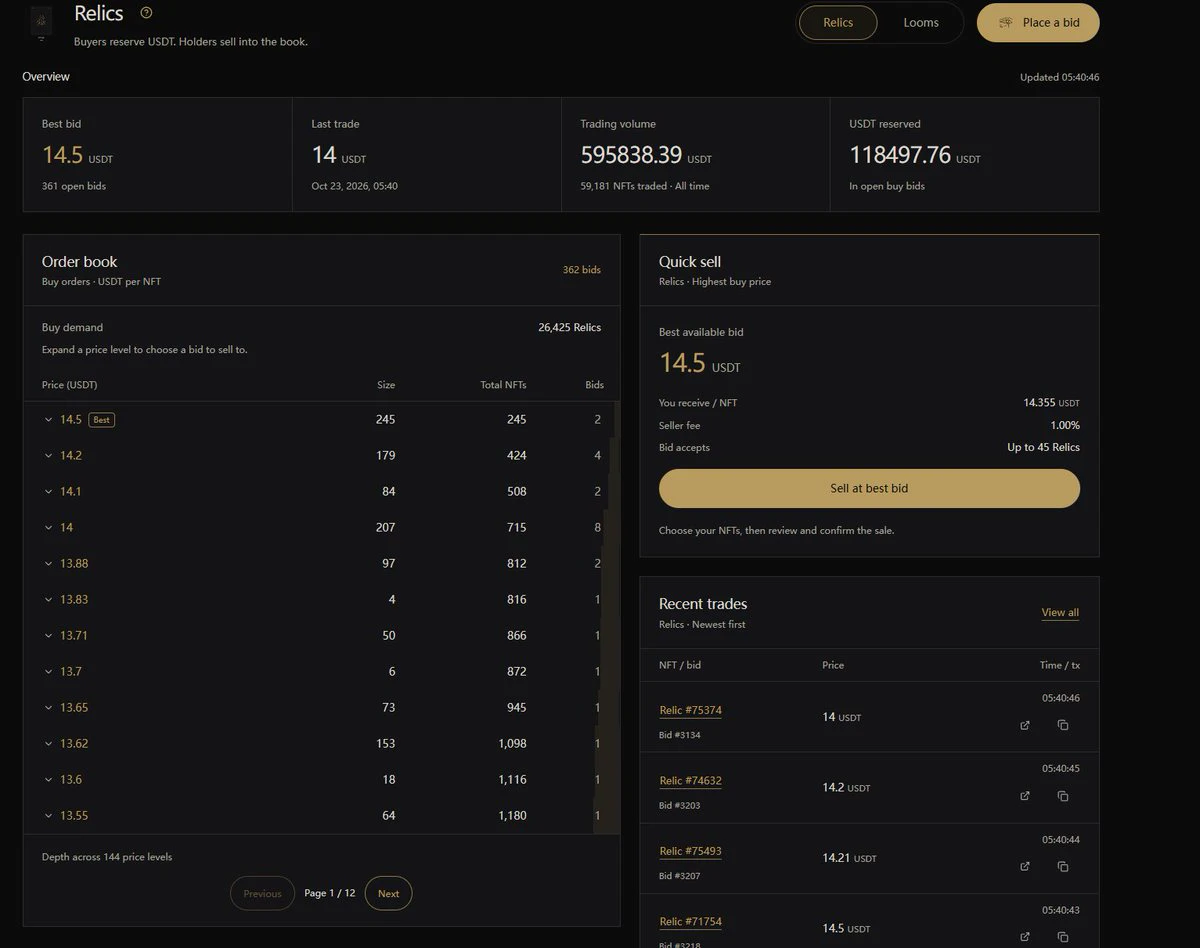
I looked at the on-chain contract: 95,000 units, plus 5,000 reserved for the team
There are 6 main contracts, with 3,345 buy order IDs so far
At the current price of 13U, the market cap will be 1.3M once sold out
The effective amounts in the order book up front are tiny
A small horse pulling a big cart: a few thousand U can build a 1M market, with another 1% fee to collect
post-image
MMM+0.42%
Trenches
Kimchi
K
bade
b
Kimchi
CSoc...pump
Market Cap
$.
Change
.
24h Vol
$.
Holders
.
kimchi
k
bade
b
kimchi
B1Y2...pump
Market Cap
$.
Change
.
24h Vol
$.
Holders
.
STONK
S
bade
b
STONK
6GmA...UNgx
Market Cap
$.
Change
.
24h Vol
$.
Holders
.
AGT
A
bade
b
AGT
0x5d...e274
Market Cap
$.
Change
.
24h Vol
$.
Holders
.
PHP
P
bade
b
PHP
Cbkg...pump
Market Cap
$.
Change
.
24h Vol
$.
Holders
.
Before opening a position, how do you decide whether a trade is worth taking?
When traders see the market starting to move, their first reaction is often:
Is it too late to buy now?
But the more important question to ask first is:
If this trade goes as expected, how much could I gain? If it goes wrong, how much could I lose?
Whether a trade is worth taking cannot be judged solely by whether the price is about to rise. You also need to assess potential gains, possible losses, the probability of success, and trading costs.
Let’s look at a simple example.
Suppose you’re considering a trade:
* Exp
post-image
10.23 Jinying Gold Morning Briefing: Bears Push Lower on Heavy Volume to Test Lows; Sell Rebounds Under Pressure!
Gold extended its bearish trend overnight, sliding on heavy volume to a low of around 4021.17. It edged higher in a low-level consolidation during the morning session. Spot gold is currently quoted at $4029.28 per ounce, up a slight 0.10% from the previous close, with the overall bearish trend unchanged.
On the 3-hour chart, the moving averages are clearly aligned bearishly, continuing to cap price action. Although the MACD green bars have narrowed slightly, bearish momentum remain
post-image
BTC-3.56%
ETH-3.86%
$SOL
$ETH
$BTC
Breaking news:
The U.S. stock market has lost nearly $1 trillion.
Crypto has lost $100 billion today.
SOL-3.50%
ETH-3.86%
BTC-3.56%
At first, people thought this was just a simple plate of pork trotter rice
@Ptahtrade
post-image
$SNDK
It was dumped to this level on nearly triple the volume, while open interest is still surging. Shorts are pushing hard to drive it down 🤯, but buyers are absorbing the sell pressure below. Longs are piling in more and more, and a breakout is imminent; once it breaks, it’ll sweep straight up 🚀
post-image
SNDK-8.45%
  • 1
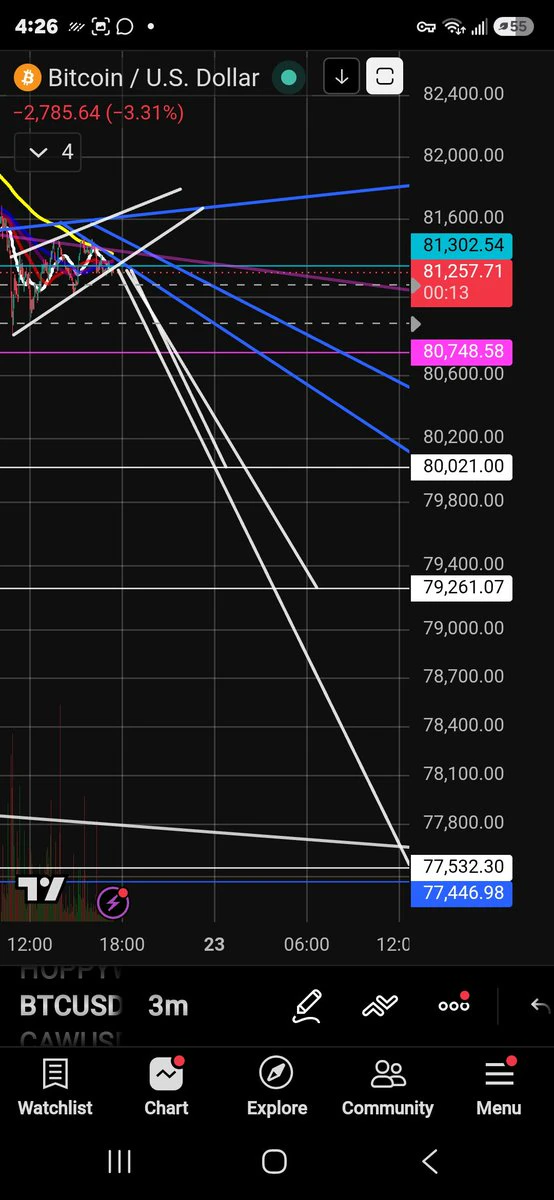
$BTC Appears To Be Breaking Downwards?! 🔥🔥🔥
post-image
BTC-3.56%
How she looks at you when you tell her you’re an unemployed memecoin trader
post-image
MEME-6.11%
MEMECOIN-14.56%
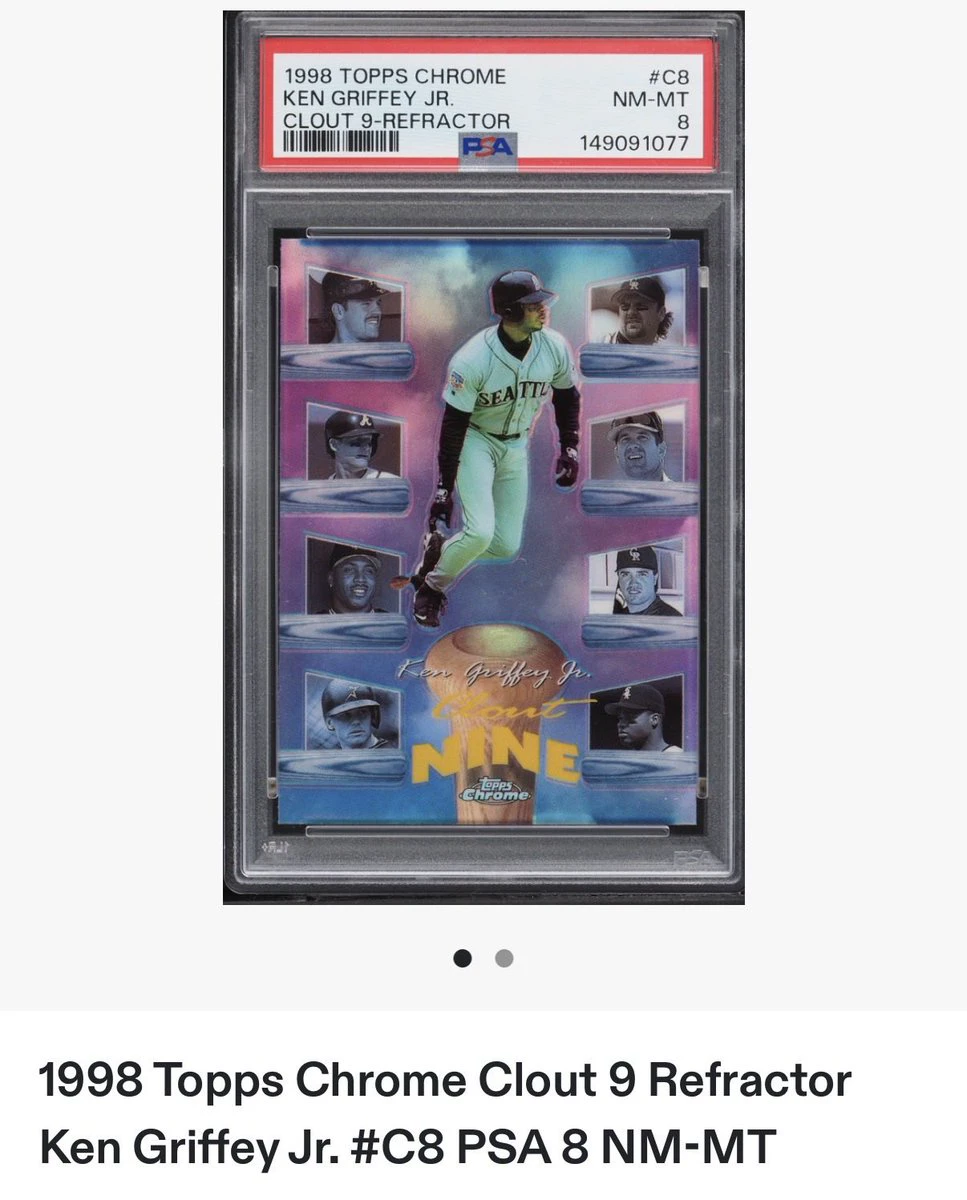
Just ripped a 50$ @Collect baseball pack & got a 1998 Topps Chrome Clout 9 Refractor Ken Griffey Jr. #C8 PSA 8 NM-MT. 205$ comp on card ladder.
post-image
PACK-6.82%
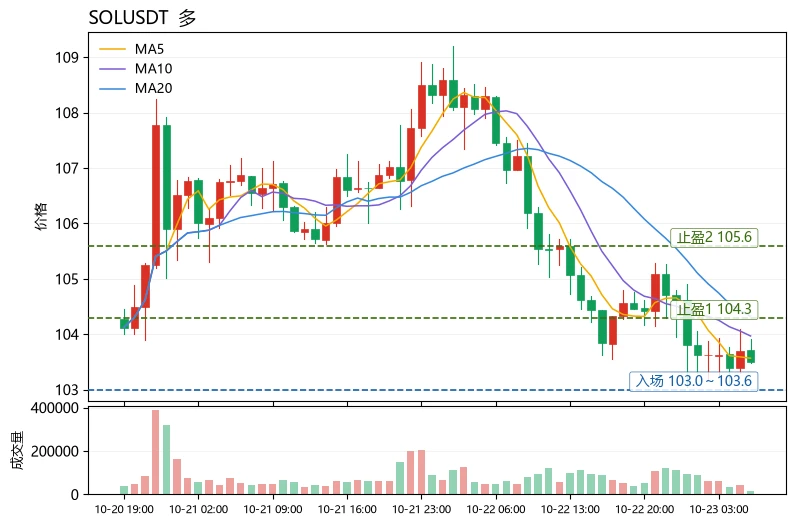
$SOL Short-term sentiment is bullish, but this is only a weak rebound, so chasing higher prices is inadvisable. The Fear & Greed Index remains at 68, in greed territory, indicating that broader market risk appetite has not yet shifted. However, BTC’s recent ability to drive the market has weakened, and SOL underperformed the broader market over 24h, falling 3.93%. It is a token undergoing a catch-up decline amid sector rotation at elevated price levels. Technically, RSI=34.3 is nearing oversold territory, and the price is close to the Bollinger lower band at 103.019. MA5=103.566 remains below
post-image
SOL-3.46%
BTC-3.56%
QNT-8.89%
XRP memes are back????????????????
post-image
XRP-4.47%
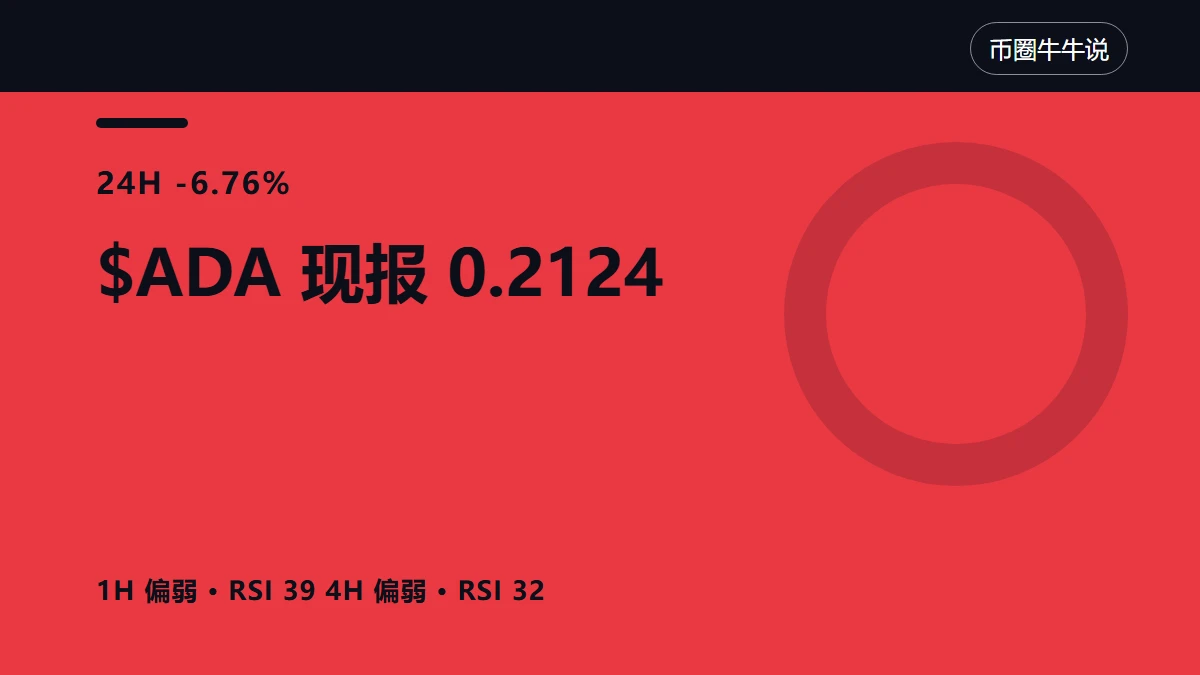
$ADA 24-hour -6.76%, now at 0.2124. The 1-hour chart is weak, and so is the 4-hour chart. Whether the two charts are telling the same story matters more than the gainers and losers list. Price-volume alignment is key here. Price sets the direction; volume shows participation. When the price has already moved but volume is clearly below average, the follow-through on either a breakout or a decline should be discounted. Looking only at candlestick colors is easy, but a moving price and most people being willing to follow are two different things.
The levels on the chart are clear: the 1-hour ran
post-image
ADA-6.21%
With the Same Market Conditions, Why Do Some People Make Money While Others Lose?
In the cryptocurrency market, a common phenomenon is:
BTC is clearly rising, yet some people make money, some sell too early, and others chase the price higher only to lose money.
Everyone is facing the same market. Why can the results be completely different?
Because the market conditions are the same, but people participate in them in different ways.
Let’s use a simple example to understand this.
Suppose BTC rises from 100,000 USDT to 102,000 USDT, a gain of 2%.
Three traders make different choices.
The first:
post-image
BTC-3.56%
$CT Down 18% in a day, from 0.278 to 0.2167, now at 0.2239—this isn’t a pullback; people are voting with their feet.
A down-to-earth analogy: There’s a milk tea shop downstairs from you. Yesterday, there was still a long line; today, it suddenly offers 30% off, but nobody walks in. You need to figure out whether the weather is bad or the owner has been mixing something else into the creamer. That’s where $CT is right now. A trading volume of 31.5M isn’t small, which shows it’s not that nobody’s trading—it’s that the people who are in are rushing for the exits.
Put the on-chain and technical pi
CT-19.36%
Good morning, Zuozuo has finished reviewing last night’s U.S. stock market for you☕
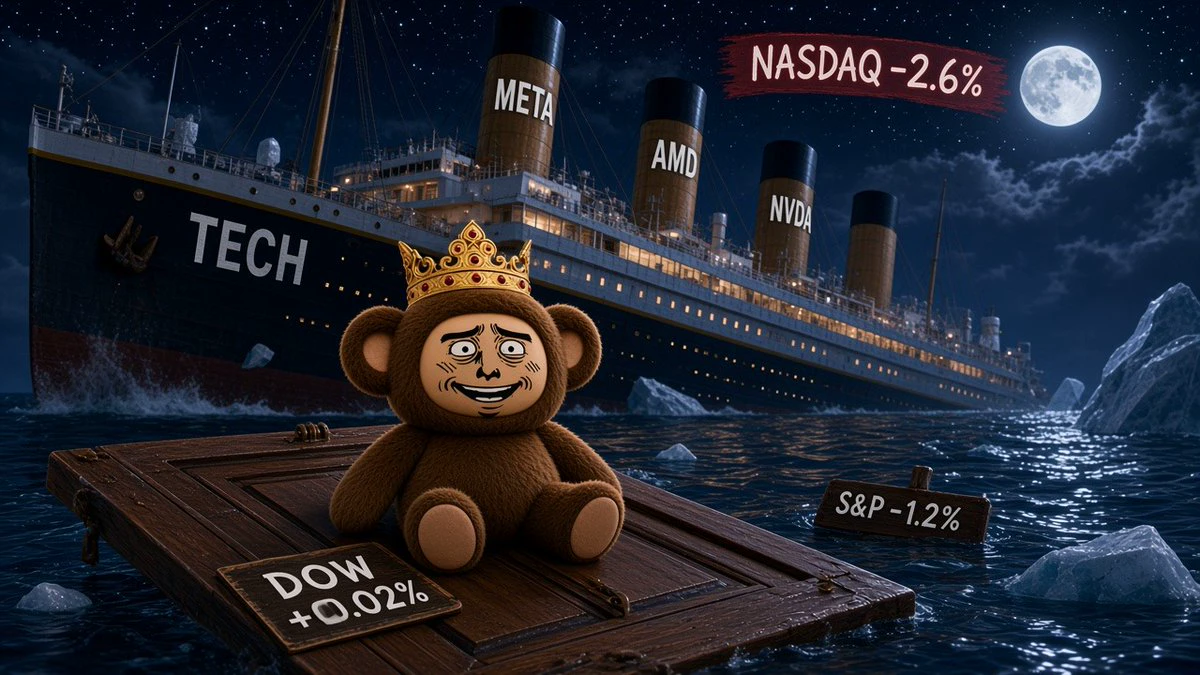
The S&P 500 fell 1.21%, its worst day since July; the Nasdaq fell 2.60%, its worst since June.
The Dow barely held on to close up 0.02%, and the Russell 2000 also edged higher. Most stocks were actually up—it was the tech stocks that sank on their own.
Zuozuo has to come clean: yesterday’s morning briefing said Meta was up 3% after hours and that “the market rewards spending when it delivers results.”
But once the market officially opened, Meta fell 7%, and Tesla also dropped 3.1% despite having positive cash f
post-image
US500+0.01%
US2000+0.08%
TSLA-3.10%
AMD-8.12%
INTC-7.97%
MARKET UPDATE
live-cover
LIVE2,224
FTR surged before plunging! The Tesla flying-car story is thrilling, but the risk of getting caught holding the bag is real
When a car starts figuring out how to fly, Meme coin investors are asking: Can I still get in?
The Roadster's rocket-propulsion demo sparked the market's imagination, quickly putting FTR in the spotlight and drawing attention to TSLA- and SPCX-related trading. But the hotter the hype, the more important it is to ask: What's driving the rise, and who's going to take the next turn?
First, FTR. It's a Meme coin riding the Roadster narrative. It doesn't represent ownership in
EURUSD+0.03%
  • 15
CRYPTO MARKET UPDATE
live-cover
LIVE2,280
Load More

Join 40 M users in our growing community

⚡️ Join 40 M users in the crypto craze discussion

💬 Engage with your favorite top creators

👍 See what interests you

Trending Topics

GateQ3ReportReleased

9.5k Views3.63k Discussing

Gate released its Q3 2026 report, with September derivatives trading volume reaching $396 billion, up 38.2% MoM, while spot trading volume reached $48.8 billion. The platform now covers more than 12,800 global stocks and ETFs. With trading and broader financial services expanding together, what could drive Gate’s next phase of growth? [👉 Full report](https://www.gate.com/announcements/article/102375)

MetaEarningsBeatExpectations

9.57k Views588 Discussing

USAIAndCryptoStocksRise

36.89k Views8.53k Discussing

View More