





Share your thoughts
placeholder
Article
$LINK ‌ – Chainlink Holds Above $12 After 50% Monthly Run, Key Resistance at $12.70 in Focus
Current Market Data:
· Last Price: $12.324 (+5.9%)
· Mark Price: $12.323
· 24h High: $12.463
· 24h Low: $11.609
· 24h Volume (LINK): 910.1K
· 24h Volume (USDT): 10.9M
---
The Catalyst:
Chainlink (LINK) has surged nearly 50% over the past month, pushing past $12 on the back of two major partnership announcements.
1. Bottomline Partnership – $16 Trillion Payment Flow
On September 3, Chainlink announced a strategic partnership with Bottomline, a top-three provider of SWIFT services that serves more than
post-image
LINK+4.64%
  • 4
Most traders see LINK's bullish daily trend—I see a 4h trap set to trigger at 12.243.

$LINK /USDT - SHORT

Trade Plan:
Entry: 12.213 – 12.273
SL: 12.620
TP1: 11.960
TP2: 11.771
TP3: 11.488

Why this setup?
Why now? The 1D trend says up, but the 4h structure says otherwise.
- RSI 15m at 52.17—no momentum to break higher.
- ATR 1h at 0.12—tight coil, ready to snap.
- Entry zone 12.213–12.273 aligns perfectly with a liquidity grab before shorts run to TP1 11.960.
- 84% confidence isn't a guess; it's a freight train. The bullish daily is the bait.

Debate:
Are you fading the daily upt
LINK+4.64%
$FLOCK reportedly has a partnership with Alibaba.
post-image
FLOCK+41.19%
$FLOCK Signal】Long: Buy-depth imbalance + 4H MACD expansion
$FLOCK Buy-depth imbalance at 10.27%, Bid/Ask 1.23, 4H MACD red bars expanding, current price 0.07176 near the upper Bollinger Band at 0.0727. 1H RSI 71, funding rate 0.005%, longs are not overheated.
🎯Direction: long
⚡Entry/Limit order: 0.0715447 - 0.0717600 (enter directly in the current price area)
🛑Stop-loss: 0.0710424
🚀Target 1: 0.0728364
🚀Target 2: 0.0733746
🛡️Trade management:
- Execution strategy: Reduce the position by 50% after reaching Target 1, and move the stop-loss up to breakeven. If the price falls back to the en
post-image
FLOCK+41.90%
Chinese food: beef with shiitake mushrooms, plus a serving of pork rib soup with tea tree mushrooms. 45 yuan, seems pretty good.🐷🐷🐷
post-image
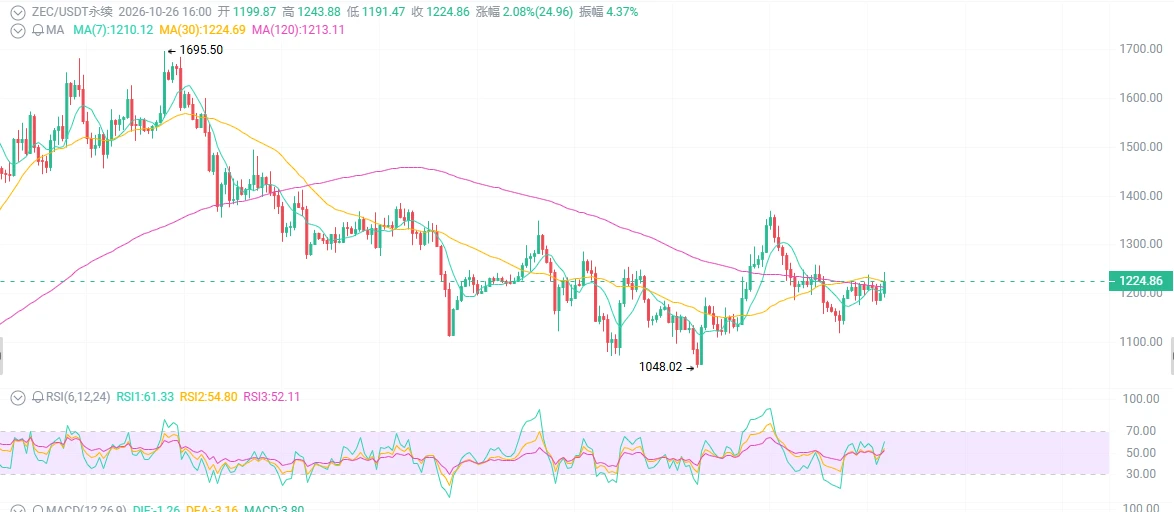
Everyone’s cheering ZEC’s bull run—but the 4h clock just struck 84% short confidence.

ZEC/USDT - SHORT

Trade Plan:
Entry: 1165.66 – 1178.98
SL: 1255.43
TP1: 1109.99
TP2: 1068.43
TP3: 1006.09

Why this setup?
- 1D trend says bullish, yet 15m RSI is screaming 82.11—overbought exhaustion at the top.
- Price pinned at 1172.32, hugging the 1h ATR (26.63) like a coiled spring.
- The “waiting” status means the trap is set: TP1 at 1109.99 is a 5.3% drop, TP2 at 1068.43 is 8.8%—while invalidation sits far below at 935.53.
- Why now? The 4h structure is fading momentum against a daily uptrend
ZEC+16.16%
$IOST Signal】4H bullish continuation + 1H low-volume pullback
$IOST RSI 90.27, after a short-term spike to 0.0008125, it fell back to 0.0007782. The 4H MACD histogram is expanding, while the 1H MACD histogram is narrowing. Depth imbalance: -39.21%, with sell-side depth dominant. The price has consistently held above 0.00075. Funding rate is 0.01%, OI is flat, and no long positions have been seen exiting.
🎯Direction: long
⚡Entry/Limit Order: 0.000777033 - 0.000778200
🛑Stop-loss: 0.000770418
🚀Target 1: 0.000789873
🚀Target 2: 0.000795710
🛡️Trade Management:
- At Target 1, reduce the positio
post-image
IOST+28.31%
BTC+0.14%
ETH+2.17%
SOL+3.29%
Back in May, I published a YouTube video explaining why I was setting limit orders and accumulating $ZEC around $305.
Since then, price has reached that level and gone on to rally more than 280%.
A good example of the importance of having a clear thesis, identifying key levels in advance, and remaining patient when the market presents the opportunity. #zecash
post-image
ZEC+16.09%
#USELESSSurgesAnother67% USELESS Surges Another 67%: Momentum, Market Attention, and the Risks Behind the Rally
USELESS surging another 67% represents a dramatic move that is likely to attract significant attention across the cryptocurrency market. A percentage increase of this size in a relatively short period highlights the extraordinary volatility that can exist within digital assets, particularly tokens experiencing rapid increases in trading activity and market visibility.
Sharp rallies often begin when market participants identify a compelling narrative, growing community interest, impro
USELESS+6.55%
BTC+0.14%
🚀 ZEC/USDT Goes Parabolic: A Multi-Timeframe Technical Breakdown 📈
ZCash ($ZEC ) is putting on an absolute clinic right now, surging over +15% to test the $1,195.00 resistance. The momentum across all timeframes is undeniably bullish. Let’s dive into the charts to see where the market might be heading next!
📅 The Macro View (1-Day Chart)
Looking at the daily timeframe, $ZEC has executed a massive parabolic move since bouncing from the $450 region in late July.
Moving Averages:
The MA5, MA10, and MA30 are beautifully fanned out and angling steeply upward, sign
ZEC+16.09%
  • 4
  • 1
#USELESSSurgesAnother67% 🚀🔥
$USELESS is making serious waves in the crypto market, jumping another 67% and attracting fresh attention from traders. 📈👀
The explosive move shows just how quickly momentum can build around trending tokens. Now the big question is whether $USELESS can keep the pressure on and extend this rally even further. 🔥
📊 +67% surge
⚡ Strong momentum
👀 Traders watching closely
Would you chase the move, or wait for a pullback? 🤔
#USELESS #Crypto #Altcoins #CryptoMarket
post-image
USELESS+6.55%
BTC & ETH Weekly Structure Improves! Could a Strong Close Set Up Next Week’s Rally?
live-cover
LIVE1,361
JUST IN: Serenity warns storage shortages remain tight with supply-demand gaps potentially widening; evidence points to higher prices and persistent bottlenecks, keeping pricing power with storage majors $ (no specific ticker given)
post-image
$SOL Signal】1H momentum resonance, targeting a long-side impulse
$SOL 1H RSI 73.92, MACD histogram 0.2656 continues to expand, and the price is touching the upper Bollinger Band. 4H MACD is expanding in sync, with momentum aligned across both timeframes. Order book depth imbalance is -8.74%, and the thickness of sell orders indicates short-term pressure has not eased.
🎯Direction: Long
⚡Entry/Limit Order: 105.7518 - 106.0700
🛑Stop Loss: 105.0093
🚀Target 1: 107.6610
🚀Target 2: 108.4566
🛡️Trade Management:
- Execution strategy: After reaching Target 1, reduce the position by 50% and move t
post-image
SOL+3.34%
Everyone’s watching $H /USDT bounce—but 95% confidence says that bounce is a lie.

$H /USDT - SHORT

Trade Plan:
Entry: 0.07489 – 0.07553
SL: 0.07825
TP1: 0.07293
TP2: 0.07141
TP3: 0.06913

Why this setup?
- 1D trend is **bearish**; the 4h setup is armed for a short, not a scalp.
- RSI (15m) at 40.51 shows weak relief, not reversal—buyers are exhausted.
- Entry ref 0.07521, but the real pressure sits below TP1 at 0.07293. Why wait? The ATR (0.001266) confirms low volatility = easy downside glide.

Debate:
If you had 95% confidence on a short, would you enter at 0.07521 now or wait for
H-11.01%
They say those who know how to buy are apprentices, while those who know how to sell are masters. For exiting this long position, I used a 70/30 approach: after the first push upward, I reduced most of the position and defended the remainder with a protective stop. This approach helped me relax a lot mentally, without having to anxiously watch the market every day.

The trade was not particularly smooth from entry to realization. After the price broke out, it pulled back once. I had doubts at the time, but because there was still some buffer above my cost basis, I ultimately chose to keep hol
post-image
XRP+1.21%
ETH+2.20%
Based on current market information, the probability of a Bitcoin pullback in the short term (the next few days) is relatively high, but the specific probability varies depending on the time frame and triggering conditions.
---
Short-term technical outlook: approximately 55%-65% probability of a decline
Multiple technical analyses point to short-term pullback pressure:
· "The night before a major market shift": Trading volume hit a recent low on September 6, and the market entered a state of extremely low-volume consolidation. Bulls and bears are extremely balanced in the 79,500-80,100 range,
post-image
BTC+0.14%
BZ+1.11%
BTC returns to $78,000! The market rebounds after finding suppor
live-cover
LIVE75
The September 11 CPI could be the most important data point for the crypto market in 2026.
Without question.
On August 27, the probability of a rate hike was 36.5%.
On August 28, Warsh spoke at Jackson Hole, and within a single day, the probability surged from 35% to 70%.
On September 3, Waller came out and said he “leans toward keeping rates unchanged,” sending the probability back down to 50%.
On September 4, August nonfarm payrolls were released—162k jobs added, three times expectations. The probability climbed above 60%.
Within a week, the market ran back and forth between “hike” and “no h
post-image
BTC+0.14%
  • 2
If you’re currently holding trapped positions in Bitcoin or Ethereum, don’t rush to add to them.
After the nonfarm payrolls report, market expectations for the Fed’s policy have started shifting again, and short-term volatility will continue to increase.
At times like this, the most important thing isn’t listening to people in the market shouting about going long or short.
It’s reassessing your positions.
Understanding them before taking action is more important than rushing to act.
There have clearly been more people asking about positions these past two days, and I understand why.
After gett
post-image
BTC+0.14%
Load More

Join 40 M users in our growing community

⚡️ Join 40 M users in the crypto craze discussion

💬 Engage with your favorite top creators

👍 See what interests you

View More