





Square
Following
Hot
News
Profile
Share your thoughts
placeholder
Article
With the same 1000U, some people are holding the bag at $WAL 0.0677, while others who bottom-fished at 0.0502 are already laughing. It is now 0.0512, down 15.7% in 24 hours, with a 565M trading volume—what does that indicate? Panic sellers are fleeing, but with selling this fierce, who is taking the other side?
Round one: the volume showdown. A 565M trading volume at this market-cap level means the turnover rate has been pushed to the limit. Rising volume during a decline either means the main players are unloading or that the market is shaking out and rotating holders. What is the difference
WAL-13.93%
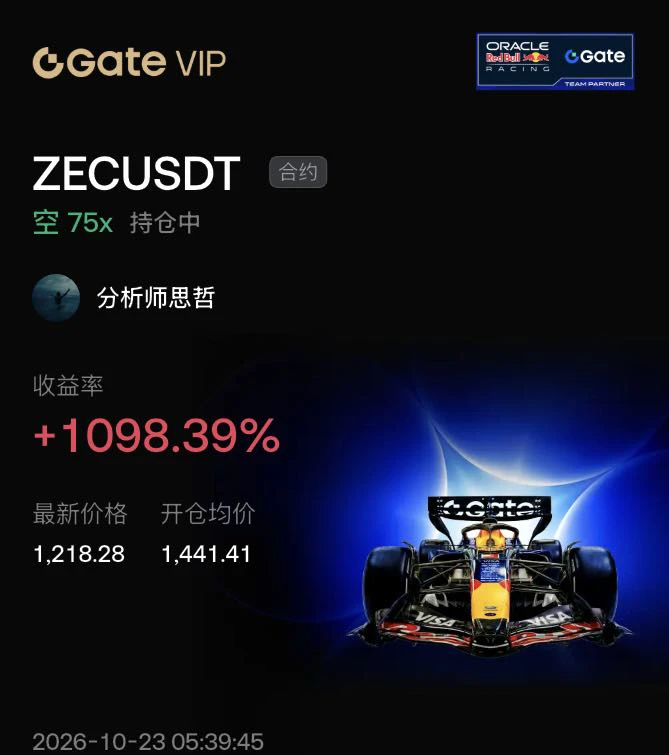
At midday, we remained firmly bearish across the board. BTC rebounded to the 81700 resistance level but met resistance, ETH rebounded to 2390 but came under pressure, and ZEC rebounded to around 1120 but also faced resistance. Short positions were opened simultaneously. BTC’s target was below 80000, ETH’s around 2320, and ZEC’s around 1070. As the U.S. stock market opened, the market moved lower as expected, with prices continuing to fall. BTC hit a low of 79818, ETH pulled back to around 2320, and ZEC dipped to 1075. BTC captured 1300 points of room, ETH secured 40 points, and ZEC secured 40
BTC+0.59%
ETH+1.40%
Everyone, $ICNT ’s price movement was exactly as I predicted, breaking through my 0.1270 take-profit target…‼️…I hope everyone can secure their profits and earn handsome returns…‼️
post-image
ICNT+20.42%
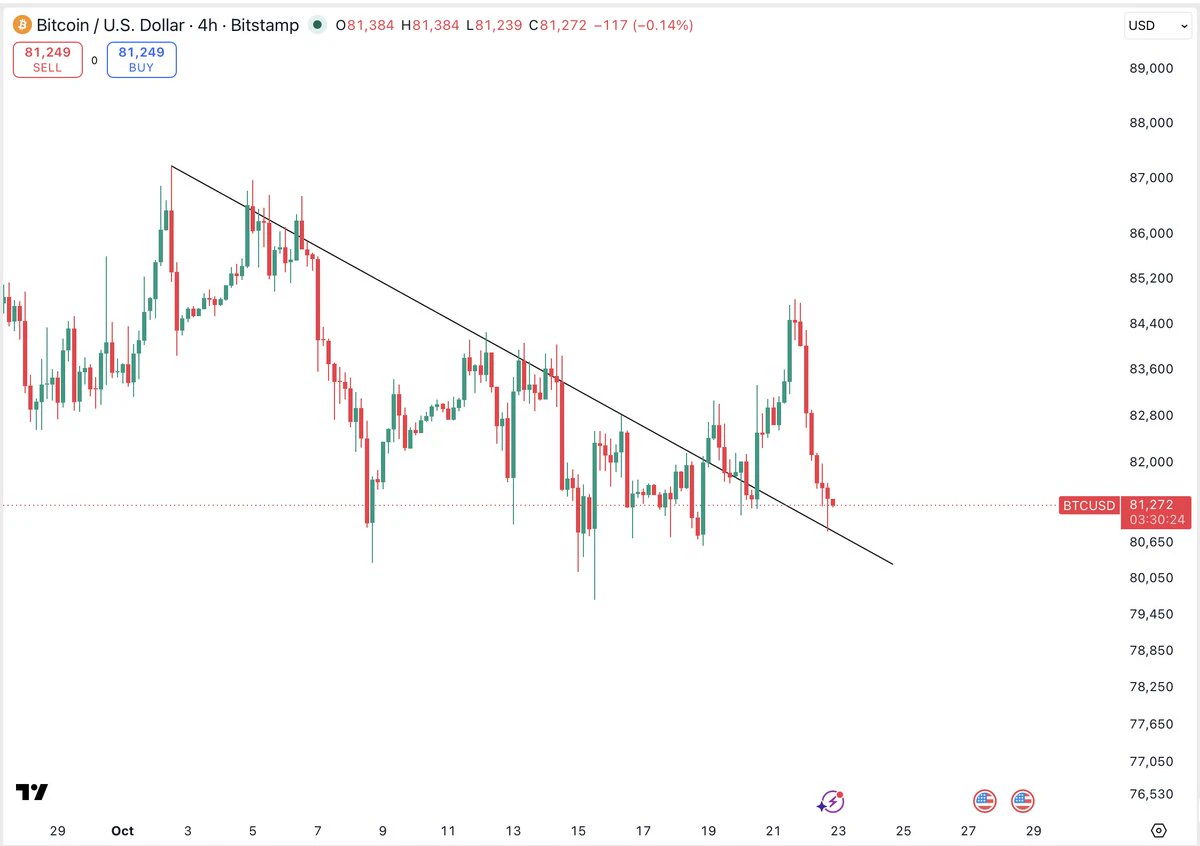
$BTC Don’t get baited into heavily chasing longs in this rally! The one-hour chart looks like a strong rebound, but it is actually just a corrective bounce after the sharp drop, not a trend reversal. Overhead trapped positions are weighing on the market, so any surge could pull back at any time.
ETH rebounded and rallied after hitting a low of 2314.27 one hour ago. The MA5 and MA10 turned upward, and the MACD formed a golden cross, indicating a corrective rebound after the sharp drop rather than a trend reversal. Overhead resistance from previous trapped positions remains.
Enter ETH long posit
BTC+0.60%
#晒出我的持仓收益#A group of friends huddling together for warmth—welcome, friend.
post-image
The second target has been reached at 0.03300. Keep your eyes on it and secure your profits. Congratulations! 🎉🤑💰👇$AKE
post-image
AKE+17.90%
Layout: Bitcoin, Ethereum, Dogecoin
live-cover
LIVE880
  • 4
While XRP has seen significant developments on the institutional front, its price has followed a more cautious trend. Despite approximately $1.8 billion in net inflows into XRP exchange-traded products (ETPs) over the past 13 weeks, the token’s price currently sits at $1.39—a decline of over 8% in the last week alone. This divergence raises a fundamental question that is now at the forefront of investors' minds.
The developments on the institutional side are noteworthy. Evernode—a company holding 473 million XRP and $300 million in cash—has begun trading on the Nasdaq under the ticker symbol X
post-image
XRP+1.33%
  • 5
  • 1
#GateWCTCS9全球交易赛
🔥 Gate WCTC S9 Global Trading Competition Is Coming!
The Gate WCTC S9 (World Crypto Trading Competition Season 9) offers a high-yield opportunity for traders across multiple asset classes. Maximizing your total prize allocation requires a strategic approach to trading weight multipliers, track selection, and team management.
8,000,000 USDT Prize Pool! The ultimate trading showdown across crypto, stocks, and CFDs officially kicks off on October 26!
Choose Your Battlefield:
Team Competition: Join forces and climb the leaderboard through your team's accumulated converted tradi
post-image
$UNI The most interesting thing right now is not guessing whether prices will rise or fall, but seeing who will be forced to change their stance first.
The bulls' test is at 7.634, while the bears' test is at 6.784. $UNI is currently at 7.416, up 4.32% in 24 hours. The 1-hour support is 6.784, resistance is 7.634, and current volume is 0.47 times the average volume of the past 20 or so candles.
I’ll first note that the $UNI price has already moved, but trading activity and volume have not caught up, because the direction can be trusted for now, while continuation cannot be assumed in advance;
post-image
UNI+4.71%
$ZEC short fighting a fresh bullish reversal.
Pair: $ZEC /USDT
Direction: SHORT
Entry: 1135.67
TP1: 1090.48 +4.0%
TP2: 1060.36 +6.6%
SL: 1195.92
- Steady decline from ~1280 through all three MAs, into a sharp final push down, now a strong green reversal candle
- RSI snapped from ~20s to ~55-58 one of the sharpest recoveries of the week
- MACD still negative overall, but the last bar just flipped green fresh cross, same timing as CRCL/ZEC-last-week
$ZEC ‌
ZEC+7.75%
Everyone watching SYMBOL long is about to get blindsided by a sharp drop.

$MU /USDT - SHORT

Trade Plan:
Entry: 927.98 – 934.84
SL: 964.38
TP1: 906.68
TP2: 890.19
TP3: 865.47

Why this setup?


Debate:
Are we testing TP2 or is 994.50 about to flip this setup?

⚠️ Personal market analysis only. NFA — manage risk and DYOR.
Educational content, not investment advice or a recommendation to buy, sell, deposit, or withdraw any asset. No paid promotion or referral/affiliate links.
MU+2.37%
If I could leave only one note for $KORUB today, it would be: don’t let -8.42% make the decision for you.
What is really worth discussing is that $KORUB moved first on the 1-hour chart, while the 4-hour chart still hasn’t acknowledged it. $KORUB is currently at 11.96, down -8.42% over 24 hours. The 1-hour support is 10.07, resistance is 12.99, and current volume is 0.18 times the average volume of the past 20 candles.
The 1-hour trend is relatively strong, with RSI at 79; the 4-hour trend is relatively weak, with RSI at 36. This combination makes me temporarily accept the following interpreta
post-image
🚨 LATEST: Stripe partners with Plasma to introduce multi-currency stablecoin cards, allowing users to spend in USD, EUR, BRL, MXN and COP.
The cards will support payments in local currencies without requiring users to first convert their funds into U.S. dollars.
Another major step toward global stablecoin adoption.
XPL+8.96%
$NEAR The most interesting thing right now is not guessing whether prices will rise or fall, but seeing who is forced to change their tune first.
The bulls’ test is at 5.44, while the bears’ test is at 4.527. $NEAR is currently at 5.392, up 11.96% in 24 hours. One-hour support is 4.527, resistance is 5.44, and current volume is 0.31 times the average volume of nearly 20 bars.
For now, I’ll note that $NEAR remains strong, while the crowded positioning is already out in the open. I acknowledge that the trend is strong, but what matters next is not how much higher it can surge, but whether anyone
post-image
🔹Whale Dumps BTC and Loads Up on ETH! After selling 237.8 BTC and buying 7,929 ETH, is big money be
live-cover
LIVE19
$MU
As you can see, after my bottom call at $104, it never fell below certain moving averages. Now it has pulled back right to them. It must hold this support line
post-image
MU+1.93%
$BTW BTW, this rebound is like an old lady climbing stairs, panting every three steps😅 The downtrend is visible to the naked eye; don’t get carried away shorting, and keep leverage low to stay alive. It’s darkest before dawn—don’t throw your back out on a rebound; staying cautious makes you the winner🤙
post-image
BTW-13.69%
Load More

Join 40 M users in our growing community

⚡️ Join 40 M users in the crypto craze discussion

💬 Engage with your favorite top creators

👍 See what interests you

Trending Topics

USSeptemberPPIBeatsExpectations

91.35k Views1.87k Discussing

US September PPI came in at 6.3% YoY, well above the 5.3% market expectation, pointing to renewed producer-side inflation pressure. Weekly jobless claims were 199K, broadly in line with forecasts. Could hotter inflation further reduce room for rate cuts, and what does it mean for $BTC, US stocks, and gold?

DrLinHanSpeaksAtOxfordUnion

135.63k Views1.86k Discussing

JapanAndKoreaStocksPlunge

47.27k Views1.76k Discussing

View More