Square
Following
Hot
News
Profile
Share your thoughts
placeholder
Article
Bitcoin Faces Fresh Selling Pressure
U.S. spot Bitcoin ETFs reportedly saw $635.5 million in daily outflows, the largest in four months.
Institutional withdrawals are adding uncertainty to the market. The key question now is whether $BTC can hold its support or face another leg down.
Watch price action before making a move. Volatility creates opportunities, but risk management comes first.
#BTC #Bitcoin #GateSquare #GateWCTCS9GlobalTradingCompetition
BTC-1.13%
  • 1
Even parking is such a headache.
If it were me, I’d sell the car immediately.
Trenches
Kimchi
K
bade
b
Kimchi
CSoc...pump
Market Cap
$.
Change
.
24h Vol
$.
Holders
.
kimchi
k
bade
b
kimchi
B1Y2...pump
Market Cap
$.
Change
.
24h Vol
$.
Holders
.
AGT
A
bade
b
AGT
0x5d...e274
Market Cap
$.
Change
.
24h Vol
$.
Holders
.
McRib
M
bade
b
McRib
8idE...pump
Market Cap
$.
Change
.
24h Vol
$.
Holders
.
ZIG
Z
bade
b
ZIG
0x8c...1145
Market Cap
$.
Change
.
24h Vol
$.
Holders
.
Breaking 🚨Brent crude prices surged above $115 per barrel, hitting a five-month high as supply threats intensified again 🚀. The surge came after Houthi attacks on Saudi Arabia’s Shaybah oil field, Dammam Airport, and Yanbu; the U.S. also ordered staff to evacuate 🌊. 18 tanker attacks in two weeks indicate that Iran’s targets have expanded from the Strait of Hormuz to the Gulf of Oman. LSEG warned that production and shipping routes are facing mounting pressure. Stay tuned for more 🔔$BM , $GTC , $AKE
post-image
BZ+2.22%
AKE+49.57%
BN AI game—free, just pay gas. 888 in total. Hurry!
post-image
Trade & Hold Daily, Unlock the $60,000 TSLAG Prize Pool https://www.gate.com/campaigns/6626?ref=VLARBF1YAG&ref_type=132
post-image
TSLAG+1.90%
madhemadX at its best ☕️🖤
post-image
US Bitcoin Spot ETF Outflows $635M Yesterday, Ethereum ETF Exits $110M
U.S. spot Bitcoin exchange-traded funds recorded approximately $635 million in net outflows on October 22, 2026, while Ethereum ETFs saw $110 million in outflows, according to data released on October 23. The massive outflows reflect a sharp risk-off sentiment in crypto markets, with Bitcoin falling 3.69% and Ethereum dropping 4.51%. BlackRock's IBIT, the largest Bitcoin ETF, fell 3.76%. The scale of the outflows is the largest since September, and it suggests that institutional investors are reducing their crypto exposure
post-image
BTC-3.69%
ETH-4.51%
$PI Financial transformation—a revolution spanning the globe while preserving compliance without compromise—takes time. This is basic logic: how could it possibly, possibly be accomplished all at once? Time is an essential requirement for achieving a great undertaking and a revolution! Patience, patience, patience: “Ten years honing a sword; its frosty edge has never been tested. Today I show it to you—who has been wronged”
post-image
PI+0.68%
  • 6
Why, as the US-Iran conflict escalates, has BTC instead fallen below $82k?
More than 90% of the positions liquidated in the past 24 hours were longs.
100k people, $441 million, wiped out in one sweep. Bitcoin plunged from $84.8k to $81k, its biggest drop in two weeks. Gold is falling too. Spot gold in London fell below $4,100, hitting an intraday low of $4,005.
By the old playbook, if the US and Iran are heading for war, you should buy gold and BTC. Instead, the two “safe-haven assets” are holding hands on the way down.
The US and Israel are drawing up plans to strike Iran after the midterm el
post-image
BTC-1.13%
ETH-1.48%
SOL-0.67%
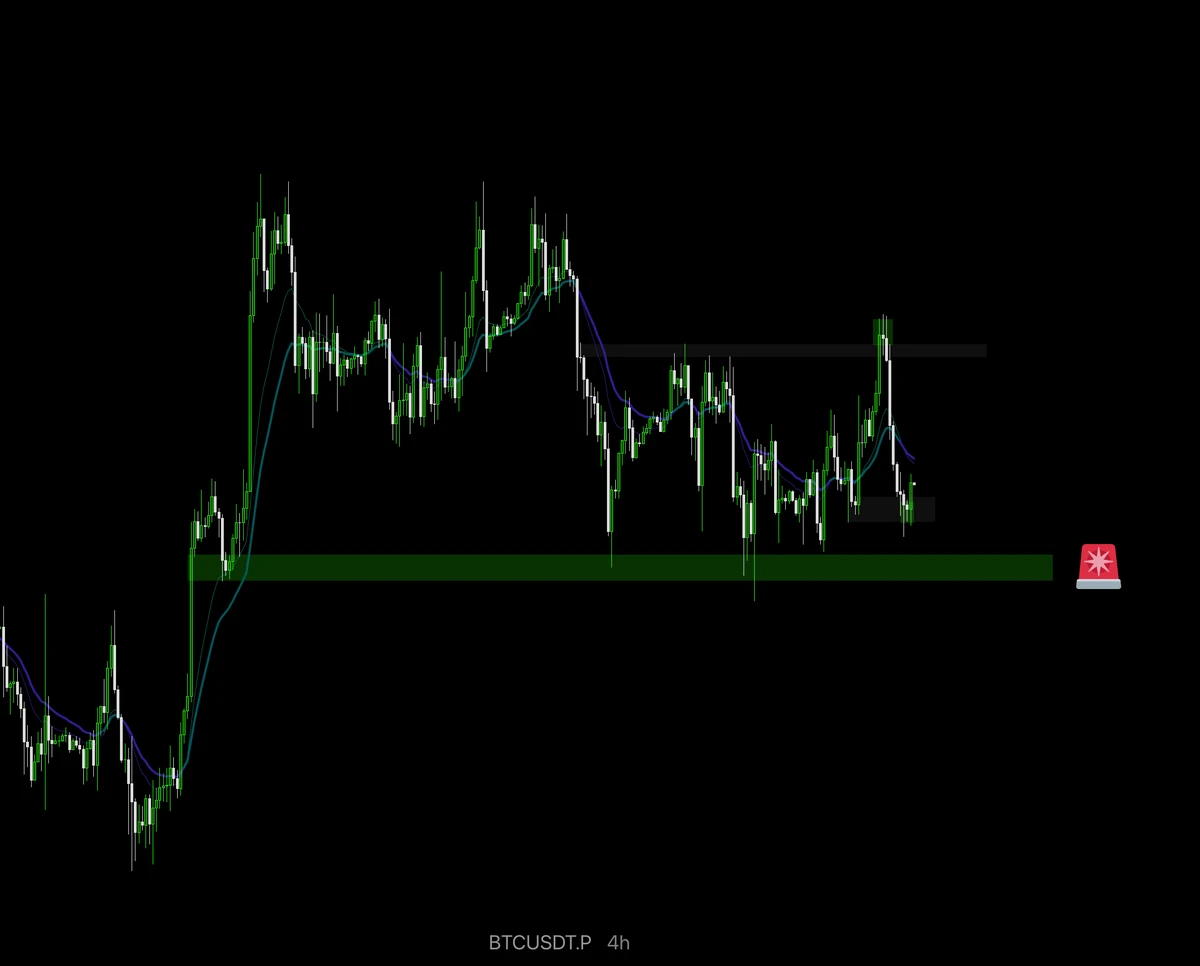
Bitcoin in Peril, Right Shoulder Completed Early? Storage Stocks Consolidating in a Triangle, Awaiting Direction.
Bitcoin’s daily chart is flashing warning signs. What would signal that the right shoulder has completed early and a decline is beginning? Sandisk’s inflection date is November 5-6; on the 4-hour chart, it’s time to watch for a potential bottoming pattern.
First, Bitcoin’s price has fallen below the moving averages on the daily chart. After yesterday’s bearish candle broke below the middle band, a move to test the upper band again in the short term looks unlikely. Key short-term re
BTC-1.13%
ETH-1.48%
SOL-0.67%
SNDK-8.45%
  • 1
GTA 6 Famous Girl $LUCIA Caminos will be more sensational than $GATO
Imagine We found 1000x coin at just $5k Mcap , lol , Send it
CA ; EbiNPjCJnP9vUvcy8mrCnYVjLjKXiNtxgNbPdZnxpump
post-image
Ackman Bets on U.S. Stocks in 2027! If War and Inflation Both Ease, Could the Next Major Bull Run Be
live-cover
LIVE2,160
#80,000 is the institutional cost basis line
According to reports from scouts on the ground
The average cost basis for US spot BTC ETFs and publicly listed companies' treasuries
is between 80,000 and 81,500
If the daily close falls below 80,000, institutions as a whole will be in unrealized losses
The next reference level is around 77,600
post-image
BTC-3.69%
After ARM's monitoring point 274.8 was reached, it returned to wealth growth. Now there's a new younger brother. Image 2 shares the wealth growth target. $ARM ‌
ARM-2.27%
🟢 $ATOM — Bulls Are Fighting Back! ⚡ A $18.648K short liquidation at $1.802 puts ATOM on watch for a possible squeeze. Support: $1.78–$1.80 | Resistance: $1.82–$1.85 | Target 🎯: $1.88–$1.92. Next Move: Holding support could invite buyers, while a rejection may trigger consolidation. Pro Tip: Watch volume and candle closes before chasing momentum.$SPCX ‌$JPN225 ‌
post-image
ATOM+3.76%
SPCX-9.10%
JPN225+0.37%
Thailand and Malaysia are urging their citizens not to travel to Europe, citing the severe protests there. People accustomed to easy money are highly sensitive to this kind of balance-sheet-tightening move—countries are all pushing risk beyond their borders and putting their own people first. Will this wave of travel warnings trigger a chain reaction? I haven’t figured that out yet either.
post-image
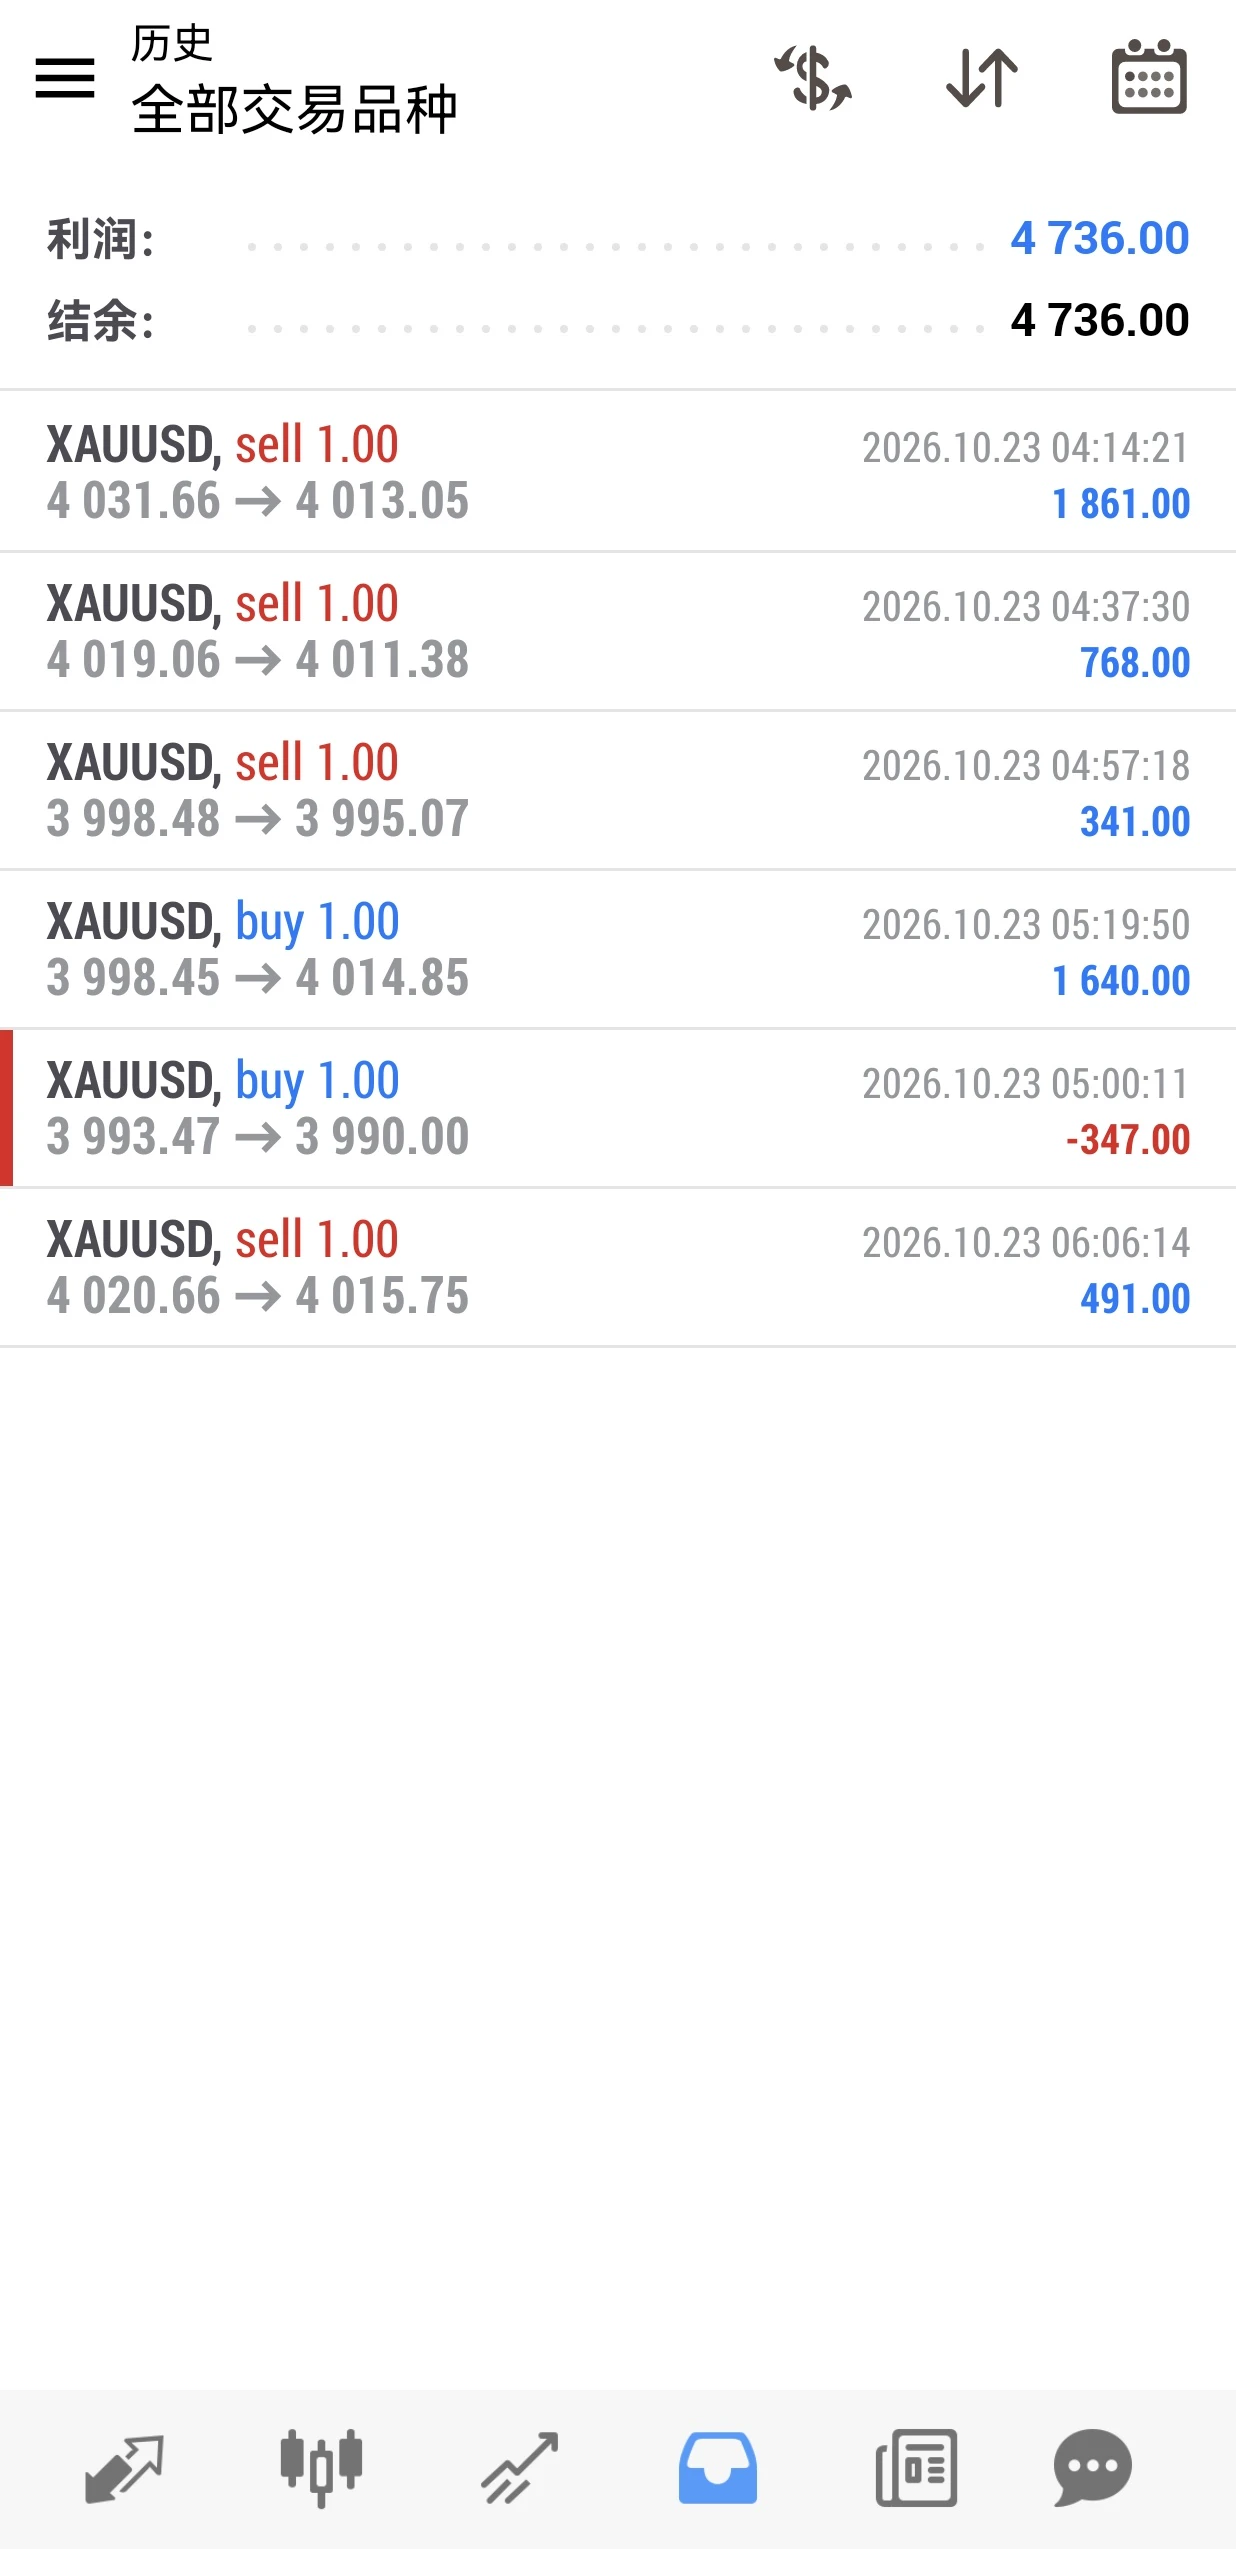
Morning long positions,
The situation is volatile today; only by understanding market conditions can you secure steady gains. $XAU ‌#黄金 #BTC跌破81000美元
post-image
XAU-1.80%
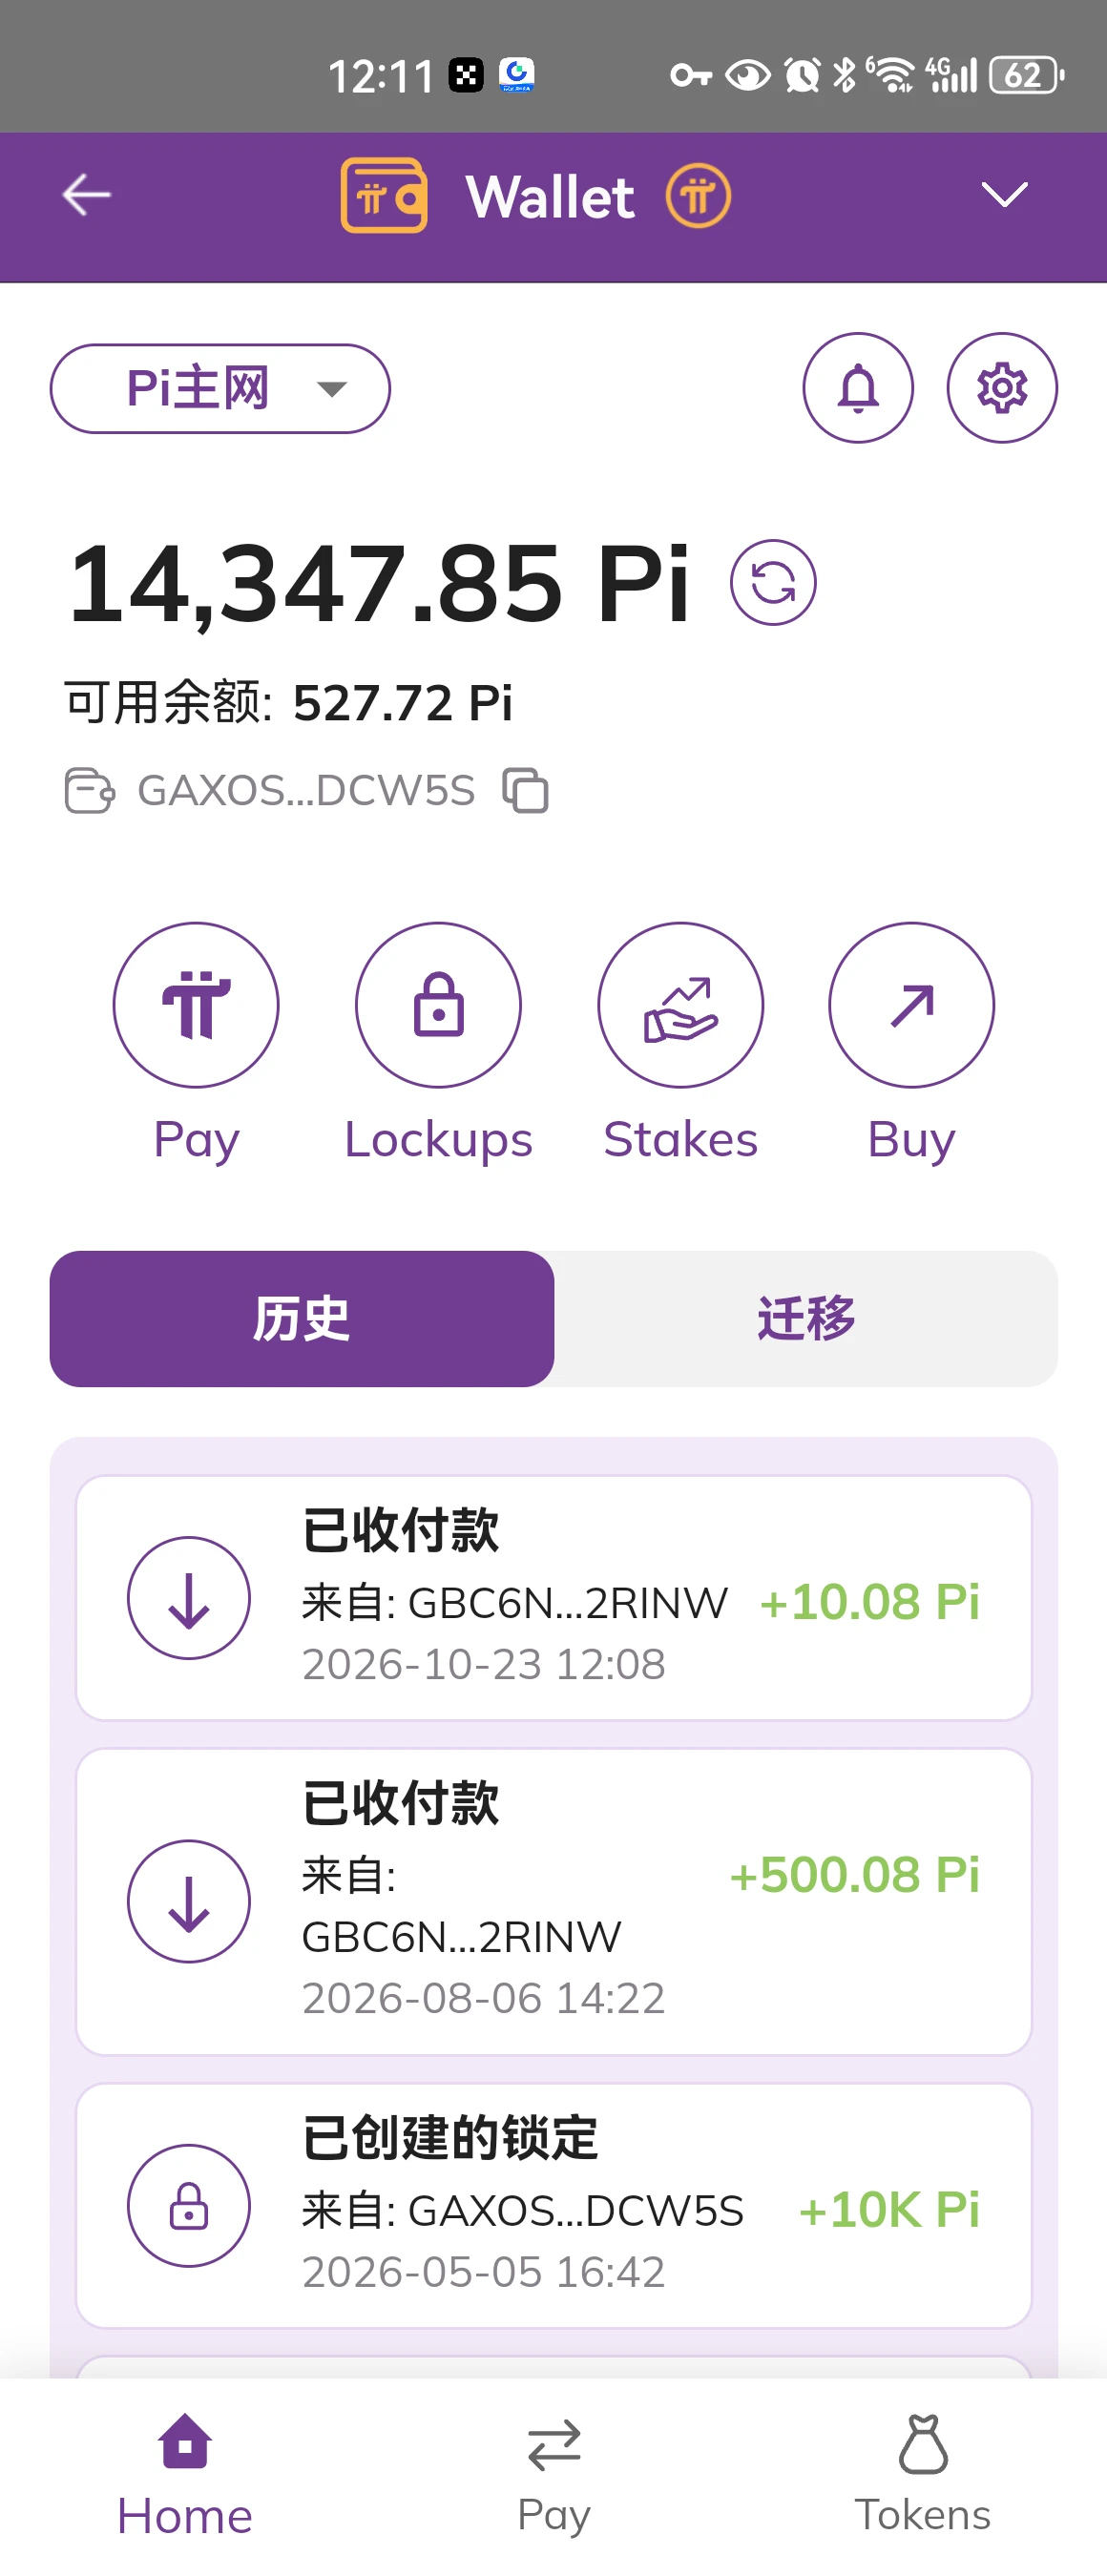
$PI The channel for withdrawing Pi from here to a wallet is working smoothly; don't believe the rumors—try it yourself and you'll see
post-image
PI+0.68%
  • 7
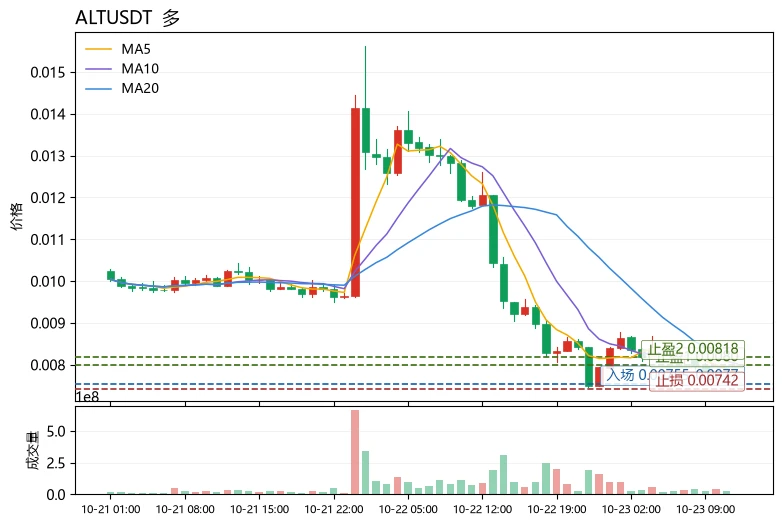
$ALT Current price 0.0077, down 36.73% in 24h, with a trading volume of 20.3M USDT; MA5=0.007798 has crossed below MA20=0.0081815, RSI=34.1 is nearing oversold territory, and the MACD histogram=+3.023e-05 is still bullish, while the lower Bollinger Band at 0.00746889 is right underfoot. The funding rate of -0.4902% indicates crowded shorts. This is an oversold rebound setup following a panic selloff, not a trend reversal, so the play is a rebound, not bottom-fishing.
Teaching point: To determine whether a trend is healthy, first look at the moving average alignment, then check whether RSI and
post-image
ALT-32.46%
XRP-1.41%
NEAR-1.52%
Load More

Join 40 M users in our growing community

⚡️ Join 40 M users in the crypto craze discussion

💬 Engage with your favorite top creators

👍 See what interests you

Trending Topics

USEarningsSeason

841 Views2.6k Discussing

The U.S. Q3 earnings season is in full swing, with major tech companies including Tesla and Meta reporting results. Market focus is shifting beyond revenue and profit toward AI spending, capital expenditure, margins and forward guidance. Which company’s earnings are you watching most closely?

GateWCTCS9GlobalTradingCompetition

385.63k Views7.55k Discussing

BTCDropsBelow81000

24.06k Views37.87k Discussing
View More