Share your thoughts
placeholder
Article
Better-Than-Expected Results, but the Real Test Lies in Cash Flow
Oracle’s latest earnings report can be summed up in one sentence: **Growth is surging, and so is cash burn.** Q1 revenue reached $19.345 billion, up 30% year over year; adjusted EPS was $1.92, versus market expectations of approximately $1.74, while cloud infrastructure revenue surged 121% year over year. The share price rose rapidly after hours, clearly indicating that investors approved of the results.
But focusing only on EPS can easily cause investors to overlook another issue—there is no free lunch in the AI era. To expand
ORCL-1.87%
  • 44
SUI is about to crash below 0.70 but nobody is talking about it.

$SUI /USDT - SHORT

Trade Plan:
Entry: 0.7239 – 0.7267
SL: 0.7386
TP1: 0.7153
TP2: 0.7087
TP3: 0.6987

Why this setup?
Why now? The daily trend is bearish and the 4h setup confirms a SHORT bias with 95% confidence. The 1h ATR of 0.005539 shows volatility is compressed enough for a sharp move, while the 15m RSI at 46.27 signals weakening momentum without yet being oversold. The entry zone sits between 0.7239 and 0.7267, targeting TP1 at 0.7153 and TP2 at 0.7087, with the daily price currently at 0.7253. The invalidation level
SUI+0.08%
70% of the position has already been realized above 0.11854, with this long trade's floating profit at +329.82% $MARSCOIN . I left a protective level on the remaining 30%, letting the profits run on their own—no rush to close everything.
When I entered, I was looking for a pullback that would hold above the previous low. The structure kept moving higher step by step, while volume did not expand with it—clearly not a sign of distribution. The long-short battle was fierce over those two days, but bids on the order book never stopped absorbing. The shakeout wicks only flushed out those chasing en
post-image
MARSCOIN+1.35%
ZEC-3.80%
DOGE+0.75%
$GRIFFAIN Signal】4H touches the upper Bollinger Band; go long on an 1H pullback
$GRIFFAIN The 4H current price of 0.015448 is pressing directly against the upper Bollinger Band at 0.0152. RSI at 76.15 is running hot, while the 1H RSI at 67.41 is retreating. Order book depth imbalance is -7.01%, with a Bid/Ask ratio of 0.87 and sell orders stacked at the highs. The 4H MACD histogram at 0.0005 continues to expand, while the 1H histogram has contracted to 0.0001, indicating slowing short-term momentum. The 1H EMA20 at 0.0143 and EMA50 at 0.0129 provide support below. The risk-reward ratio at thi
GRIFFAIN+47.49%
BTC+0.17%
ETH+0.42%
SOL-0.54%
RWA Perpetuals Are Becoming the New Battleground
In the past, when people talked about RWA, their first reaction was often “putting assets on-chain”; but the market is now entering its next phase—not only bringing real-world assets on-chain, but also giving them genuine tradability. CoinDesk data shows that CEX RWA perpetual trading volume reached $602 billion in August 2026, setting another all-time high. Gate recorded $64.7 billion in monthly trading volume, up 158% month-on-month, while its market share expanded from 5.32% to 12.6%, rising to third globally.
These figures show that RWA has
  • 42
I just switched the app to the background, and it popped right back up. Is it playing hide-and-seek with me?
When the market was dumping in the early session, I opened a short. Before my hand had even left the screen, the price suddenly plunged with a wick, scaring me so badly I almost closed the position. But then I took another look: volume hadn’t followed, and the spike was purely a bull trap. No one was buying the rebound, so I decided to hold on a little longer. It wilted within minutes, and $XAU slid all the way from 4510.00 to 4357.86, turning the floating profit into +313.58%. That fa
post-image
XAU+0.02%
BTC+0.15%
SOL-0.56%
$MU /USDT just printed a daily range while the 1h RSI screamed oversold.

$MU /USDT - LONG

Trade Plan:
Entry: 966.71 – 968.23
SL: 957.94
TP1: 974.62
TP2: 979.38
TP3: 986.53

Why this setup?
Why now? The daily trend is range-bound, which means a breakout is overdue and the 1h RSI at 28.96 shows the asset is deeply oversold on the shorter timeframe. The 1h ATR of 3.054315 confirms that even a modest move from the entry zone of 967.47 will produce a significant candle, giving us a clean setup for a long. We are targeting TP1 at 974.62 and TP2 at 979.38, with the invalidation level at 986.83 s
MU-0.78%
Nobody is talking about the quiet short setup forming inside ONDO right now.

$ONDO /USDT - SHORT

Trade Plan:
Entry: 0.3475 – 0.3489
SL: 0.3548
TP1: 0.3432
TP2: 0.3400
TP3: 0.3350

Why this setup?
Why now? The 4h trend shows ONDO stuck in a daily range, which often precedes a sharp directional move once momentum breaks. The 1h ATR of 0.00275 confirms volatility is still alive but compressed, setting the stage for a squeeze. The 15m RSI at 42.98 signals weakening bullish momentum without yet being oversold, giving short sellers room to push price down. Entry precision matters here because t
ONDO-0.03%
$WEMIX Kaiying holds a 49% stake.
post-image
WEMIX+0.21%
Crypto Market Pulls
live-cover
LIVE15
In the next few months, some Altcoins could hit 100x 💥🚀
#ALTSEASON
post-image
Crypto Market Pulls Back Slightly
live-cover
LIVE18
$FLOCK Signal】Long + 1H pullback order-book support
$FLOCK After touching a high of 0.08619 on 1H, the price pulled back and is currently at 0.0783, sitting at the upper boundary of the entry zone. The 4H MACD histogram at 0.0019 continues to expand, while the 1H histogram at 0.0015 is contracting. RSI: 70.85 on 4H / 67.74 on 1H; order-book bid/ask depth ratio: 1.48; depth imbalance: 19.44%.
🎯 Direction: Long
⚡ Entry/limit order: 0.078065 - 0.078300
🛑 Stop-loss: 0.077517
🚀 Target 1: 0.079475
🚀 Target 2: 0.080062
🛡️Trade management:
- Execution strategy: Reduce the position by 50% upon
post-image
FLOCK+25.52%
BTC+0.17%
ETH+0.42%
SOL-0.54%
I only hit refresh, and it shot up as if I had startled it. When I opened the chart this morning, the key level for $SKHYNIX had held, it was consolidating at the bottom, and funds were quietly entering. I flagged a long position at 1171.00.
Managing risk in advance is called rationality; cutting losses only after losing is called making a brave sacrifice. The premise of compounding is staying alive, while the shortcut to getting rich overnight is often going to zero.
Now at 1337.08, +1004.81%—this feels really great. I caught the rhythm, and this profit feels good.
Take 80% profit first, prot
post-image
SKHYNIX-2.24%
SNDK-0.41%
ETH+0.40%
Is this time different? @machibigbrother
But ultimately, it was still prejudice.
post-image
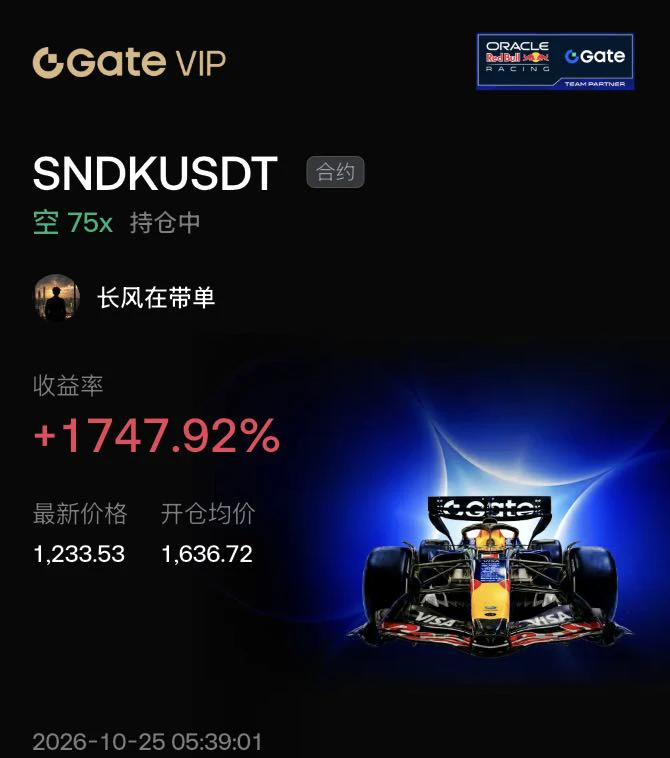
$GPS Most of this short position has already paid off. The reason I entered was simple: the rebound stalled near the Bollinger Band middle line, resistance weakened at key levels, and those key levels were also moving lower. I didn’t chase after seeing the drop; I waited for the structure to weaken before acting. There was no volume on the earlier push upward, so I waited for it to weaken on its own.

There were several wicks in between that took out quite a few short-term stop-losses, but my protection level was not hit. After the +323.38% unrealized profit emerged, I managed the position in
post-image
GPS-16.10%
ETH+0.40%
SNDK-0.41%
$ETH $BTC 9.13 Morning (Bitcoin, Ethereum) Market Outlook
Overall market movement over the weekend has been very limited, and the market remains weak. Prices have consistently failed to break above the 77300‑77800 resistance zone, so the short-term strategy remains to set up short positions around this resistance zone. On the one-hour chart, after a sharp spike and retreat on Friday night, the market entered a narrow range of consolidation. The hourly Bollinger Bands continue to contract, with the range of volatility narrowing constantly, while prices have remained below the middle band for an
post-image
ETH+0.42%
BTC+0.17%
CPI Has Not Gone Out of Control, but the Rate-Cut Story Needs to Hit the Brakes First
U.S. August CPI rose 0.4% month-on-month and 3.4% year-on-year, broadly in line with expectations, but core CPI rose 0.3% month-on-month, above the market’s previous expectation of 0.2%. This means inflation has not spiraled out of control again, but it is still far from falling to a level that would reassure the Federal Reserve. After the data was released, market pricing for a September rate hike heated up significantly, with some market probabilities briefly exceeding 80%.
Therefore, the biggest impact of
GLDX-0.04%
PAXG0.00%
XAU+0.02%
BTC+0.17%
  • 3
Rising Rate-Hike Expectations Could Instead Create the Next Buying Opportunity
The biggest market significance of this round of U.S. August CPI data is that it has brought “the Federal Reserve hiking rates again” from a low-probability event into the spotlight. Data showed that headline CPI rose 3.4% year on year and core CPI rose 2.4%, while the market’s probability of a September rate hike increased notably after the data was released.
In the short term, this is certainly not the scenario risk assets prefer. Higher interest rates raise funding costs, while a stronger dollar and higher U.S. T
BTC+0.17%
GLDX-0.04%
PAXG0.00%
  • 16
This $BR short position has already been taken off the table in batches. The key was not catching a crucial level, but that the rebound never cleared the previous high. After the false breakout, volume failed to follow through and order-book support also thinned, so I tried a short as the rebound reached the key resistance zone instead of chasing after a breakdown.
There was a pullback while I held the position, but it did not reach my protection level, so I did not make any rash moves. It later came under pressure again, and the +316.79% unrealized profit gave me the confidence to handle it
post-image
BR-2.74%
BTC+0.15%
XRP+0.72%
Load More

Join 40 M users in our growing community

⚡️ Join 40 M users in the crypto craze discussion

💬 Engage with your favorite top creators

👍 See what interests you