Share your thoughts
placeholder
Article
This isn’t a rebound—it’s a tube inserted into an account that was about to snap. After $SKHYNIX dumped hard in the early session, I actually perked up as buy-side bids strengthened.
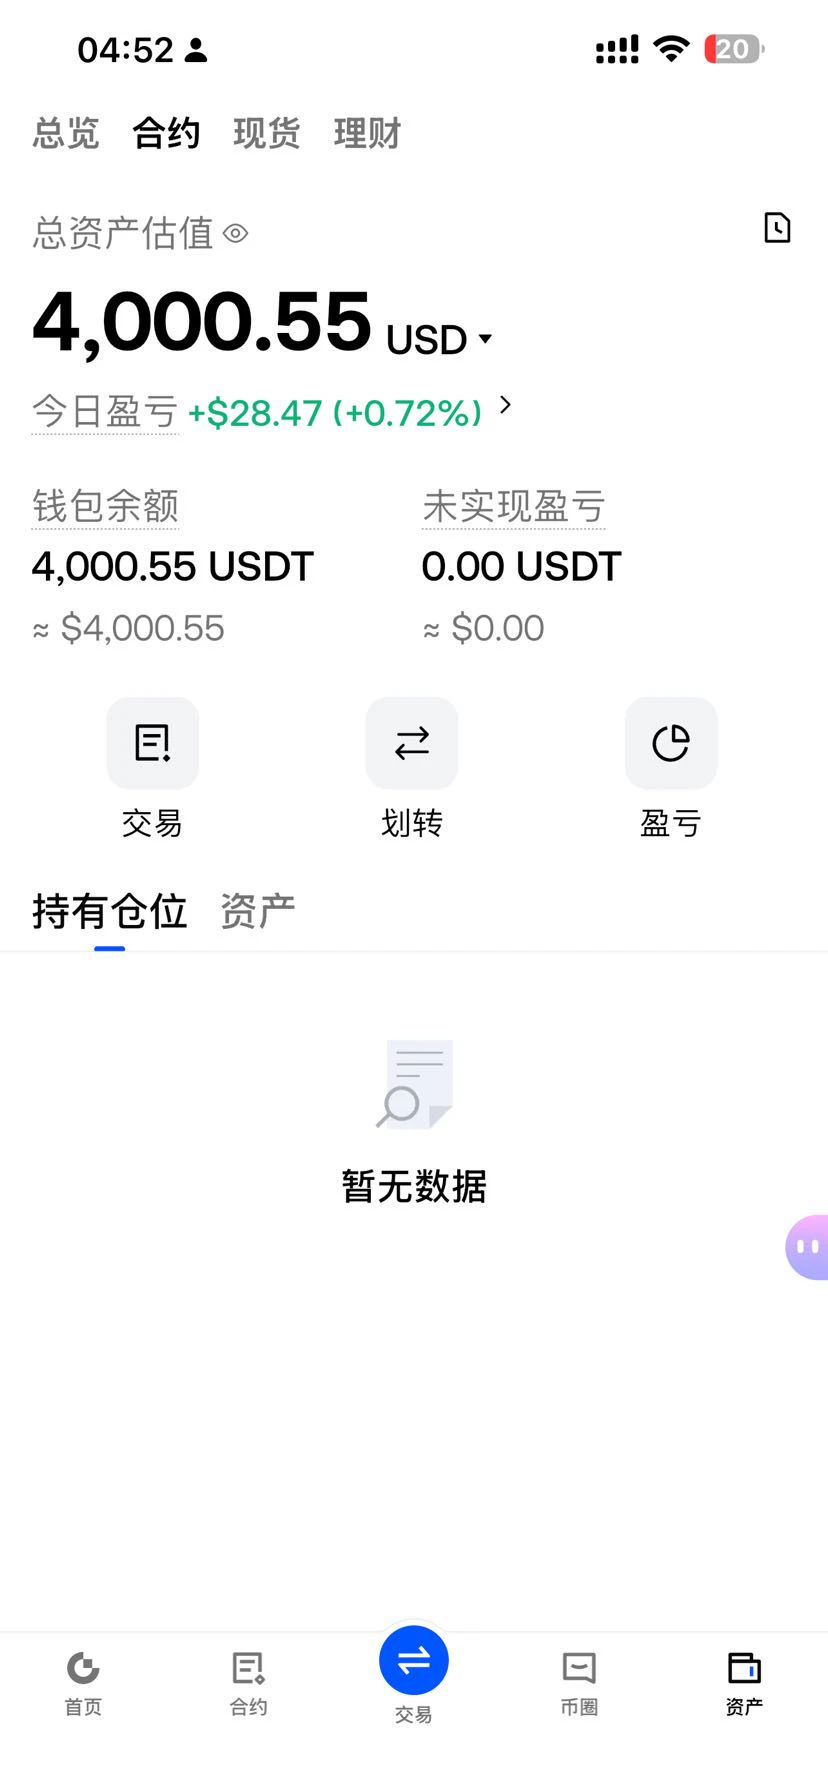
It didn’t follow the drop, and the support was strong enough—the opportunity was unmistakable. I entered the long at 1171.00, and with the price now at 1358.76, I’ve captured a +1139.42% return. It feels great when you get the timing right.
I took 80% off the table first, and raised the stop-loss on the remaining 20% to the entry price. Only realized profits count as money; no matter how large the unrealized gains
post-image
SKHYNIX+2.63%
BTC-0.63%
ZEC+4.51%
I’m joining the Mooniez from the dark side of the moon. @MooniezHQ
Everyone is missing the obvious bearish setup forming in SYSKYAI right now.

$SKYAI /USDT - SHORT

Trade Plan:
Entry: 0.05588 – 0.05646
SL: 0.05894
TP1: 0.05409
TP2: 0.05271
TP3: 0.05064

Why this setup?
Why now? The daily trend is bearish and the 4h structure is confirming a breakdown, which aligns with the 1h ATR of 0.001153 to show volatility is compressing before a decisive move. The 15m RSI at 58.46 is still neutral, meaning the pullback has room to run before overbought exhaustion. The entry zone between 0.05588 and 0.05646 gives a precise reference of 0.05617 for a short bias, with T
SKYAI+0.20%
This was purely the market being in a good mood and casually tossing out some gold coins, which just happened to hit me on the head. When the screen was all green, everyone else was panicking, but what I saw was a low-volume rebound with no buyers higher up—a classic bull-trap structure. When the dump first hit during the early session, selling pressure was absurdly strong, and every rebound looked like handing a knife to the bears. I said it then: even if this kind of rebound went higher, it would be futile, so I went straight short at the entry price of 4641.00.

The long wait was worth it—
post-image
ZEC+4.51%
SNDK-1.49%
I wasn’t watching the charts or thinking about it—it was moving on its own, like it was working overtime for me. A few days ago, I saw it hovering around 0.4789 before bed, moving sideways for a day and forming a bottom without breaking support. It was clearly accumulating. I casually opened a long and put on a small position, not expecting it to take off immediately.

When I opened the chart in the morning, it was at 0.5996, +1791.08%. That was a satisfying bite of profit. It was truly sluggish at first, but the result was truly delicious.

Putting risk controls in place beforehand is calle
post-image
DOGE-0.50%
ZEC+4.51%
$SPCX /USDT is about to break a range that has held for weeks.

$SPCX /USDT - SHORT

Trade Plan:
Entry: 152.60 – 153.24
SL: 156.02
TP1: 150.59
TP2: 149.04
TP3: 146.71

Why this setup?
Why now? The 1h price sits at 152.92, the exact entry_ref, while the 1d trend remains range-bound and the 15m RSI reads 55.27, showing neither overbought nor oversold exhaustion. The 1h ATR of 1.293659 signals enough volatility to push the trade from the entry zone between 152.60 and 153.24 toward TP1 at 150.59 and then TP2 at 149.04. With confidence at 55.4%, the setup is a measured short, not a moonshot, and
SPCX+1.92%
September 9 Jinman Gold Morning Review:
Spot gold continued to trade weakly in the morning session, currently fluctuating within a narrow range around 4352. Overnight, gold prices fell all the way, directly breaking below the 4400 round-number level and reaching a low of 4352.48, refreshing the recent low, with the overall market fully dominated by bears.
The hourly chart shows consecutive bearish declines, with weak rebounds and a clear short-term downtrend; the 4-hour chart is likewise in a choppy downward channel. After the large bearish candle broke down, the overall bearish pattern remain
post-image
BTC-0.70%
ETH-0.03%
This was purely because the market was in a good mood and casually tossed out some gold coins, which happened to land right on my head. 🪙

Right after lunch, when I checked the chart, $OP surged again, but got pushed back just short of the breakout level. Each rebound has been weaker than the last, with layers of sell orders stacked above. I can’t see any reason for a reversal in this setup. The short-term direction is simple: short.

I entered short at 0.11747, didn’t have to wait long, and the price has already worn down to 0.10542, with floating gains of +494.82%. The pace earlier was a
post-image
OP-3.75%
XRP+1.83%
ETH+0.05%
The early bird catches the worm.
live-cover
LIVE19
if you see some shit like this in a project you are in, you know they're real bag workers
follow them with haste.
Nobody is talking about $HYPE /USDT breaking above 86.805 tonight.

$HYPE /USDT - LONG

Trade Plan:
Entry: 84.304 – 84.688
SL: 82.649
TP1: 85.881
TP2: 86.805
TP3: 88.190

Why this setup?
Why now? The 4h setup and the daily trend both confirm a bullish bias with 95 percent confidence, making this a high-conviction LONG. The 1h ATR of 0.769507 shows the market is moving fast enough to hit targets quickly once momentum starts. The 15m RSI at 54.18 means price is neither overbought nor oversold, leaving room to run before exhaustion. The entry zone between 84.304 and 84.688 offers a tight risk
HYPE-0.32%
Stock Product Lineup · New Member — Event Contracts 🚀
Four stock underlyings now live with 5-min / 15-min bull & bear trading:
🇺🇸 US Stocks: MU, SNDK (pre-market / intraday / after-hours) 🇰🇷 Korean Stock: SKHYNIX 🇨🇳 A-Share: Unitree Robotics
No leverage. No margin. Just predict short-term price direction: ✅ Lower barrier to entry — direction-only trading ✅ Choose Bullish or Bearish; auto-settlement at expiry ✅ Early close supported, with take-profit & stop-loss
Crypto Event Contracts also available: BTC, ETH, SOL, XRP, DOGE, HYPE, BNB
How to trade: Gate App (v8.36.0+) or website → [Futu
Gate_Square
Stock Product Lineup · New Member — Event Contracts 🚀
Four stock underlyings now live with 5-min / 15-min bull & bear trading:
🇺🇸 US Stocks: MU, SNDK (pre-market / intraday / after-hours) 🇰🇷 Korean Stock: SKHYNIX 🇨🇳 A-Share: Unitree Robotics
No leverage. No margin. Just predict short-term price direction: ✅ Lower barrier to entry — direction-only trading ✅ Choose Bullish or Bearish; auto-settlement at expiry ✅ Early close supported, with take-profit & stop-loss
Crypto Event Contracts also available: BTC, ETH, SOL, XRP, DOGE, HYPE, BNB
How to trade: Gate App (v8.36.0+) or website → [Futures] → [Event Contracts] → filter [Stocks]
Start on Web now 👉 【https://www.gate.com/zh/trade-events/us-mu-updown-5m?eventId=e16176&outcome=Up】
⚠️ Derivatives trading carries high risk. Please read the product rules carefully before trading.
#Gate #EventContracts #StockEventContracts #MU #SNDK
repost-content-media
MU-1.47%
SNDK-0.11%
SKHYNIX+2.63%
UNITREE-2.46%
BTC-0.63%
I wasn’t watching the charts or using my brain; it was jumping around on its own, like it was working overtime for me. I didn’t dare look during the intraday plunge, but felt relieved after the drop. Then when I checked again a while later, $MAGMA ’s 0.23771 was actually higher than my entry price. I really don’t know who to complain to.

The logic was simple at the time: it was forming a bottom without breaking down. I mentioned around 0.17163 that we could accumulate in batches at low levels and wait for a recovery. The unrealized gain is now +761.86%. Not an outrageous return, but at least
post-image
MAGMA-3.23%
SOL-0.22%
XRP+1.83%
The screen awash in green looks like panic to many people, but to me it’s just an after-show for my short positions. When the early-session sell-off first began, $HNT ’s intraday rebounds kept getting weaker, and both consecutive pushes higher lacked volume. With the key level above clearly visible, I shorted it directly at 0.6474. Now 0.5545 is no longer the opening price, and +412.16% in unrealized profit is sitting in the account. It feels great.

The inability to rise is the biggest bearish signal. When the bait to go long isn’t strong, I can’t even be bothered to act.

First lock in +41
post-image
HNT+3.94%
ETH+0.05%
BNB+1.92%
Originally, I was going to close the position and call it a day, but it turned around on its own and handed the profits back. During the intraday plunge, the rebound was weak, and every push higher fell just short. Looking at the chart, I had only one thought: the bull trap was obvious—don't take the bait. The high-level short I flagged a few afternoons ago was opened at 0.33936 and is now at 0.12588, with +1238.62% unrealized profit sitting there. It was truly sluggish at first, but the move that followed was truly satisfying. In terms of execution, take 80% off the table first, protect the r
post-image
BNB+1.92%
ADA+0.41%
Everyone calling LAB a bottom is about to get proven wrong by the data.

$LAB /USDT - SHORT

Trade Plan:
Entry: 0.0682 – 0.0686
SL: 0.0706
TP1: 0.0667
TP2: 0.0656
TP3: 0.0639

Why this setup?
Why now? The daily trend is bearish and the 1h RSI at 42.65 confirms weakening momentum without yet being oversold, meaning sellers are still in control. The 1h ATR of 0.000934 shows volatile but manageable swings that keep the entry zone of 0.0682 to 0.0686 live for a short trigger. The 1h price sitting at 0.0684 aligns perfectly with the entry reference, giving a clean setup to target TP1 at 0.0667 a
LAB-1.47%
Collateralize and borrow like this, then put it on-chain. It shouldn’t be a problem, right? If CFX goes up, just pay it back; if it drops, keep earning coins on-chain.🐮🐮🐮
CFX+0.46%
I was just about to go to the forum and start cursing, but one look at my balance completely doused my anger. The market is always right.

When I checked the charts after lunch, $MAGMA /MAGMA had pulled back to near a key level, but volume never followed through. It looked like it was rising, but every step was shaky, with the smell of a bull trap getting too strong.

I decided to follow the bears and take a position, entering at 0.53245. The logic was simple: someone sells off every time it pushes up, so it was only a matter of time before it got dumped back to the starting point.

Looking
post-image
MAGMA-3.23%
ADA+0.41%
LAB-1.47%
Everyone is missing the real move happening right now in SYMBOL.

$SUI /USDT - SHORT

Trade Plan:
Entry: 0.804 – 0.812
SL: 0.843
TP1: 0.782
TP2: 0.765
TP3: 0.739

Why this setup?
Why now? The daily trend is range-bound, but the 1h ATR of 0.014439 signals a breakout is imminent. The 15m RSI at 45.45 shows weakening momentum, while the 1h price of 0.808 sits at the entry zone of 0.804 to 0.812. This setup targets TP1 at 0.782 and TP2 at 0.765, with the invalidation level of 0.797 acting as the hard stop for the trade.

Debate:
Are we testing TP2 or getting trapped at the invalidation level?
SUI-0.39%
Load More

Join 40 M users in our growing community

⚡️ Join 40 M users in the crypto craze discussion

💬 Engage with your favorite top creators

👍 See what interests you