Share your thoughts
placeholder
Article
I wasn't even expecting to break even, but it actually pushed me into profit. This service is seriously on point. $BE While everyone was still waiting on the sidelines, I kept my eye on that range that was repeatedly oscillating intraday. The more it churned, the more I felt something was brewing.

Buying pressure was quietly building, with buyers stepping in every time it dipped. With a bottoming structure like this, I had to give it a shot. I opened a long at 200.9. The holding process wasn't exactly smooth, but as long as the trend remained intact, I held on.

Now that 267.7 has been reac
post-image
BE+13.93%
SOL-2.35%
SNDK+11.75%
This move is so obvious I don’t even need to think—the account is dancing on its own. During the intraday plunge, $ACE kept falling just short every time it tried to push higher, with a weak rebound and insufficient buying support. I warned against rushing to catch a falling knife and went short instead, entering at 0.1903. Looking at it now, the current price is 0.1722, with a return of +234.52%—the timing was spot-on.

No vision, can’t hold—these profits are paper-thin, but I love it. I’ve taken 80% profit first, putting the bulk in my pocket, and moved the stop-loss on the remaining 20% t
post-image
ACE-6.23%
SOL-2.35%
ZEC+7.78%
I didn't do anything—just went to the bathroom, and when I came back, the candlestick chart had already done the work for me. 🙂
While the market was bottoming intraday, funds quietly entered. Volume wasn't large, but buying strengthened—a classic accumulation pattern. While everyone else was still waiting, I gave the direction outright.
This move $INTC went straight from 90.88 to 95.83, securing +386.75%. It was truly sluggish at first, but the breakout feels great; those already on board should be grinning in their sleep.
As for the trade: take 80% off the table first, and set the remaining
post-image
INTC+4.81%
SNDK+11.75%
ETH-1.97%
Everyone’s staring at the 15m RSI (70.94) while SLX silently prints lower highs on the 4h.

$SLX /USDT - SHORT

Trade Plan:
Entry: 0.07002 – 0.07044
SL: 0.07228
TP1: 0.06869
TP2: 0.06767
TP3: 0.06613

Why this setup?
Why now? The 1D range isn’t your friend—it’s a trap door.
- 4h bias is SHORT (55% conf), but the real tell is the EMA cluster at 0.07023.
- Price is pinned at entry_ref, with TP1 at 0.06869 (a 2.2% drop) and TP2 at 0.06767 (3.6%).
- ATR (0.000855) says volatility is compressed—breakouts get violent.
- The 15m RSI is overheated, but that’s noise. The 4h structure is what
SLX+1.56%
Just when I thought this move was completely dead, I actually perked up. When the early-session sell-off first hit, $MET ’s rebound was painfully weak, with no volume behind it and no buyers up there—isn’t that just handing me free points? I went straight in short at 0.1989. I was wondering whether I’d get worn down, but the wait paid off. It’s at 0.1837 now, +365.6%, and that feels damn good—the people on board must have woken up laughing.
Patience brings the right market opportunities, and profits come from holding your position.
Close 70% first and put the bulk in your pocket. Move the stop-
post-image
MET-7.37%
SOL-2.35%
BNB-0.70%
$AKE : Hold this coin forever. It could do 1,000x in the bull market. I’ve already gone in heavily, so I don’t care—let it fall as much as it wants. It’s already up 20x now, so it doesn’t matter.
AKE-14.79%
$VELVET 24-hour dump of 19.53%, falling from 0.0957 to 0.0725. It is now at 0.0754, looking like a dead-cat bounce. The 25.3M trading volume shows the panic selling is far from over—this is not buying the dip, it is catching a falling knife.
Let me tell you a harsh truth: what you think is a “bounce after a crash” is most likely a “continuation of the downtrend” in crypto. It’s like the bubble tea shop downstairs offering 50% off the second cup—you think you’re getting a bargain, but you end up with explosive diarrhea—a cheap deal is rarely a good deal.
I’ve been watching VELVET for three days
VELVET-19.06%
BTC-1.86%
Everyone’s watching silver’s fake breakout—but the 4H tape just whispered a trap.

$XAG /USDT - SHORT

Trade Plan:
Entry: 66.15 – 66.37
SL: 67.34
TP1: 65.45
TP2: 64.91
TP3: 64.10

Why this setup?
Why now? $XAG /USDT sits at 66.26 with a SHORT bias (55% confidence), yet the 1D is rangebound, not trending. RSI on the 15m is only 53—no momentum behind the push. ATR (0.45) says volatility is thin, so the 66.15–66.37 zone is a magnet for stop hunts. If price rejects here, TP1 at 65.45 is the first domino; TP2 at 64.91 is the real prize. But the alt map (TP1 at 67.07) shows bulls are armed—so thi
XAG-1.13%
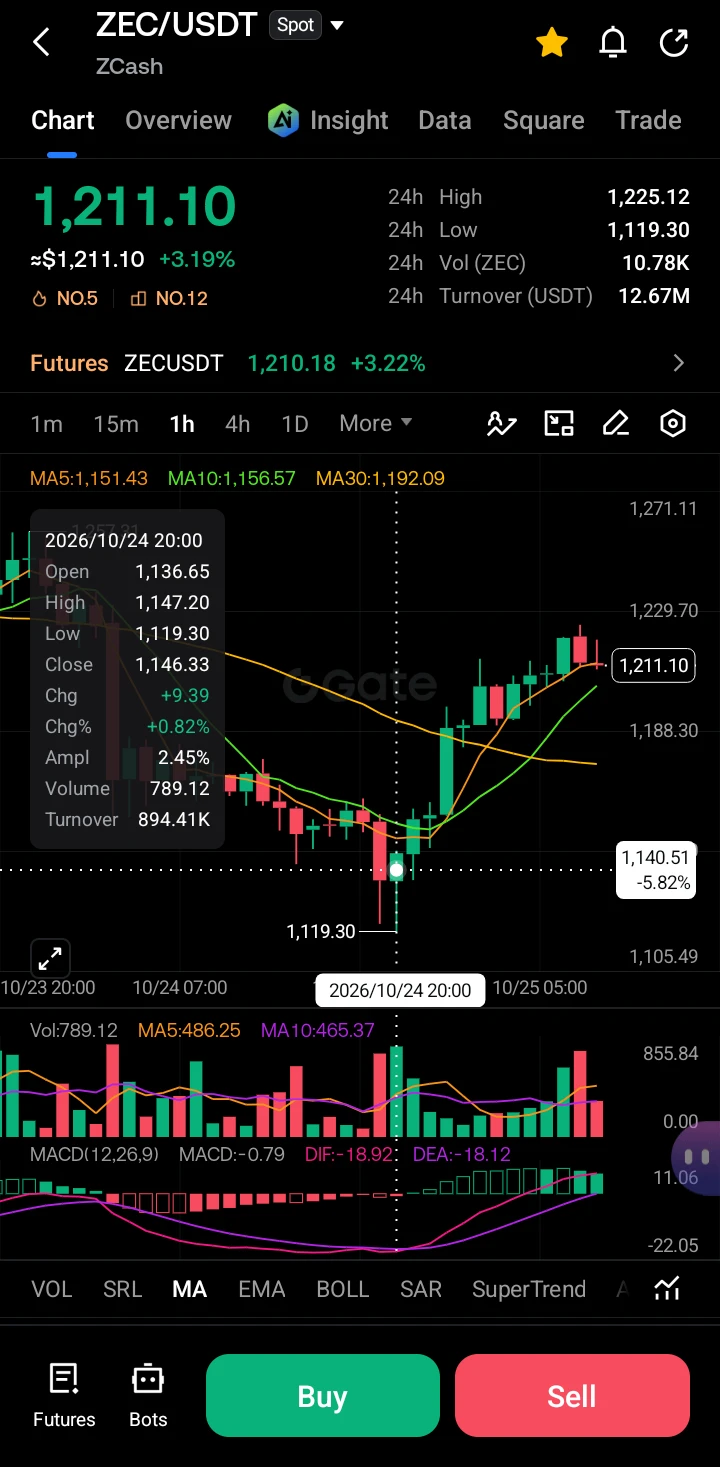
$ZEC The king of altcoins can bet his entire fortune
ZEC+7.96%
Play with the lucky ones.
If you make money, everything you say is right.
Stay away from contrarians; they either question everything or complain.
Some people are clearly making money, yet they seem to be in more pain than those who are losing money. How are you supposed to get rich?
A profitable trade is a successful trade even if it only makes 10U. If you treat every 10U you earn as 100,000U, you will soon make 1,000,000U. Opportunities favor those who are prepared, as well as those who are optimistic.
Making money from speculation is painful. Big-cap meme coins all go through extreme shakeo
post-image
MEME+1.87%
$AKE has shed two zeros—must hold, must hold, 100x, absolutely.
post-image
AKE-14.79%
$$Lobster's 29% gain: 87M in trading volume shows you what turnover-based distribution looks like
The price of 0.0938 is stuck between 0.1027 and 0.0711, with trapped holders above and profit-taking holders below. Going long here is just handing fees to the market maker. My system shows that the 0.0711–0.1027 range has already seen massive volume, but the price has failed to make a new high—a textbook distribution structure.
Here's the trading plan: Entry zone: enter only after a pullback to 0.084–0.086 holds; abandon the trade if it breaks 0.083. Stop-loss: 0.0805 (hard stop; a break below me
龙虾+29.85%
Everyone’s staring at $ETH /USDT’s range—but the 4h just armed a trap most won’t see until it’s too late.

$ETH /USDT - SHORT

Trade Plan:
Entry: 2446.97 – 2456.75
SL: 2498.80
TP1: 2416.66
TP2: 2393.19
TP3: 2357.98

Why this setup?
Why now? The 1D is range-bound, yet the 4h SHORT signal is armed at 2451.86 with a 55% confidence—not a slam dunk, but a precise edge.
• RSI on 15m is 43.79, showing weak momentum, not yet oversold—room to fall.
• ATR 1h is 19.55, so the move to TP1 (2416.66) is only ~1.4x daily noise—tight, actionable.
• Invalidation sits at 2462.70, just 0.4% above entry—
ETH-1.97%
$1000 to $100,000 Crypto Trade Challenge Today
live-cover
LIVE529
Everyone’s watching 718, but the real trap is the range above 730—are you shorting the fakeout?

$BNB /USDT - SHORT

Trade Plan:
Entry: 716.83 – 719.47
SL: 730.78
TP1: 708.68
TP2: 702.37
TP3: 692.90

Why this setup?
- BNB sits at 718.15 with a 4h SHORT bias (55% confidence) while the 1D trend chops sideways—no momentum to break higher.
- RSI (15m) at 47.84 shows zero buying pressure; ATR (1h) at 5.26 means moves are tight, but TP1 at 708.68 is a clean 1.3% drop from entry.
- Why now? Price is “Armed” below resistance—if 719.47 holds as the ceiling, downside to 702.37 (TP2) opens fast, b
BNB-0.70%
I originally wanted to cut my losses and sacrifice the position to the heavens, but before I could, the meat cooked itself. When the sell-off first hit in the early session, $SOXS already gave off a strong sense that something was wrong: trading volume was low, and there was simply no one willing to buy the rebound. It was even more obvious when I checked the market after lunch—the resistance above was rock-solid, and the rebound was extremely weak.
My judgment at the time was simple: with this kind of price action, any move up would just hand money to short sellers. I went short at 52.38, wi
post-image
SOXS-10.11%
SOL-2.35%
ADA-4.93%
PARABOLIC SEASON LOADING 🚀🚀
BE READY🤯🤯
#shillb#crypto
post-image
Everyone’s staring at SKYAI’s bounce—I’m watching the 95% short signal that just armed.

$SKYAI /USDT - SHORT

Trade Plan:
Entry: 0.05651 – 0.05715
SL: 0.05988
TP1: 0.05454
TP2: 0.05302
TP3: 0.05073

Why this setup?
- 4H bias is SHORT with 95% confidence, while the 1D trend stays bearish—this isn’t a dip, it’s a breakdown rehearsal.
- RSI on 15m sits at 46, meaning momentum hasn’t flipped bullish; it’s just catching its breath before the next leg down.
- Price is hovering at 0.05683, but TP1 at 0.05454 is only a 4% slide away—and TP3 at 0.05073 offers over 10% if the bears stay in contr
SKYAI-2.02%
【Price Trend Analysis】
1. K-line patterns:
* 4-hour chart: At 20:00 on September 04, a large bearish candle appeared on heavy volume, followed by two K-lines consolidating at low levels. The current K-line’s closing price is close to its low, indicating that bearish forces are dominant.
* Daily chart: A bearish candle with long upper and lower shadows formed on September 04. Its body was relatively large, with the closing price below the opening price and below the previous day’s close, indicating that bulls faced strong selling pressure after attempting to test the highs.
2. Technical ind
Load More

Join 40 M users in our growing community

⚡️ Join 40 M users in the crypto craze discussion

💬 Engage with your favorite top creators

👍 See what interests you

View More