



Square
Following
Hot
News
Profile
Share your thoughts
placeholder
Article
September PPI Shock: 6.3% YoY - The Production Side Inflation is Back, and The Fed Game Has Changed.
The data is out. The US September Producer Price Index, released on October 15th at 8:30 AM ET, was not just a beat, it was a terrifying upside surprise that has completely rewritten the rate path.
If you were expecting a cool-down, you were wrong. Here is the academic breakdown of what really happened.
1. The Numbers: Expectations vs. Reality - A Massive Overshoot
The consensus was clear before the release: Headline PPI to rise 0.5% - 0.6% MoM, and 5.3% YoY. Core PPI to rise 0.3% MoM.
The real
post-image
BTC+0.76%
US500+0.22%
XAUUSD+0.06%
  • 7
  • 3
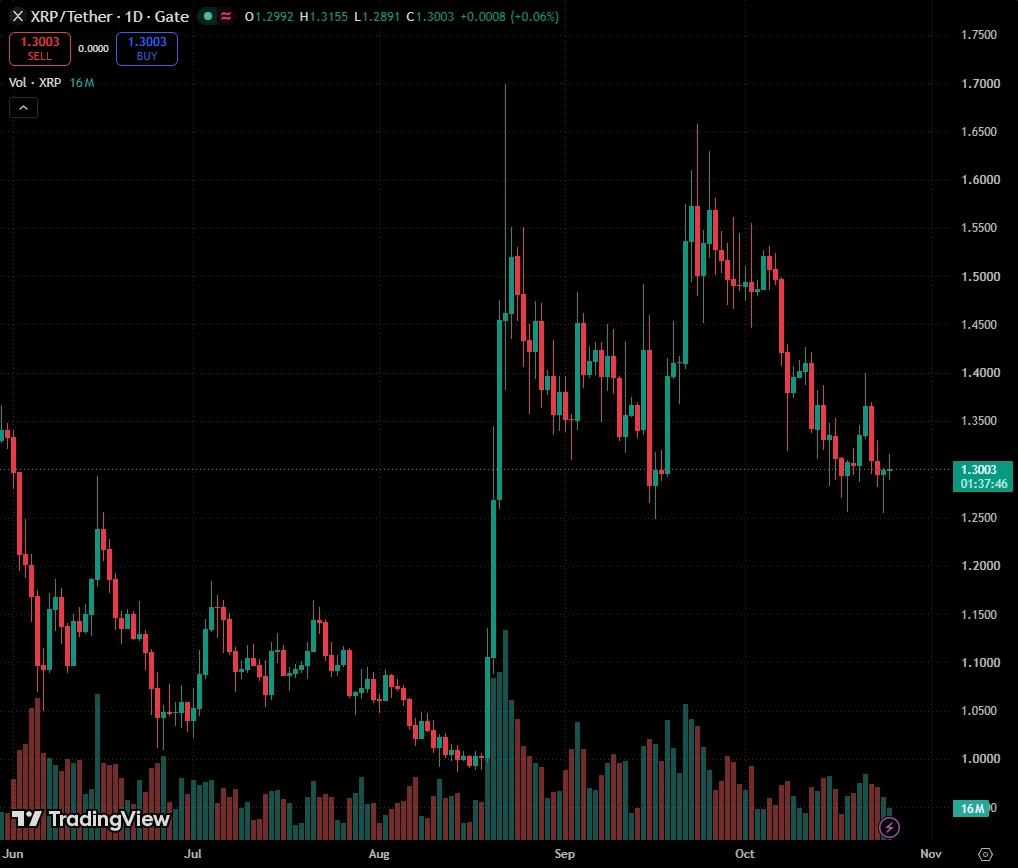
On the daily chart, Xiao Huangyu remains in a bearish structure of progressively lower highs. After consecutive declines, a candlestick with a lower shadow appeared, indicating a short-term willingness to stabilize and recover, and a technical rebound may emerge. However, the bullish candle's body is relatively weak and failed to break above the point where the previous decline began; essentially, it remains a pullback recovery
On the 4-hour chart, the price staged a slight rebound after stabilizing at a low, with several small bullish candles formed consecutively in the short term. However, t
post-image
BTC+0.72%
ETH+2.48%
Morning analysis sets the tone: resistance at higher levels; favor a pullback with the trend. The live market’s spike and retreat confirmed it throughout—timing was nailed. Those who followed the 25-point range have scored another four wins $XAU ‌
XAU+0.75%
crypto overall update
live-cover
LIVE2,239
Hammer Bobi October 16, 2026 ETH Market Analysis
Market review: The previously mentioned 2330 and 2300 were successfully bottom-fished
Today's market analysis: A very long lower wick on the daily chart
The market is oscillating around the daily box range of 2325—2517 and 2548
Holding above 2440, 2460, and 2480 targets 2500 and 2540
Historical key levels 2380 and 2400 remain valid
Prioritize going long, with shorting as a supplement; sell high and buy low within the range—do not blindly hold out of conviction
Watch the market if 2400 and 2410 br
ETH+2.57%
The short-term prediction market shows highly unified bullish expectations, with the market essentially ruling out ETH breaking significantly below 2,200.
Odds are extremely low at all levels, leaving no trading upside on the long side.
In an environment with highly consistent bullish sentiment, beware of the risk of a sudden wick-driven pullback. Once the price breaks below 2,300, it could significantly impact this prediction market.
The short-term prediction market shows highly unified bullish expectations, with the market essentially ruling out ETH breaking significantly below 2,200.
Odds a
post-image
ETH+2.57%
  • 1
@RIL_Updates reply on @Starlink “Competition is welcome. Rules are the same for everyone.”
Jio’s own satellite services clearance is also still pending.
Starlink will also have to go through the same process.
Jio’s claim 530 million customers, in one decade.
Everything is only on the rule of law.
post-image
BREAKING: flips Uniswap V4 in 24h fees, $1.9M versus $1.7M.
That moves it to #8 on DefiLlama, up from #9 yesterday.
@Uniswap
post-image
UNI+5.35%
$JST Short-term bullish, but this is a passive long position following the broader market, not an independently strong trend.
The Fear & Greed Index remains in the greed zone at 63. As long as BTC holds its support, capital is willing to rotate into mid- and small-cap coins, making JST a beneficiary rather than a leader. Technically, MA5=0.13398 is above MA20=0.133663, and the MACD histogram at +0.0005121 remains bullish. RSI=56.3 is neutral to strong, with no overbought pressure. The Bollinger Bands are narrowing to 0.130857–0.13647, and the current price of 0.13595 is near the upper band, in
post-image
BTC+0.76%
WAL-22.91%
Going short or going long?
What a classic feint—showing one hand while secretly playing another
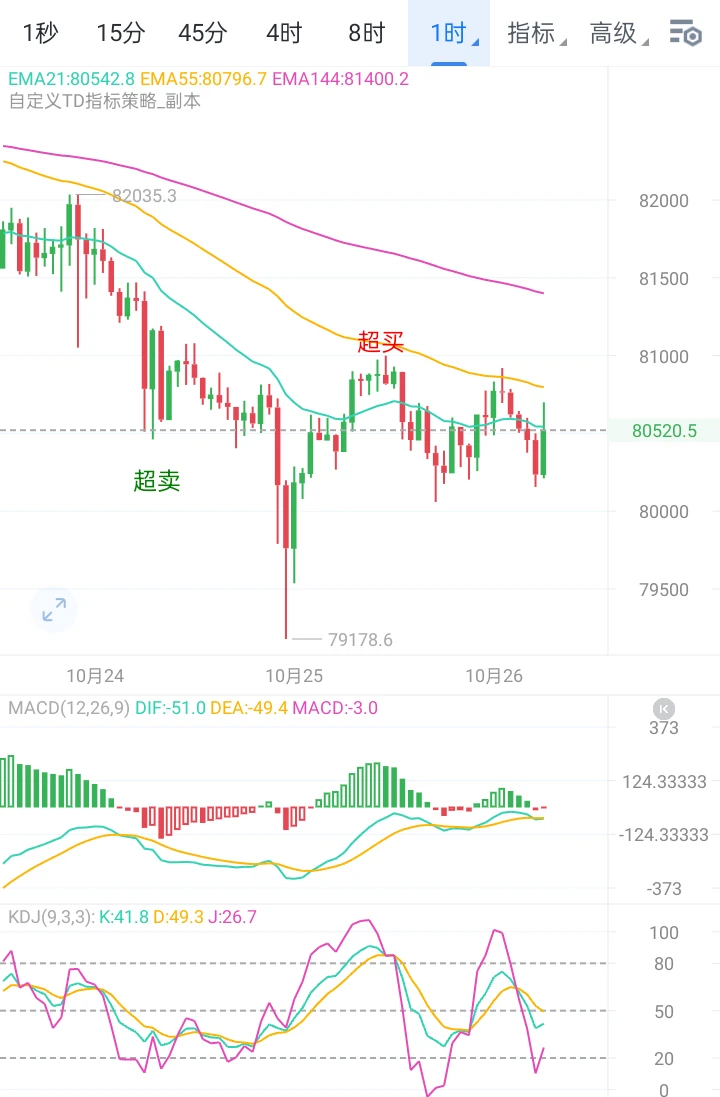
A fake break below 80,000; take profits when it hits the 70,000s! Rebound of over 3,000 points!
Buying pressure is building below and providing support, but the bullish trend lacks volume
Currently consolidating and accumulating, ready to move in either direction
Intraday trading advice:
Key right-side levels: 82471—81821
Long setup: Enter long at 81300-81800
BTC breaks above 82471 on volume and holds
Targets: 83132--83880
$BTC ‌#美国9月PPI大超预期
post-image
BTC+0.72%
The great tech stocks to crypto rotation is on.
Send it back to the highs.
$BTC
BTC+0.76%
Eth market update
live-cover
LIVE1,899
I know that the majority on this platform are lying about buying $BTC or any other tokens when it was sub 70k by how much you crashout over 5% moves btw
post-image
BTC+0.76%
Hi lawyers!
Just conducting some business transactions 👀
post-image
web3 developer activity just hit a 5-year low
the builders are leaving?
post-image
Going with the trend is the right move: long at 4163, exit at 4170, capturing a $7 range and $674!
$ETH $XAU #黄金 #Solana大升级定档
post-image
ETH+2.48%
XAU+0.75%
$TRX TRX at End of Multi-Year Correction, Could go to $55+
TRX has spent months in an extremely tight range within what I’m counting as wave-e of E. My volatility-compression indicator is showing extreme, persistent readings, with the current stretch approaching its historical duration record.
I’ve labeled the potential 2018–2026 correction as a triangle, although other interpretations remain possible. The more immediate focus is the contracting structure developing from the 2024 high. If this triangle is completing, the count favors an upward thrust.
The bigger question is what that triangle
post-image
TRX+1.38%
$BTW Do you understand?
post-image
BTW-13.30%
  • 1
Recently, my intraday trading has been going pretty well 🙈
Load More

Join 40 M users in our growing community

⚡️ Join 40 M users in the crypto craze discussion

💬 Engage with your favorite top creators

👍 See what interests you

Trending Topics

USSeptemberPPIBeatsExpectations

91.35k Views1.9k Discussing

US September PPI came in at 6.3% YoY, well above the 5.3% market expectation, pointing to renewed producer-side inflation pressure. Weekly jobless claims were 199K, broadly in line with forecasts. Could hotter inflation further reduce room for rate cuts, and what does it mean for $BTC, US stocks, and gold?

GateWCTCS9GlobalTradingCompetition

37.87k Views6.42k Discussing

WarshIMFSpeech

62.4k Views755 Discussing

View More