














#SolanaNonVoteTxHits8.92B
SOLANA RECORDS 8.92 BILLION NON-VOTE TRANSACTIONS — IS NETWORK ADOPTION ENTERING A NEW PHASE?
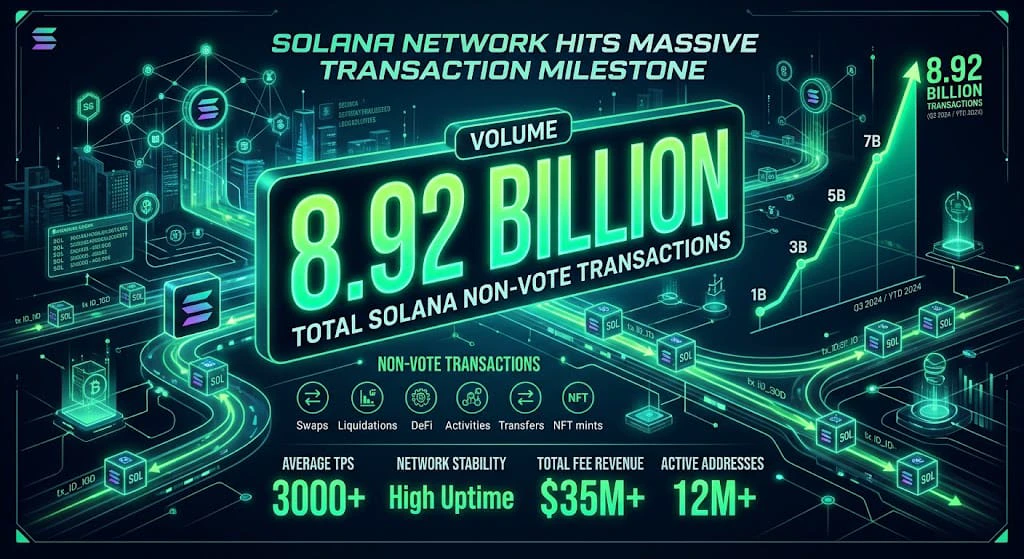
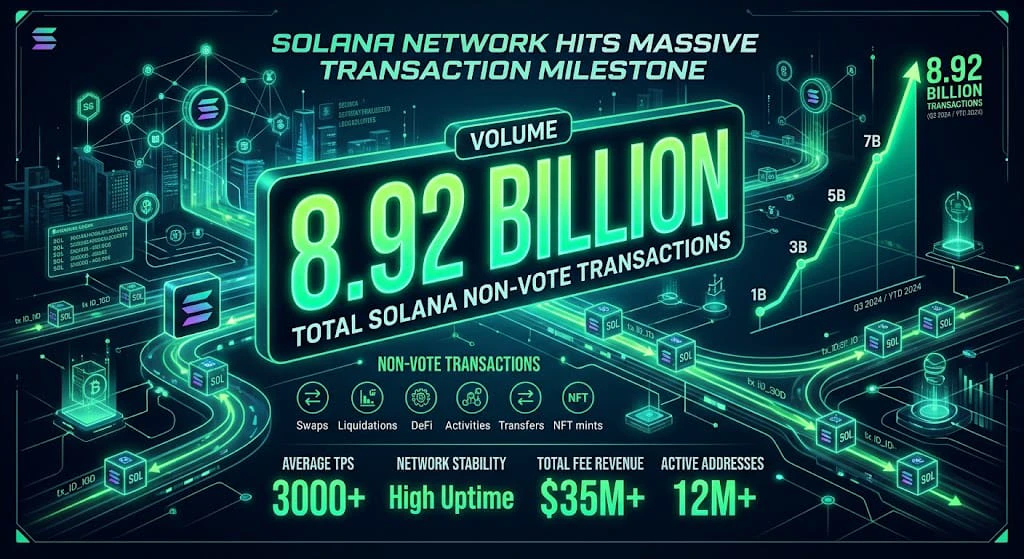
Solana is once again drawing attention across the crypto market as its reported non-vote transaction activity reached an impressive 8.92 billion transactions in Q3 2026. This milestone highlights the scale of activity taking place across one of the industry's leading high-throughput blockchain networks.
But the bigger story is not just the number itself. It is what this level of activity could mean for decentralized finance, on-chain trading, payments, decentralized applications, and the long-term investment narrative surrounding SOL.
According to Solana's published figures, the Q3 total was approximately 104% higher than Q4 2025, more than doubling over that comparison period. However, this is not quarter-over-quarter growth. Independent Solana Compass data recorded 8.78 billion completed non-vote transactions in Q3, up 23.3% from Q2, illustrating both the strong trend and differences between data providers.
📊 What Are Non-Vote Transactions?
Solana validators exchange vote transactions to help maintain consensus and secure the blockchain. Non-vote transactions exclude these validator votes and capture activity such as token transfers, swaps, and interactions with decentralized applications.
This distinction matters because non-vote activity gives investors a more useful view of application-level blockchain usage than a figure dominated by validator consensus operations.
Nevertheless, transaction counts are not a perfect measure of adoption. Automated trading bots, arbitrage strategies, and repeated transactions can contribute significantly to network activity. Therefore, a record number of transactions does not automatically mean a proportional increase in unique users or economic value.
🔥 Why Is Solana Attracting Attention?
Solana's appeal comes from its high throughput, relatively low transaction costs, and active ecosystem of trading applications.
Decentralized exchanges allow users to trade tokens directly on-chain, while DeFi protocols support lending, borrowing, and liquidity provision. Stablecoin transfers and emerging tokenized assets provide additional potential use cases.
As blockchain applications compete for users, networks that can process large numbers of transactions efficiently may have an advantage. Solana's latest quarterly figures reinforce its position as a significant player in this competition.
The next challenge is converting activity into sustainable economic value through real users, meaningful transactions, application revenue, and continued developer participation.
💰 What Does This Mean for SOL's Price?
Strong network activity can support a positive long-term investment narrative, but it does not guarantee an immediate price increase.
A bullish scenario could develop if transaction growth is accompanied by rising stablecoin usage, healthy DeFi liquidity, stronger application revenue, and improving market sentiment. These factors could strengthen confidence in Solana's ecosystem.
A bearish scenario remains possible if SOL faces broader crypto-market weakness, speculative activity declines, liquidity deteriorates, or network growth fails to translate into sustainable demand.
Investors should therefore examine network activity alongside SOL's price action, trading volume, market capitalization, and broader Bitcoin market direction.
🔍 Key Metrics to Watch Next
The most important indicators include successful transactions, unique active addresses, transaction fees, DeFi total value locked, stablecoin supply, decentralized exchange volume, and developer activity.
It is also worth tracking how Solana's protocol upgrades affect finality and performance. Improvements in network efficiency could support future adoption, although their benefits must be assessed through actual network performance rather than expectations alone.
📈 My Outlook: Cautiously Bullish on Network Fundamentals
Solana's 8.92 billion reported non-vote transactions represent a significant activity milestone. The data suggests that the network continues to support substantial on-chain usage, while the independent figures also demonstrate why consistent measurement standards matter.
My outlook is cautiously bullish on Solana's long-term ecosystem potential, provided that transaction growth is accompanied by stronger organic demand and sustainable economic activity. Short-term SOL price movements, however, remain uncertain and will depend on liquidity, investor sentiment, and the wider crypto market.
Final Thought: A blockchain's success should not be measured by transaction counts alone. The real test is whether it can transform high throughput into useful applications, lasting adoption, and economic value.
Solana has demonstrated impressive activity. The next milestone is proving how much of that activity translates into sustainable growth.
#Solana #SOL
SOLANA RECORDS 8.92 BILLION NON-VOTE TRANSACTIONS — IS NETWORK ADOPTION ENTERING A NEW PHASE?
Solana is once again drawing attention across the crypto market as its reported non-vote transaction activity reached an impressive 8.92 billion transactions in Q3 2026. This milestone highlights the scale of activity taking place across one of the industry's leading high-throughput blockchain networks.
But the bigger story is not just the number itself. It is what this level of activity could mean for decentralized finance, on-chain trading, payments, decentralized applications, and the long-term investment narrative surrounding SOL.
According to Solana's published figures, the Q3 total was approximately 104% higher than Q4 2025, more than doubling over that comparison period. However, this is not quarter-over-quarter growth. Independent Solana Compass data recorded 8.78 billion completed non-vote transactions in Q3, up 23.3% from Q2, illustrating both the strong trend and differences between data providers.
📊 What Are Non-Vote Transactions?
Solana validators exchange vote transactions to help maintain consensus and secure the blockchain. Non-vote transactions exclude these validator votes and capture activity such as token transfers, swaps, and interactions with decentralized applications.
This distinction matters because non-vote activity gives investors a more useful view of application-level blockchain usage than a figure dominated by validator consensus operations.
Nevertheless, transaction counts are not a perfect measure of adoption. Automated trading bots, arbitrage strategies, and repeated transactions can contribute significantly to network activity. Therefore, a record number of transactions does not automatically mean a proportional increase in unique users or economic value.
🔥 Why Is Solana Attracting Attention?
Solana's appeal comes from its high throughput, relatively low transaction costs, and active ecosystem of trading applications.
Decentralized exchanges allow users to trade tokens directly on-chain, while DeFi protocols support lending, borrowing, and liquidity provision. Stablecoin transfers and emerging tokenized assets provide additional potential use cases.
As blockchain applications compete for users, networks that can process large numbers of transactions efficiently may have an advantage. Solana's latest quarterly figures reinforce its position as a significant player in this competition.
The next challenge is converting activity into sustainable economic value through real users, meaningful transactions, application revenue, and continued developer participation.
💰 What Does This Mean for SOL's Price?
Strong network activity can support a positive long-term investment narrative, but it does not guarantee an immediate price increase.
A bullish scenario could develop if transaction growth is accompanied by rising stablecoin usage, healthy DeFi liquidity, stronger application revenue, and improving market sentiment. These factors could strengthen confidence in Solana's ecosystem.
A bearish scenario remains possible if SOL faces broader crypto-market weakness, speculative activity declines, liquidity deteriorates, or network growth fails to translate into sustainable demand.
Investors should therefore examine network activity alongside SOL's price action, trading volume, market capitalization, and broader Bitcoin market direction.
🔍 Key Metrics to Watch Next
The most important indicators include successful transactions, unique active addresses, transaction fees, DeFi total value locked, stablecoin supply, decentralized exchange volume, and developer activity.
It is also worth tracking how Solana's protocol upgrades affect finality and performance. Improvements in network efficiency could support future adoption, although their benefits must be assessed through actual network performance rather than expectations alone.
📈 My Outlook: Cautiously Bullish on Network Fundamentals
Solana's 8.92 billion reported non-vote transactions represent a significant activity milestone. The data suggests that the network continues to support substantial on-chain usage, while the independent figures also demonstrate why consistent measurement standards matter.
My outlook is cautiously bullish on Solana's long-term ecosystem potential, provided that transaction growth is accompanied by stronger organic demand and sustainable economic activity. Short-term SOL price movements, however, remain uncertain and will depend on liquidity, investor sentiment, and the wider crypto market.
Final Thought: A blockchain's success should not be measured by transaction counts alone. The real test is whether it can transform high throughput into useful applications, lasting adoption, and economic value.
Solana has demonstrated impressive activity. The next milestone is proving how much of that activity translates into sustainable growth.
#Solana #SOL