





Share your thoughts
placeholder
Article
The 11.3 million market-cap token’s volume ratio hit 10.29: GUN surged 20%
Damn, the 11.3 million market-cap token’s volume ratio hit 10.29—$GUN is now at 0.00335, up 20.9% in 24 hours, a purely volume-driven move. I’m bullish: buy the dips on pullbacks, and exit if it breaks below 0.00308.

The market structure is twisted. The daily RSI is only 47.1, while MACD has just formed a golden cross below zero and the red bars are expanding; however, MA7 remains below MA30, and multi-timeframe signals are still bearish—this is a rally against the structure, not a reversal. More than 70% of accoun
GUN+3.63%
I didn’t realize until I counted it up that I really can’t finish it
So cheap, $10
Just an old dude’s weekend happiness 🎉
No stream tonight, so don’t make a wasted trip
$NVDA$SNDK
post-image
NVDA+1.23%
SNDK+11.05%
The bear market isn't over, yet the crypto market has been green since last month. Is this FOMO or an accelerated bull market? For sure,
for now, I won't buy BTC. I'll start accumulating at the beginning of 2027. It's okay if I miss out.
#GateSquareMidAutumnReunion
#BTCRetakes80K
$BTC $ETH $SOL $AKE $GT
BTC-1.04%
ETH-2.31%
SOL-3.02%
AKE-16.92%
GT+1.50%
  • 7
I’ve managed to hold this $UNI long position until now. The key wasn’t guessing the direction, but the pullback confirmation above 6.662. I didn’t chase when the price first surged to 8.783; I waited for it to hold above the short-term moving average on the pullback, then added to the position as planned. Current unrealized profit: +2255.3%.
Structurally, the moving averages are beginning to fan upward, but what really matters is that the key prior-high level has not been fully cleared. As long as the price stays above the key pullback level, the bullish structure remains intact; if it breaks
post-image
UNI-3.66%
SNDK-0.97%
SOL-3.02%
$AKE survived a major disaster; I don't dare add to my position, so I'll keep shorting it until it goes to zero.
AKE-16.77%
(New Streamer)Market Research
live-cover
LIVE2,003
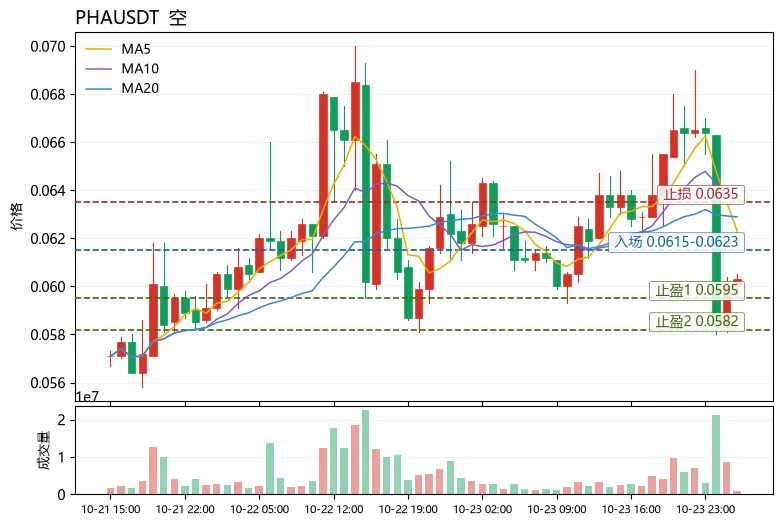
Most traders are ignoring the hidden trap forming inside $ONE /USDT right now.

$ONE /USDT - SHORT

Trade Plan:
Entry: 0.003702 – 0.003970
SL: 0.005122
TP1: 0.002871
TP2: 0.002228
TP3: 0.001263

Why this setup?
Why now? The 1h price is sitting at 0.003840 inside a daily range, the 15m RSI reads 45.66 showing balanced pressure, and the 1h ATR of 0.000536 signals the current volatility can fuel a sharp move. The entry zone between 0.003702 and 0.003970 aligns with the short bias at 0.003836, while TP1 at 0.002871 and TP2 at 0.002228 define the measured targets on the way down. The invalidatio
ONE+69.29%
$ADA IS RESETTING AFTER THE SPIKE
🟢 $ADA LONG SETUP
ADA ran from $0.1901 → $0.2352 and is now pulling back around $0.2193. The 4H chart is still holding above the $0.212–$0.205 support area, while recent volume confirms strong participation during the recovery.
Entry: $0.218–$0.222
TP1: $0.228
TP2: $0.235
TP3: $0.245
SL: $0.205
Structure: Bullish above $0.205
Liquidity: $0.228–$0.235
Zone of Interest: $0.218–$0.222
No FOMO here. If ADA holds the zone and buyers return, the previous high becomes the first liquidity target. A clean break below $0.205 weakens this setup.
#ADA #TradingSignal
$
post-image
ADA-2.64%
🚀🔵 #StandardCharteredSeesARBAt10By2030
Standard Chartered has initiated coverage on Arbitrum ($ARB ) with a $10 end-2030 price target. 📊🔥
📍 2026: $0.50
📍 2027: $1.50
📍 2028: $3.50
📍 2029: $6.50
🎯 2030: $10
The bank points to Arbitrum’s role in bringing traditional financial activity on-chain, including tokenized assets and infrastructure for financial institutions. Robinhood Chain is highlighted as an important example of this strategy. 🌐🏦
⚠️ This is Standard Chartered’s forecast, not a guaranteed outcome. Crypto markets remain highly volatile. DYOR.
#ARB #Arbitrum #Crypto #Ethereum
post-image
ARB+1.40%
ETH-2.32%
WHO IS STILL HOLDING $FLR ?! ☀️
post-image
FLR-2.70%
By the way | Bullish bias 🟢 | 15-minute trend pullback/continuation · Confidence: 95/100 Watch: 0.6273 Invalidation line: 0.605391 (3.49%) Targets: 0.654686 / 0.671117 / 0.693026 RSI14: 65.3 · ADX14: 45.7 · Volume: 1.49x If the 15-minute candlestick closes below this invalidation line, the setup is considered invalid. For educational purposes only; this does not constitute financial advice. Leverage carries extremely high risk. $BT
post-image
Guys, pay attention—did any of you win the $BR
and $AKE
trades? With it moving on the chart like this, who can make money? It’s rising way too hard, long long longggg. Watch out, it’s going to drop sharply, so you can short now. It’s only rising to liquidate shorts. A sharp drop is coming.
post-image
BR+25.17%
AKE-16.92%
Altcoins just surged across the board. I’m shorting them; it’s not a huge amount of money. Mainly, I was thinking how nice it would be to use this money to buy something for my wife and kids...
post-image
#Gate广场中秋团圆局 $MU Will Micron, down 22%, see its September 30 earnings report mark a turning point?
Since bottoming out in April 2025, Micron Technology (MU) has delivered an extreme rally, with its share price surging 15-fold in 17 months. But after reaching a new interim high in June this year, the stock quickly retreated, posting a cumulative 22% drawdown.
As the company approaches the key date of releasing its latest earnings report on September 30, this deep correction has triggered intense market debate: Is this adjustment a healthy entry opportunity in the AI memory supercycle, or an ear
post-image
MU+3.80%
  • 4
🚨 SEPTEMBER IS BREAKING BITCOIN’S HISTORY?
September has historically been one of Bitcoin’s weaker months.
According to the chart, September’s historical average return is around -2.60%, with a median of -2.44%.
But 2026 is looking different so far.
Bitcoin is currently showing a +3.7% September return, putting this month firmly above its historical September average.
The interesting part is that September has often struggled while October and November have historically been much stronger months.
So the real question is:
Is Bitcoin finally breaking the September pattern, or is the month still
post-image
BTC-1.04%
It's great that I joined $G —it was the right decision, as I was able to remove $AKE
$ONE
🥂🥂🥂🥂🥂🥂🥂🥂😍😍😍😍.
post-image
AKE-16.77%
Layout for Bitcoin, Ethereum, and Dogecoin
live-cover
LIVE1,460
I started doing YouTube this June.
Since I trade every day, I began recording it along the way and gradually turned it into my own vlog.
Recording my trades, and my life too. 📈🇯🇵
#BTC重回80K #BTCRetakes80K
Bitcoin is retaking the $80,000 area, but this move needs to be read carefully.
BTC is currently around $80,360, after reaching a 24-hour high near $81,944 and then falling to a 24-hour low around $80,130. The recovery from that low is why the market is talking about Bitcoin “retaking” $80K again. The important question now is whether buyers can turn this recovery into a stable base or whether $80K becomes another level of rejection.
THE $80K BATTLE
The price action is giving us a clear short-term range.
BTC pushed toward $81,944, but sellers appeared before the marke
post-image
BTC-1.04%
  • 3
Everyone's ignoring ZEC while it's quietly building a massive long setup.

$ZEC /USDT - LONG

Trade Plan:
Entry: 1434.79 – 1445.99
SL: 1386.64
TP1: 1480.70
TP2: 1507.58
TP3: 1547.89

Why this setup?
Why now? The daily trend is firmly bullish, giving us the higher-timeframe tailwind that most setups lack right now. The 15m RSI at 45.63 shows room to run without being overextended, meaning we are not buying exhaustion. The 1h ATR of 22.395024 tells us enough volatility exists to push toward TP1 at 1480.70 and TP2 at 1507.58 from an entry zone of 1434.79 to 1445.99 around the 1h price of 1440.
ZEC-6.34%
Load More

Join 40 M users in our growing community

⚡️ Join 40 M users in the crypto craze discussion

💬 Engage with your favorite top creators

👍 See what interests you

Trending Topics

MSTRTopsNasdaq100

73.81k Views2.83k Discussing

Strategy (MSTR) has gained about 48% over the past month, making it the best-performing stock in the Nasdaq 100, while Bitcoin rose roughly 12% over the same period. The company holds 845,050 BTC with a cumulative cost basis of about $63.73B. MSTR is not a pure Bitcoin proxy — its price swings can be more extreme. Can this rally last?

Gate Tops 24H Net Inflows Among Exchanges

26.33k Views3.67k Discussing

BTCRetakes80K

56.85k Views60.29k Discussing

View More