






#StockTradingShareChallenge
🚨 #StockTradingShareChallenge — BTC AT A CRITICAL DECISION ZONE
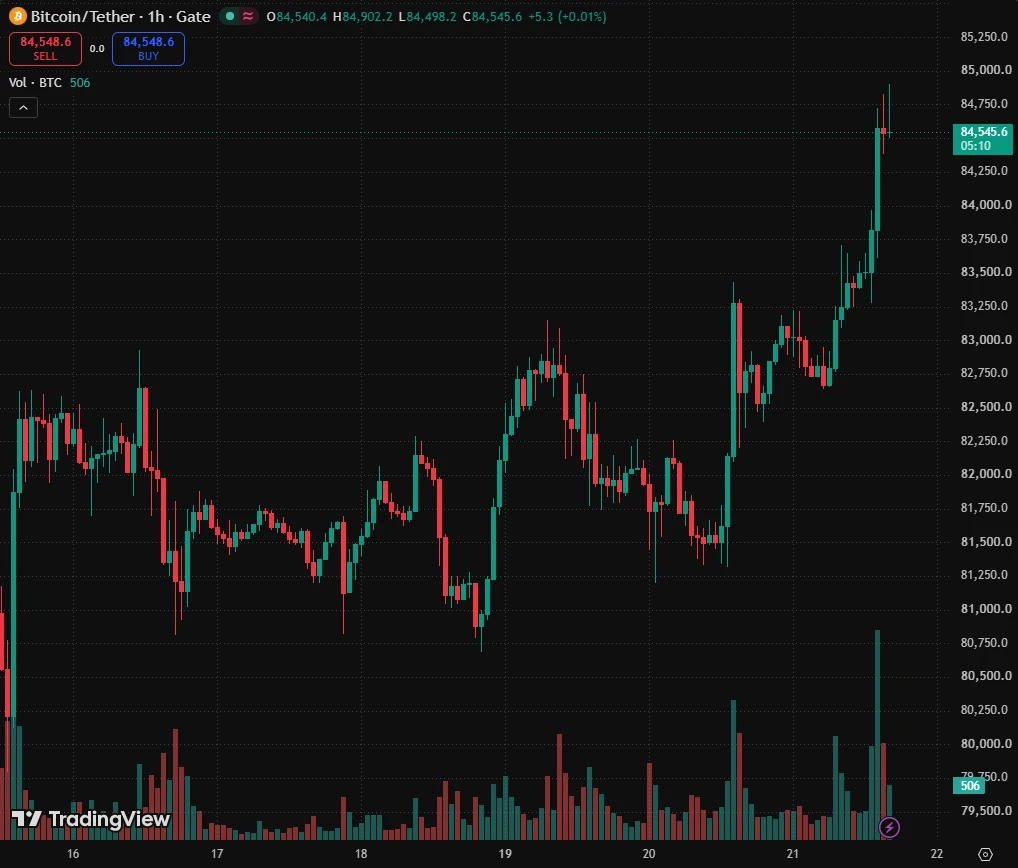
₿ Bitcoin is trading around $63,658, with today’s session opening near $63,785, reaching a high of approximately $64,473 and a low around $63,312. BTC is currently moving almost sideways, showing that buyers and sellers remain locked in a tight battle.
After several sessions of consolidation, Bitcoin is approaching a major decision point. The market has repeatedly struggled to establish a sustained move above the $64,000–$65,000 resistance zone, while buyers continue defending the lower levels.
📊 CURRENT BTC STRUCTURE
Bitcoin recently declined from around $66,900 toward the $58,100 area before recovering through a series of higher lows.
However, the recovery has now stalled around $63,300–$64,500.
Small daily candles and long wicks suggest significant indecision. Neither bulls nor bears currently have complete control.
The key question is simple:
Will BTC break resistance, or will support finally give way?
🔥 BULLISH SCENARIO
If Bitcoin successfully reclaims and holds above $64,500, the next important resistance comes around:
➡️ $65,500
➡️ $67,000
➡️ $68,000–$69,000
A decisive break above $67,000 could significantly improve the technical structure and potentially signal that the recent correction is losing momentum.
A move toward $69,000 from current levels would represent a substantial recovery and could attract additional momentum traders.
⚠️ BEARISH SCENARIO
If BTC fails to hold the $63,300 area, downside pressure could increase.
Important support levels:
🔹 $63,300 — immediate support
🔹 $62,000 — stronger support
🔹 $60,000 — major psychological level
🔹 $58,100 — deeper bearish target
A sustained breakdown below $60,000 would weaken the recovery structure considerably and could signal that sellers are regaining control.
📈 KEY RESISTANCE
R1: $64,500
R2: $65,500
R3: $67,000
📉 KEY SUPPORT
S1: $63,300
S2: $62,000
S3: $60,000
🎯 POTENTIAL TRADING PLAN
For a bullish setup, traders may watch the $63,100–$63,300 area for a confirmed bounce rather than blindly entering during volatility.
Potential upside zones:
TP1: $64,500
TP2: $65,500
TP3: $67,000
For a bearish setup, rejection around $64,500–$64,800 could create a short-term downside opportunity, with lower levels becoming relevant if support breaks.
Possible downside targets:
TP1: $63,700
TP2: $63,100
TP3: $62,300
⚠️ RISK MANAGEMENT
This market is currently highly sensitive to macroeconomic data, so volatility can increase rapidly.
Avoid oversized positions, especially around major economic releases. Stops should be planned before entering a trade rather than added after the market moves against you.
The best approach right now may be patience + confirmation.
Don't chase a green candle.
Don't panic on a red candle.
Wait for BTC to prove the direction.
🚀 THE BIG BTC QUESTION
Above $65,500, bullish momentum could strengthen.
Above $67,000, the recovery structure becomes much more convincing.
Below $63,300, bears could test $62,000 and potentially $60,000.
For now, Bitcoin remains trapped inside a critical range, and the next decisive breakout could determine the short-term trend.
Trade the confirmation, manage the risk, and let the market show the direction. ₿🔥
Technical levels are scenarios, not guaranteed price targets. Always do your own research and manage risk carefully.
#BTC #StockTradingShareChallenge #GateSquare
🚨 #StockTradingShareChallenge — BTC AT A CRITICAL DECISION ZONE
₿ Bitcoin is trading around $63,658, with today’s session opening near $63,785, reaching a high of approximately $64,473 and a low around $63,312. BTC is currently moving almost sideways, showing that buyers and sellers remain locked in a tight battle.
After several sessions of consolidation, Bitcoin is approaching a major decision point. The market has repeatedly struggled to establish a sustained move above the $64,000–$65,000 resistance zone, while buyers continue defending the lower levels.
📊 CURRENT BTC STRUCTURE
Bitcoin recently declined from around $66,900 toward the $58,100 area before recovering through a series of higher lows.
However, the recovery has now stalled around $63,300–$64,500.
Small daily candles and long wicks suggest significant indecision. Neither bulls nor bears currently have complete control.
The key question is simple:
Will BTC break resistance, or will support finally give way?
🔥 BULLISH SCENARIO
If Bitcoin successfully reclaims and holds above $64,500, the next important resistance comes around:
➡️ $65,500
➡️ $67,000
➡️ $68,000–$69,000
A decisive break above $67,000 could significantly improve the technical structure and potentially signal that the recent correction is losing momentum.
A move toward $69,000 from current levels would represent a substantial recovery and could attract additional momentum traders.
⚠️ BEARISH SCENARIO
If BTC fails to hold the $63,300 area, downside pressure could increase.
Important support levels:
🔹 $63,300 — immediate support
🔹 $62,000 — stronger support
🔹 $60,000 — major psychological level
🔹 $58,100 — deeper bearish target
A sustained breakdown below $60,000 would weaken the recovery structure considerably and could signal that sellers are regaining control.
📈 KEY RESISTANCE
R1: $64,500
R2: $65,500
R3: $67,000
📉 KEY SUPPORT
S1: $63,300
S2: $62,000
S3: $60,000
🎯 POTENTIAL TRADING PLAN
For a bullish setup, traders may watch the $63,100–$63,300 area for a confirmed bounce rather than blindly entering during volatility.
Potential upside zones:
TP1: $64,500
TP2: $65,500
TP3: $67,000
For a bearish setup, rejection around $64,500–$64,800 could create a short-term downside opportunity, with lower levels becoming relevant if support breaks.
Possible downside targets:
TP1: $63,700
TP2: $63,100
TP3: $62,300
⚠️ RISK MANAGEMENT
This market is currently highly sensitive to macroeconomic data, so volatility can increase rapidly.
Avoid oversized positions, especially around major economic releases. Stops should be planned before entering a trade rather than added after the market moves against you.
The best approach right now may be patience + confirmation.
Don't chase a green candle.
Don't panic on a red candle.
Wait for BTC to prove the direction.
🚀 THE BIG BTC QUESTION
Above $65,500, bullish momentum could strengthen.
Above $67,000, the recovery structure becomes much more convincing.
Below $63,300, bears could test $62,000 and potentially $60,000.
For now, Bitcoin remains trapped inside a critical range, and the next decisive breakout could determine the short-term trend.
Trade the confirmation, manage the risk, and let the market show the direction. ₿🔥
Technical levels are scenarios, not guaranteed price targets. Always do your own research and manage risk carefully.
#BTC #StockTradingShareChallenge #GateSquare