Square
Following
Hot
News
Notifications
Profile
Share your thoughts
placeholder
Article
Long on $SPCX . Buy range: 130.36 - 131.02 Take profit: 137.01, then 142.07 Stop loss: 126.45 SPCX is squeezing shorts near intraday highs; momentum is strong, but watch for the RSI to cool off quickly. Note: The 15-minute RSI is extremely overbought, increasing the likelihood of sharp mean-reversion wicks. Don’t go all in, bro. Position size should match your own account size.
post-image
SPCX+0.78%
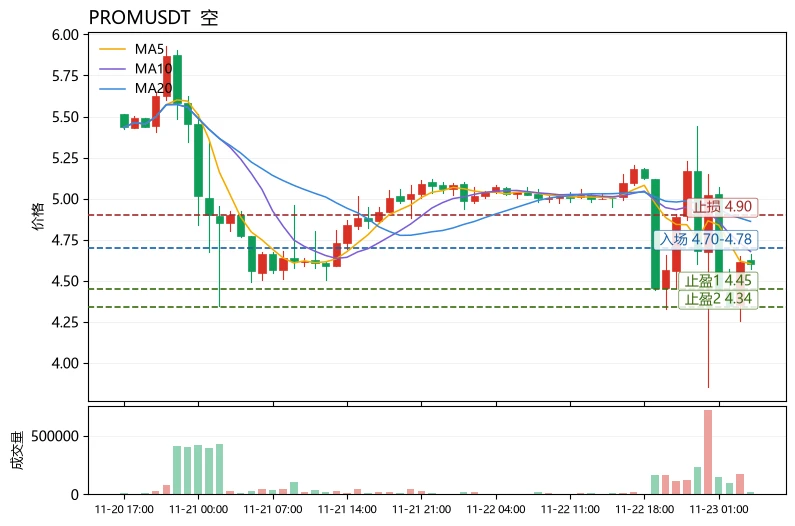
$PROM Current price: 4.604; first resistance above: 4.8616 (MA20); first support below: 4.34 (lower Bollinger Band). Price is hugging the lower Bollinger Band, with MA5 overlapping the current price and far below MA20. The moving averages are bearishly aligned, and the MACD histogram at -0.0411 remains below the zero line, indicating insufficient rebound momentum. However, RSI at 44.7 is not oversold, the funding rate of -0.0123% shows shorts are paying and a short squeeze risk exists, while the extreme fear reading of 11 on the Fear and Greed Index also means the risk-reward for chasing shor
post-image
PROM+0.45%
DOGE-0.22%
SUI-1.05%
Trenches
PIEVERSE
P
bade
b
PIEVERSE
0x0e...25a9
Market Cap
$.
Change
.
24h Vol
$.
Holders
.
IDOL
I
bade
b
IDOL
0x3b...ab07
Market Cap
$.
Change
.
24h Vol
$.
Holders
.
JAGENT
J
bade
b
JAGENT
0x8e...ae15
Market Cap
$.
Change
.
24h Vol
$.
Holders
.
mihao
m
bade
b
mihao
4Cxj...pump
Market Cap
$.
Change
.
24h Vol
$.
Holders
.
CATE
C
bade
b
CATE
Ai66...pump
Market Cap
$.
Change
.
24h Vol
$.
Holders
.
#PCEAndGDPDataNextWeek

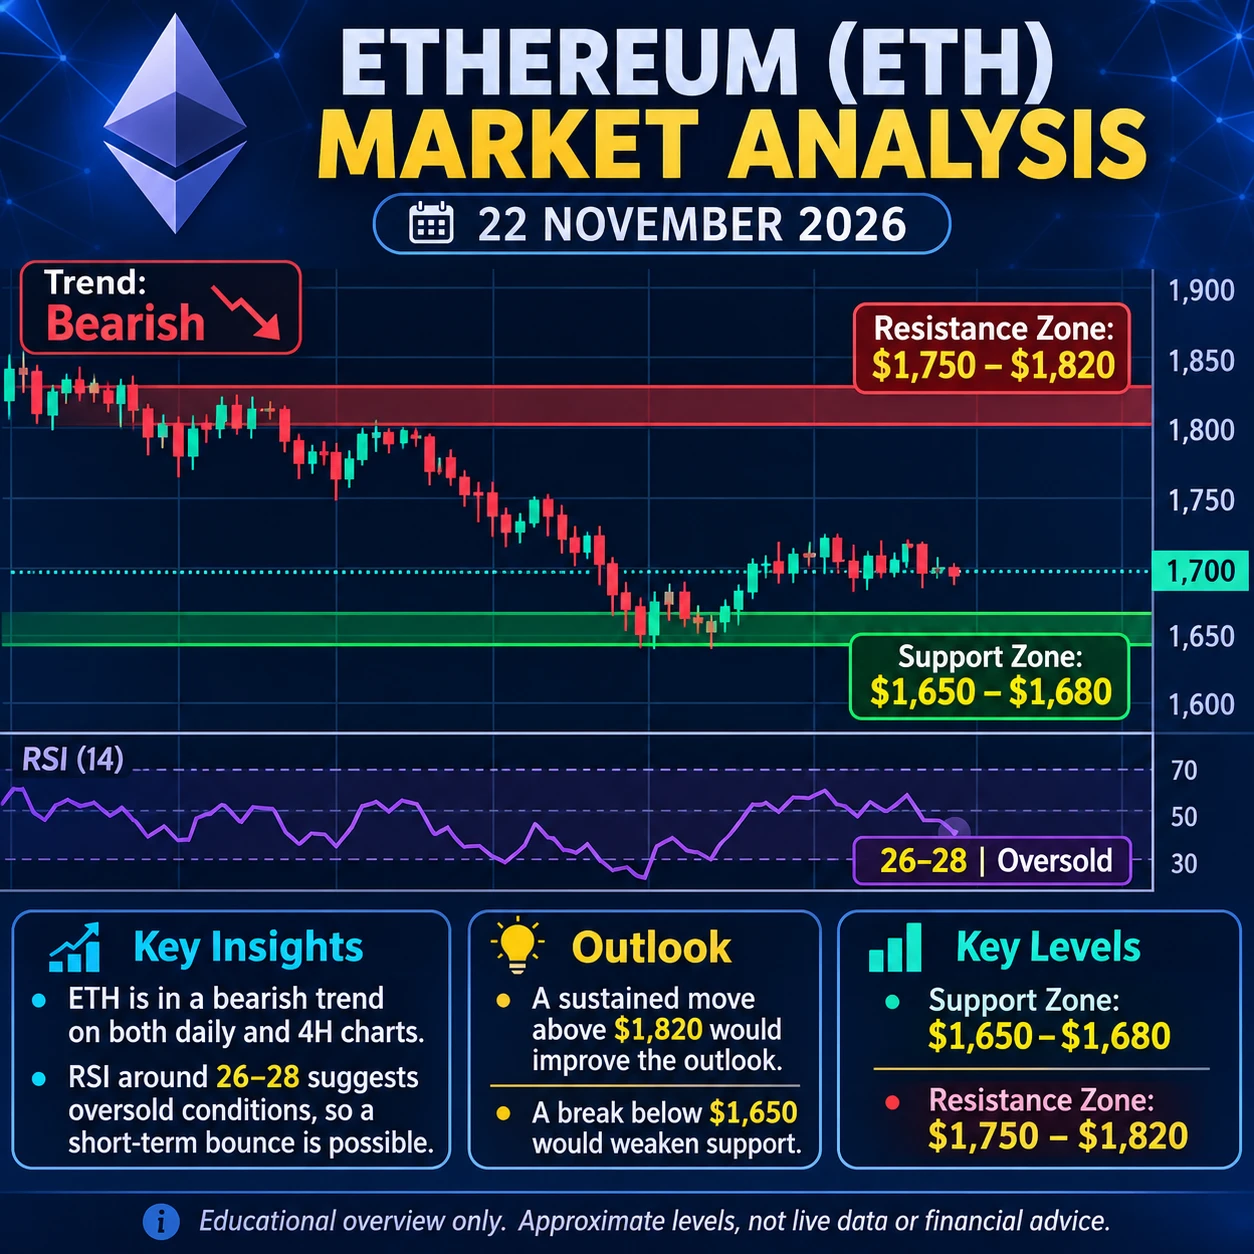
(ETH) Technical Analysis

22 November 2026 | ETH/USD

1\. Market Overview

Ethereum is showing a bearish market structure on both the daily and 4-hour charts. The price is trading around the $1,700 area, although prices vary across market data sources.

2\. Key Support and Resistance

| Level | Price |
| ----------------- | ------------- |
| Resistance 2 | $1,820 |
| Resistance 1 | $1,750 |
| Current reference | $1,700 |
| Support 1 | $1,680–$1,650 |
| Support 2 | $1,575 |

3\. Technical Indicato
post-image
QCOM-0.01%
LLY-0.36%
ETH-1.23%
  • 11
  • 1
4/N
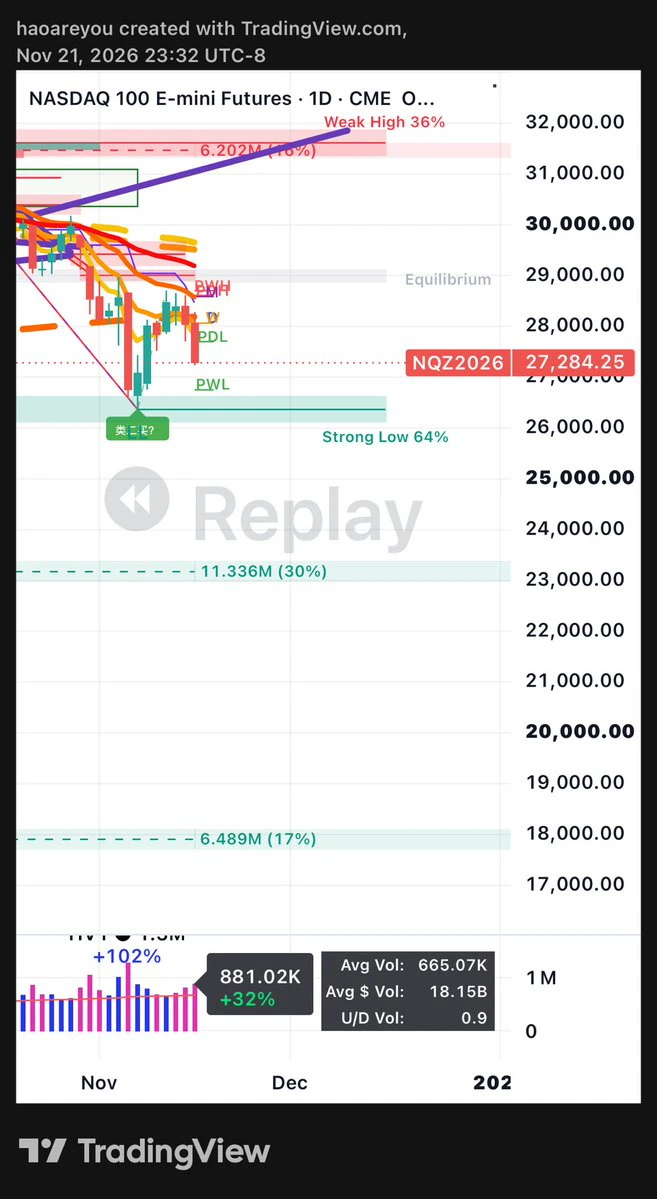
NQ reclaimed 200D SMA on 11/11 and was trying to challenge the top of 11/05 big red candle but failed. I added more longs when 200d reclaimed at 1H level.
Next two days 11/12-11/13 Nq tried to challenge that high 28668 again but failed especially 11/13 the 200d SMA lost I sold everything when 15m lost that level.
NQ had a big bounce in the PM but still got rejected.
I also played the shorts of NVDA/AAOI/SMCI on these days, very good trade.
post-image
NVDA-13.84%
AAOI-16.55%
SMCI-9.01%
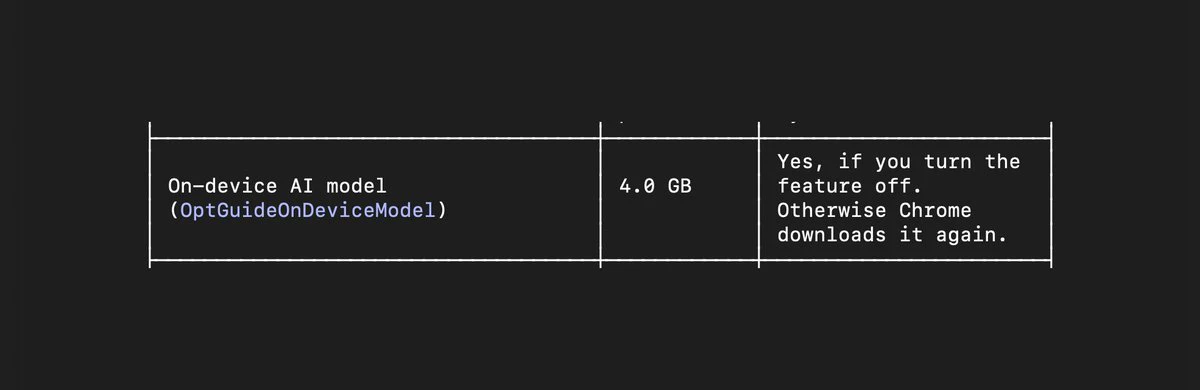
chrome has a 4gb local model downloaded automatically
post-image
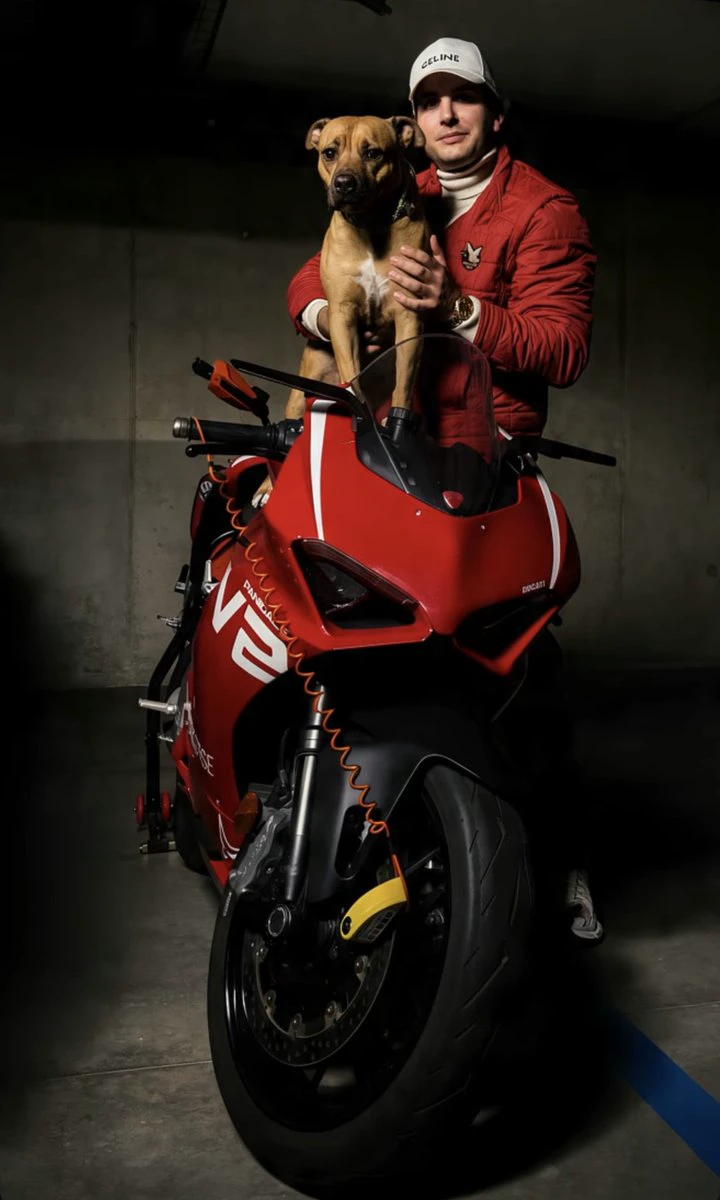
I really like this red. 🐻🏍️
post-image
X renowned trader mk4 closed out BTC short positions, capturing nearly $7,000 drop
live-cover
LIVE40
BTC-0.67%
ETH-1.26%
SOL-0.77%
DOGE-0.22%
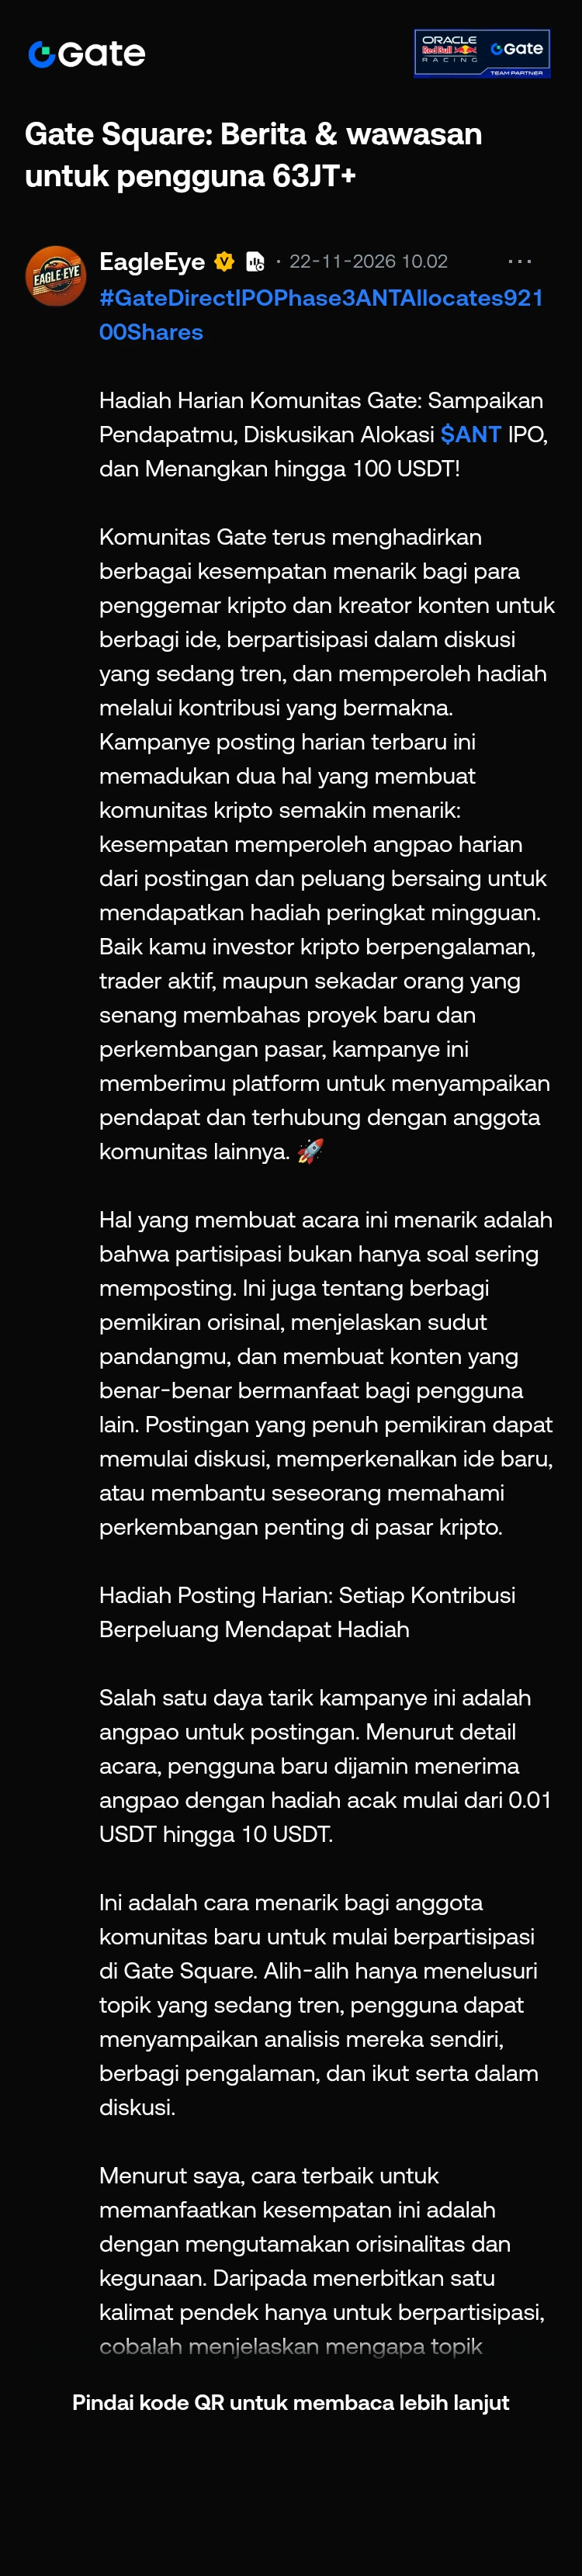
#GateDirectIPOPhase3ANTAllocates92100Shares

Gate Community Daily Rewards: Share Your Thoughts, Discuss $ANT IPO Allocations, and Win Up to 100 USDT!

Gate Community continues to offer exciting opportunities for crypto enthusiasts and content creators to share ideas, participate in trending discussions, and earn rewards through meaningful contributions. This latest daily posting campaign combines two things that make the crypto community even more engaging: the chance to earn daily red envelope rewards for posts and the opportunity to compete for weekly ranking prizes. Whether you are an expe
post-image
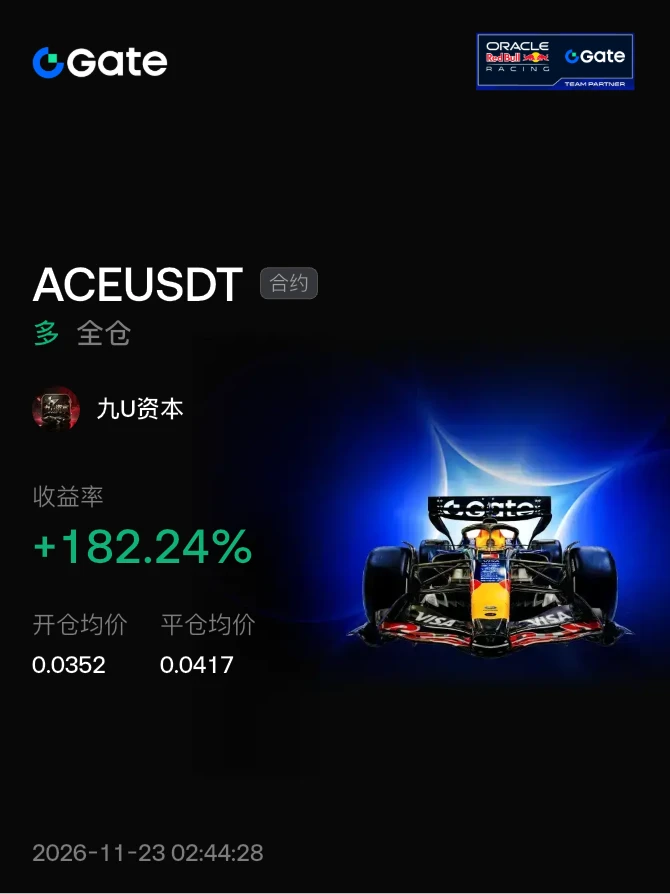
#晒出我的合约收益 Altcoins are highly volatile. I've been burned by them countless times too and had my positions liquidated many times. They each have their merits; I neither reject nor favor them
post-image
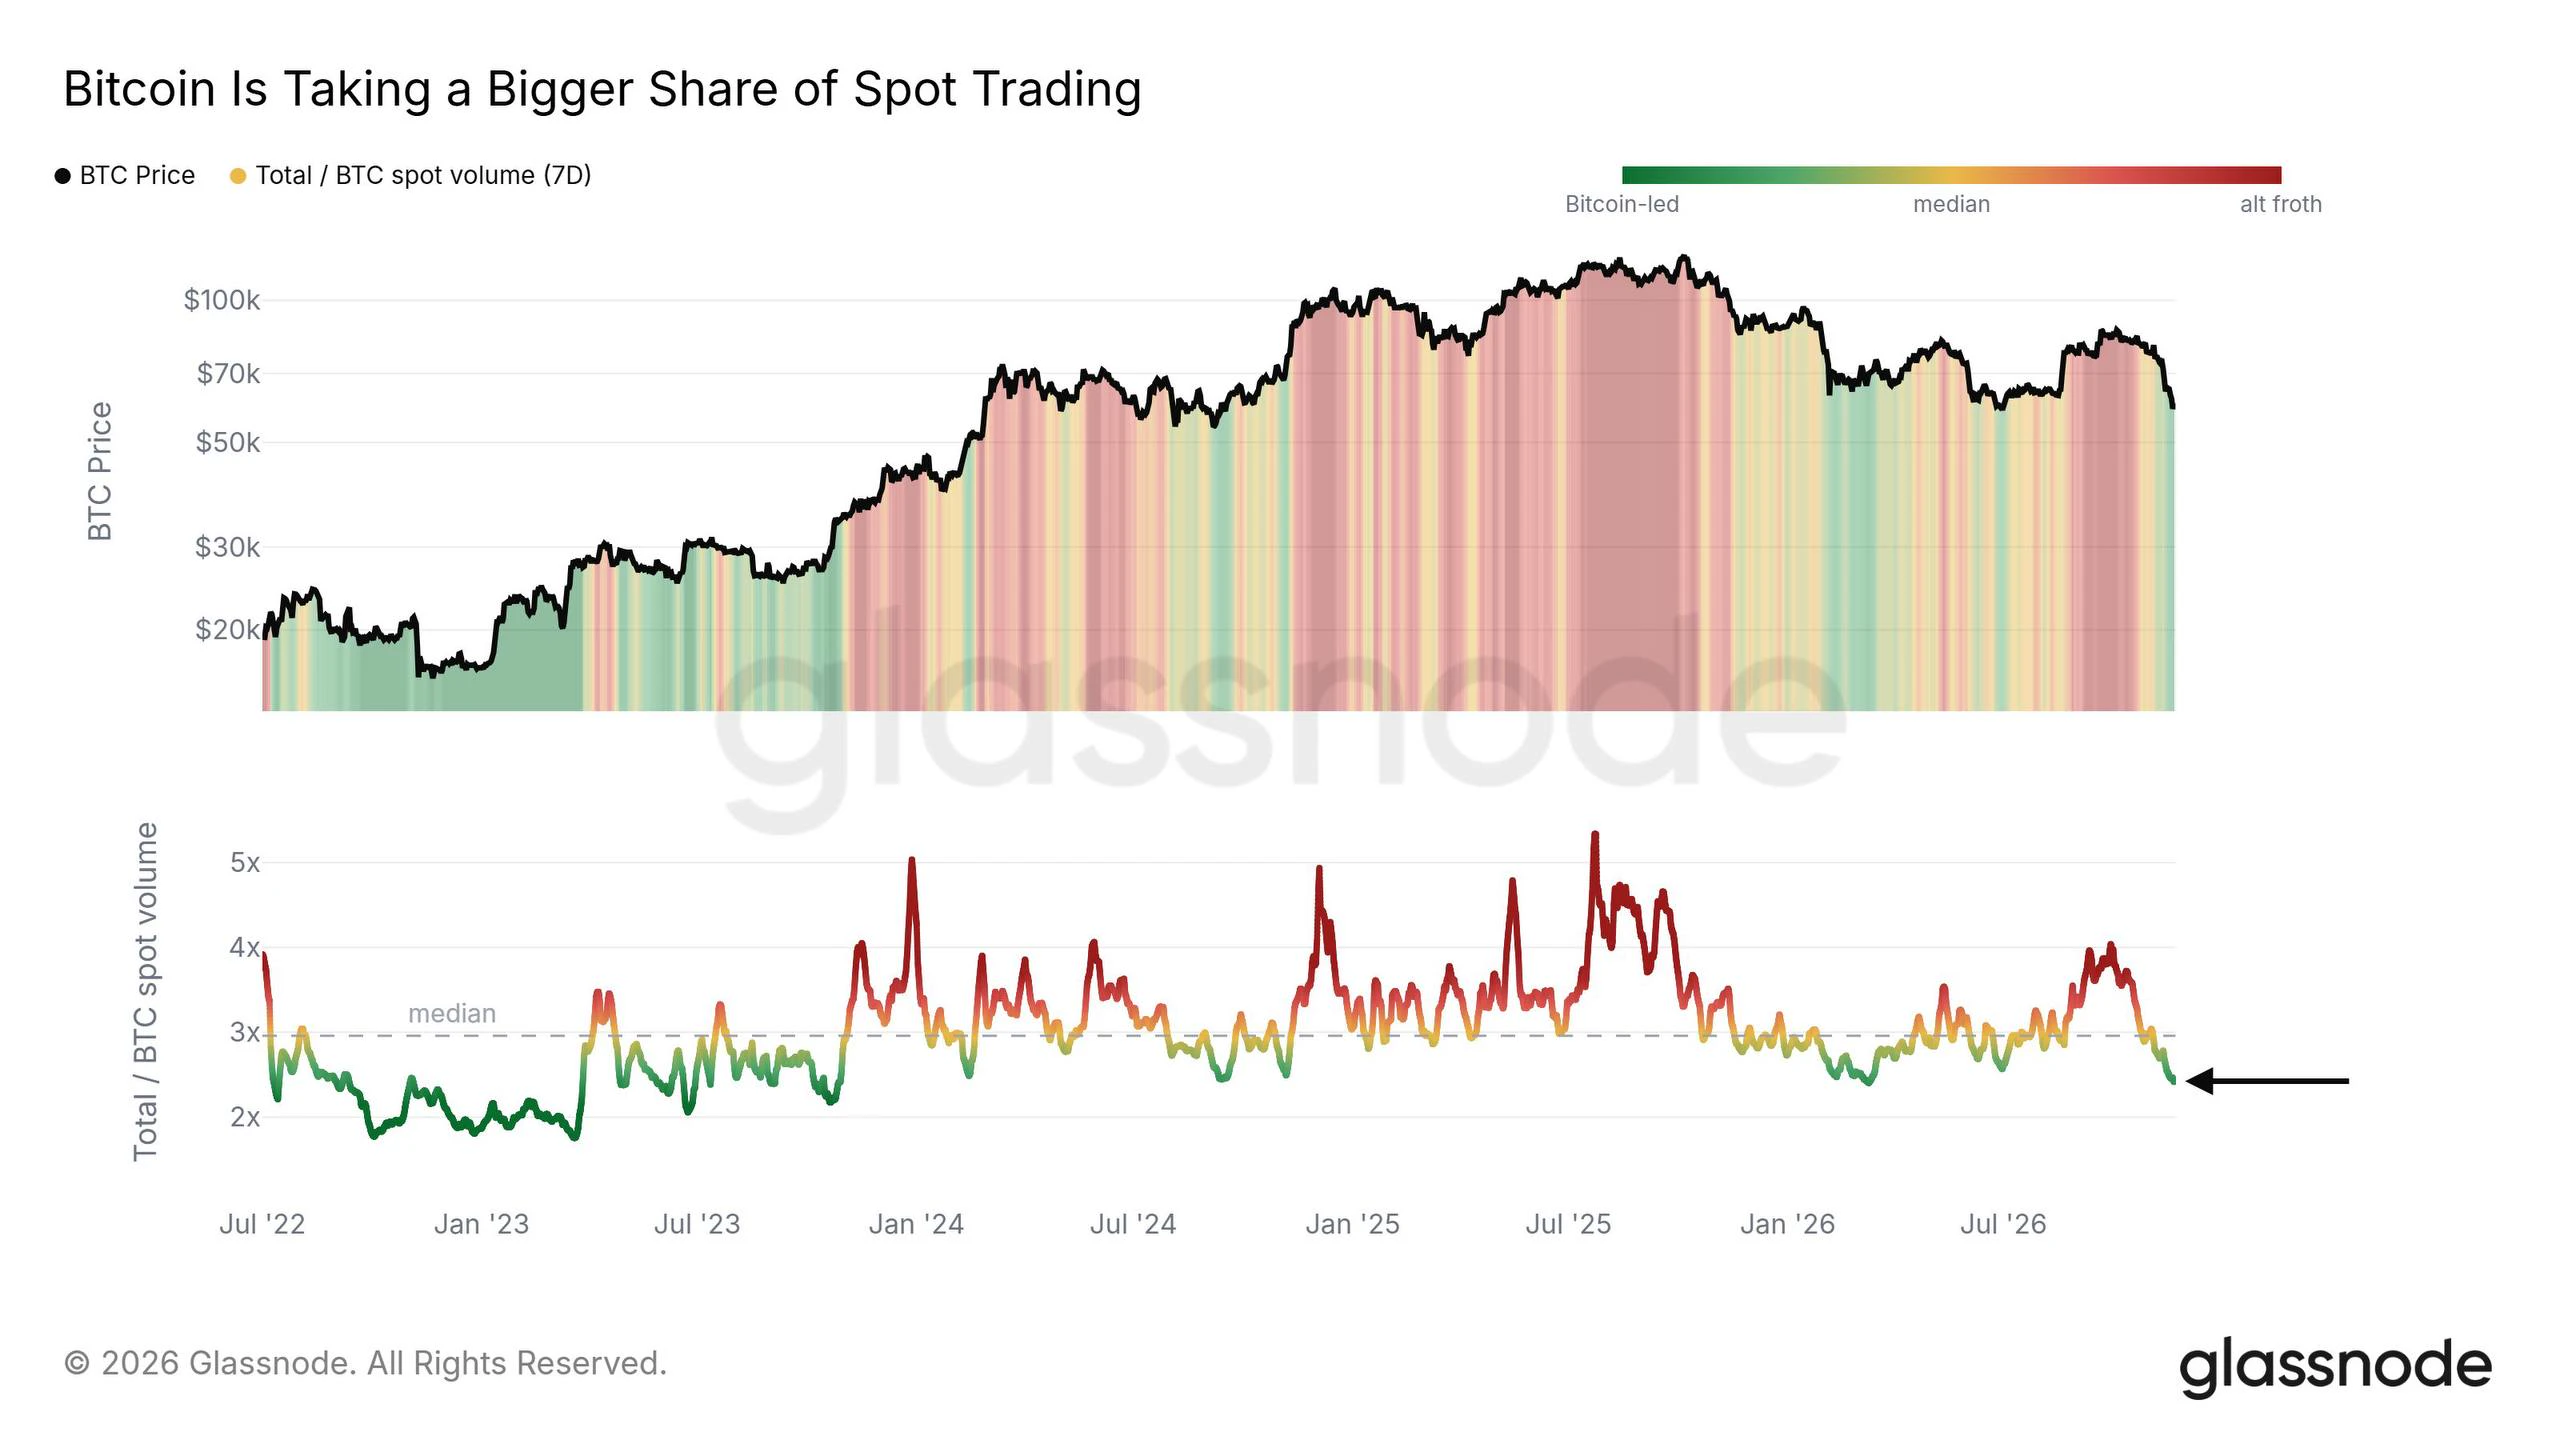
📊 Altcoin Market Update

The altcoin froth has largely disappeared.

In late September, total altcoin spot volume was 4x Bitcoin’s volume. Today, that ratio has fallen below even the summer lows.

This shows how capital is rotating with market sentiment:

🔹 Risk-off: Capital consolidates into BTC. 🔹 Risk-on: Capital flows back into higher-risk altcoins.

For now, the market is showing a clear preference for Bitcoin over altcoins.
$BTC ‌#BTCReboundFaces60KTest #GateAnnualGala #ShareWeekly
post-image
BTC-0.67%
$ZEC Hard line: 808 (24h high + short-position concentration zone). Stay fully positioned only if a 4H candle body closes above 808 and the retest holds 790. Above that, take one-third off at each of 865 (11/20 open), 950, and 1,053. If it fails to close above, halve the position at 790 on the spot; don’t hold through another U.S. market open.

Below, reduce to 20% at 760 (first layer of long-position fuel), down to a watching position at 742 (all three fuel layers dismantled), and exit fully at 687—the moment the wick tip fills, the path points straight to 640 → 580.

Two independent triggers
ZEC+1.29%
BTC-0.65%
ETH-1.23%
Many people treat “extreme fear” as a buy-the-dip signal, which is a classic misconception—sentiment only provides context, not an entry point. The real evidence lies in the moving-average structure and momentum indicators.
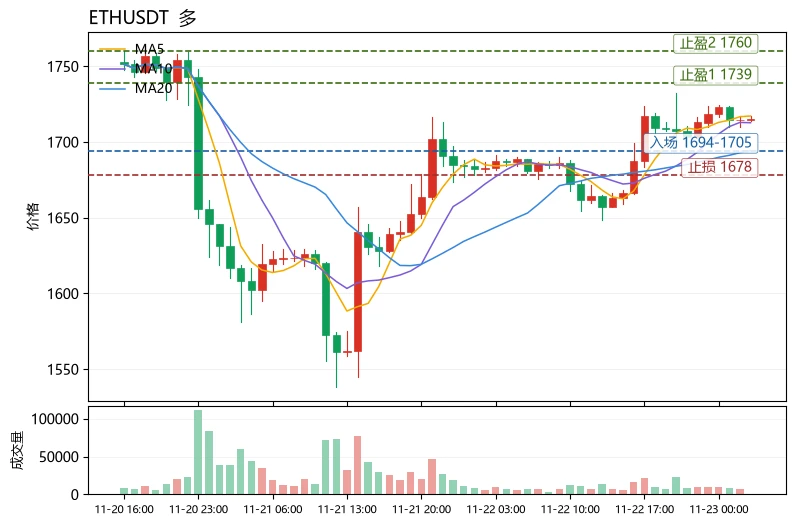
$ETH The current price is 1715.48. MA5=1717.17 is still capping the price, but it has held above MA20=1694.38. The short- and medium-term moving averages are beginning to line up bullishly, indicating a successful retest rather than a breakdown. The MACD histogram at +1.582 remains bullish, with momentum not yet exhausted; RSI=61.2 is strong but not overbought, leaving roo
post-image
WLD-5.61%
ZEC+1.16%
VVV | Long 🟢 | Bullish | 15-minute 24-hour change: +7.76% | Volume: 85.1M USDT. Long rationale: Price is above EMA200; EMA20/50/200 are aligned bullishly; RSI14 is 60.5; the MACD histogram is positive; ADX14 is 30.4; volume is 0.64x the 20-candle average; trend pullback/continuation. Entry: 25.98 Stop-loss: 25.376 Take-profit 1: 26.735 | Take-profit 2: 27.188 | Take-profit 3: 27.792 For reference only; do not chase the price. The strategy is invalidated if the stop-loss level is hit. Technical analysis only, not investment advice. $VVV
post-image
VVV+0.37%
BNB Surpasses 540 USDT with a Narrowed 4.43 Decrease in 24 Hours
live-cover
LIVE751
BTC-0.67%
ETH-1.26%
SOL-0.77%
ZEC+1.16%
XRP-1.15%
#Gate直通IPO第三期ANT配售92100股
The third Gate Direct IPO ANT allocation results are finally out, and 92,100 $ANT shares have been allocated in total.

It's great to see another IPO allocation round completed through Gate Direct. For participants, the allocation result is only one part of the experience. Transparency, a smooth subscription process and equal access to opportunities are equally important.

Personally, I believe IPO participation becomes more interesting when users can explore new opportunities directly through their trading platform without making the process unnecessarily complicated
post-image
ANT+0.00%
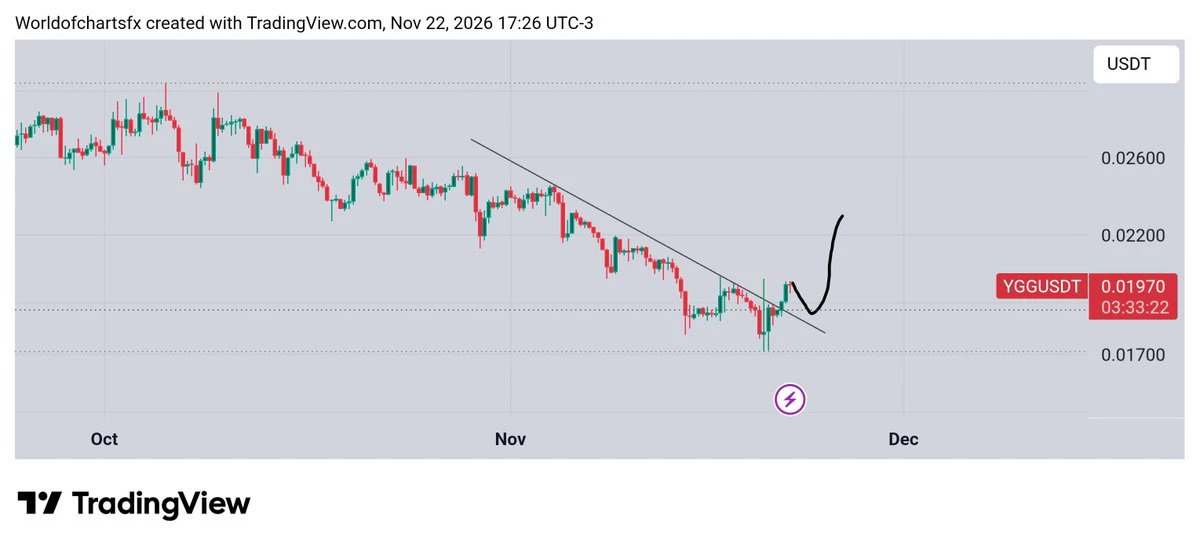
$Ygg #Ygg Successful Retest Can Give Good Scalp Entry
post-image
YGG-1.31%
Global stock markets post their longest losing streak in three years as investor risk aversion rises $BTC
post-image
BTC-0.67%
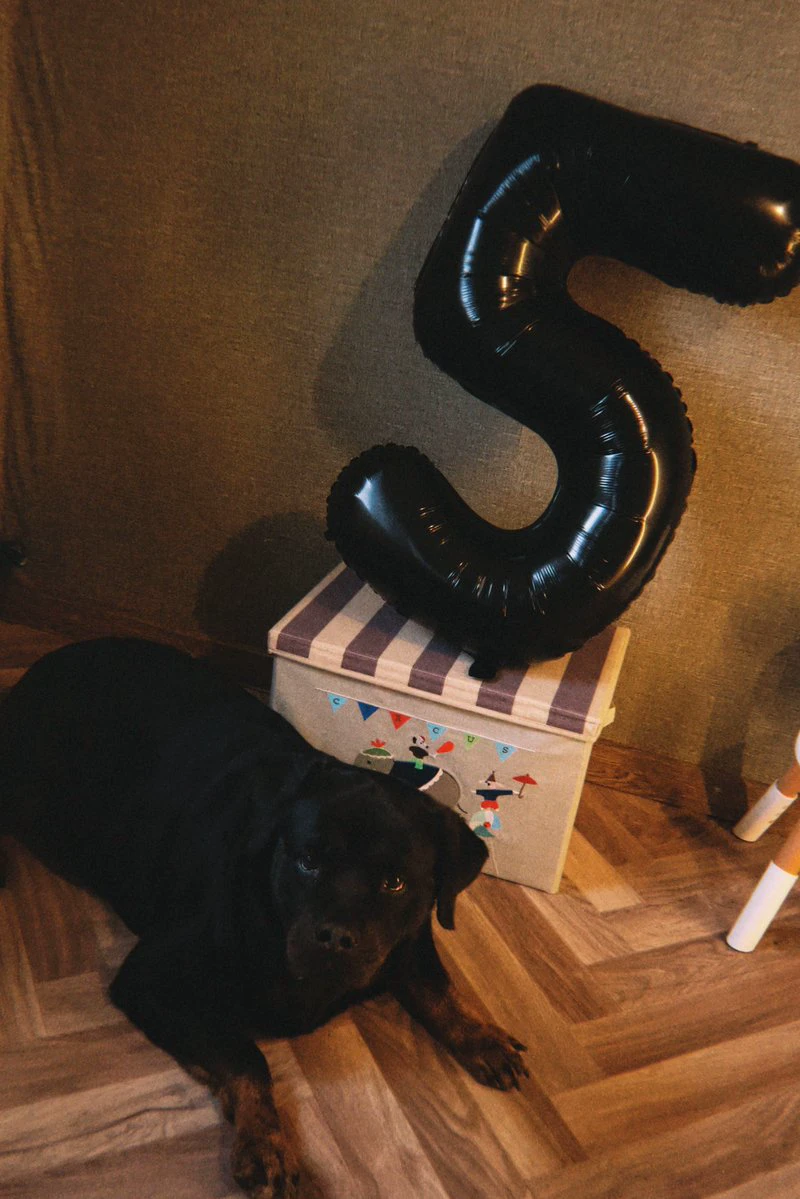
happy 5th birthday to this little baby. my superpower 🐾
post-image
Load More

Join 40 M users in our growing community

⚡️ Join 40 M users in the crypto craze discussion

💬 Engage with your favorite top creators

👍 See what interests you

Trending Topics

BTCReboundFaces60KTest

2.2M Views30.1K Discussing

BTC rebounded from around $55,300 on November 21, briefly reclaiming $60,000 before pulling back to around $59,300. The $60K level is back in focus as traders assess whether the recovery can last. Is this rebound a sign of stabilization or a short-lived recovery? Would reclaiming and holding $60K be enough, or do you need confirmation from trading volume and fund flows?

PCEAndGDPDataNextWeek

261.1K Views2.6K Discussing

GateDirectIPOPhase3ANTAllocates92100Shares

859.3K Views5.1K Discussing

View More