Share your thoughts
placeholder
Article
SKYAI’s 95% short signal is screaming, but the crowd is still buying the dip.

$SKYAI /USDT - SHORT

Trade Plan:
Entry: 0.05687 – 0.05743
SL: 0.05987
TP1: 0.05511
TP2: 0.05375
TP3: 0.05172

Why this setup?
Why now?
- 1D trend is bearish, and the 4h setup aligns with a 95% confidence SHORT.
- Entry at 0.05715 with immediate invalidation at 0.05782—tight risk, high reward.
- TP1 at 0.05511 (-3.6%), TP2 at 0.05375 (-6%), TP3 at 0.05172 (-9.5%).
- RSI 15m at 54.68 shows a weak bounce—sellers are reloading, not exiting.
- ATR 1h at 0.001132 means volatility is compressed—breakouts are
SKYAI-2.17%
JUST IN: Trump claims U.S. control over Iran and hints at potential military action, framing the Iran issue as a matter of urgency. Political risk remains a driver for risk assets and energy-linked crypto flows. $BTC $ETH
post-image
BTC-1.63%
ETH-2.01%
🟢 $ONDO is quietly setting up and that’s exactly what caught my eye.
I’m not interested in the noise around this chart. The interesting part is the reclaim: price has pushed back above the short-term averages after defending the lower range. Now I’m watching whether buyers can turn this bounce into a proper continuation.
Trade Map 👇
🎯 Entry Zone: 0.3600 – 0.3650
🚀 TP1: 0.3720
🚀 TP2: 0.3800
🚀 TP3: 0.3900
⛔ Stop Loss: 0.3530
The 0.3720 area is the first real test. A clean break with volume could open the door toward the higher targets. If price loses the entry structure, I’d rather step as
ONDO+0.74%
Rugging people because you think they are idiots or Stupid or perhaps have a lower IQ than you doesn’t make you a good person. It makes you a predatory scumbag.
This guy should be ashamed.
Fred could do so much good with his influence. Instead he chooses greed.
post-image
JUST IN: Trump downplays US-Iran clash, calling it a “military conflict” not a war and framing it as limited, intermittent strikes. This could influence risk sentiment around Middle East headlines and global macro flow for crypto markets. $BTC $ETH
post-image
BTC-1.63%
ETH-2.01%
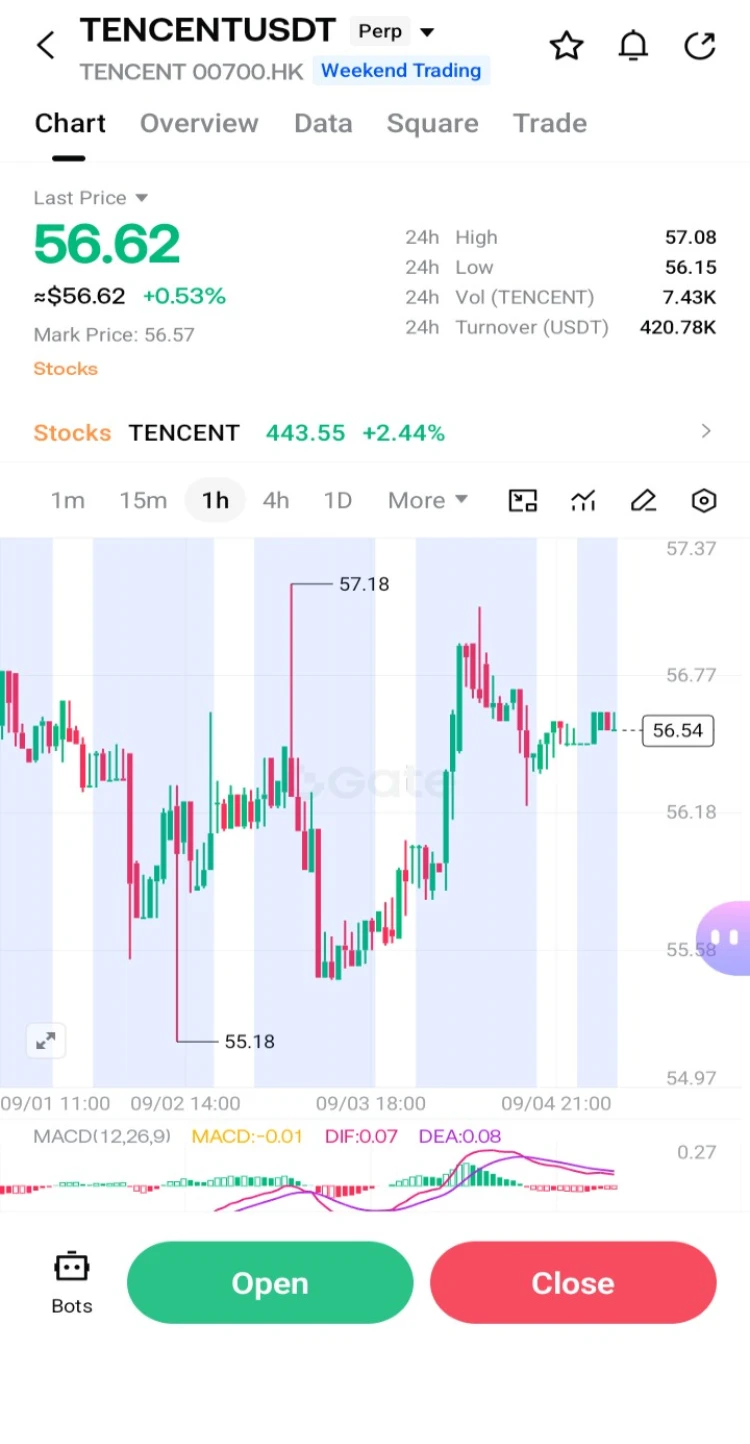
$TENCENT — This Level Is Interesting 👀🔥
Tencent bounced from the HK$440–442 area after recent weakness.
Now I’m watching one simple thing:
Can buyers reclaim HK$450?
If price reclaims the $450 area with volume, momentum could build again.
🟢 Entry: HK$442 – 447
🛑 SL: HK$429
🎯 TP1: HK$460
🎯 TP2: HK$475
🎯 TP3: HK$490
For me, HK$440 is an important level.
As long as buyers are defending this zone, the long setup is interesting.
But if HK$429 breaks decisively, I won’t force the trade.
$450 reclaim → bulls get my attention 🔥
$429 breakdown → setup invalid ❌
No FOMO. No blind entry.
Would y
post-image
TENCENT+0.32%
  • 3
  • 2
#Share My Holding Returns#. is undergoing a correction—an opportunity to keep making gains!!!
post-image
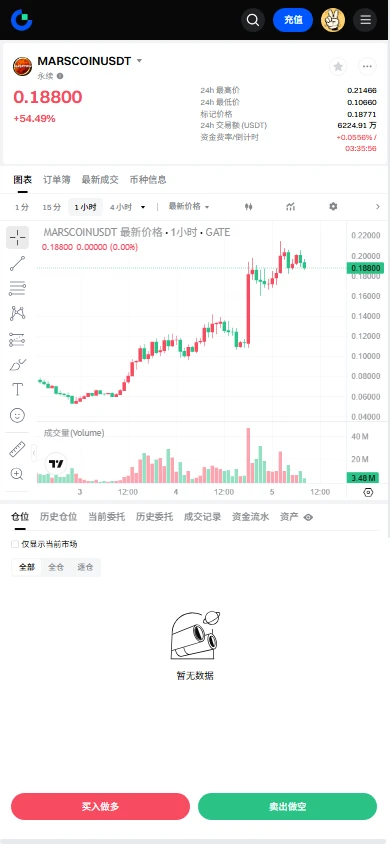
$MARSCOIN Signal】Long Setup: Strong Order Book Support + Pullback Orders
$MARSCOIN Buy-side order book depth imbalance 33.2%, Bid/Ask ratio 1.99, with substantial bids below. The 1H MACD has formed a death cross, with the histogram at -0.0002; bearish momentum is visibly weak. The 4H Bollinger upper band is at 0.2125, while the price is still trading above the middle band. OI is stable, and the funding rate is 0.0498%, so the cost of holding long positions is not extreme.
🎯 Direction: Long
⚡ Entry/Limit Order: 0.1900182 - 0.1905900
🛑 Stop Loss: 0.1886841
🚀 Target 1: 0.1934489
🚀 Target 2
post-image
MARSCOIN+36.46%
BTC-1.63%
ETH-2.01%
SOL-1.61%
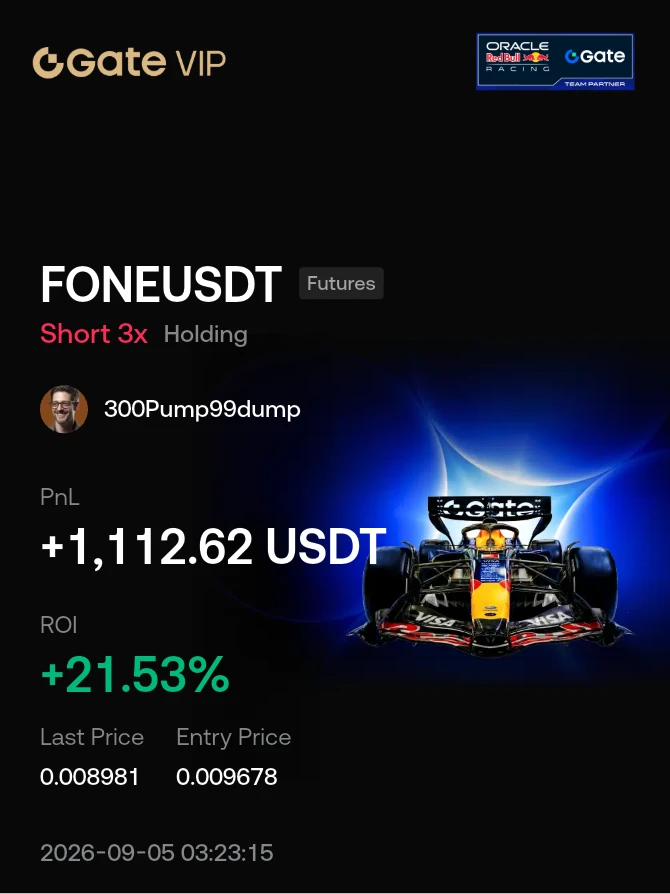
$FONE looks completely dead. Large traders L/S ratio is stil 0.5, but retail traders LS ratio growing and 1.64 for now.
Literaly every green candle in past two days is some big short position being closed.
Open interest slowly drops, meanwhile there was still almost zero long liquidations meaning lot of people still holding their losing long positions waiting for a miracle.
Well, I guess retail traders are just exit liquidity.
‍Better don't long $FONE untill you'll see at least few green candles in a row and increase in open interest. It can realy keep dropping to zero.
#FONE
post-image
FONE-23.48%
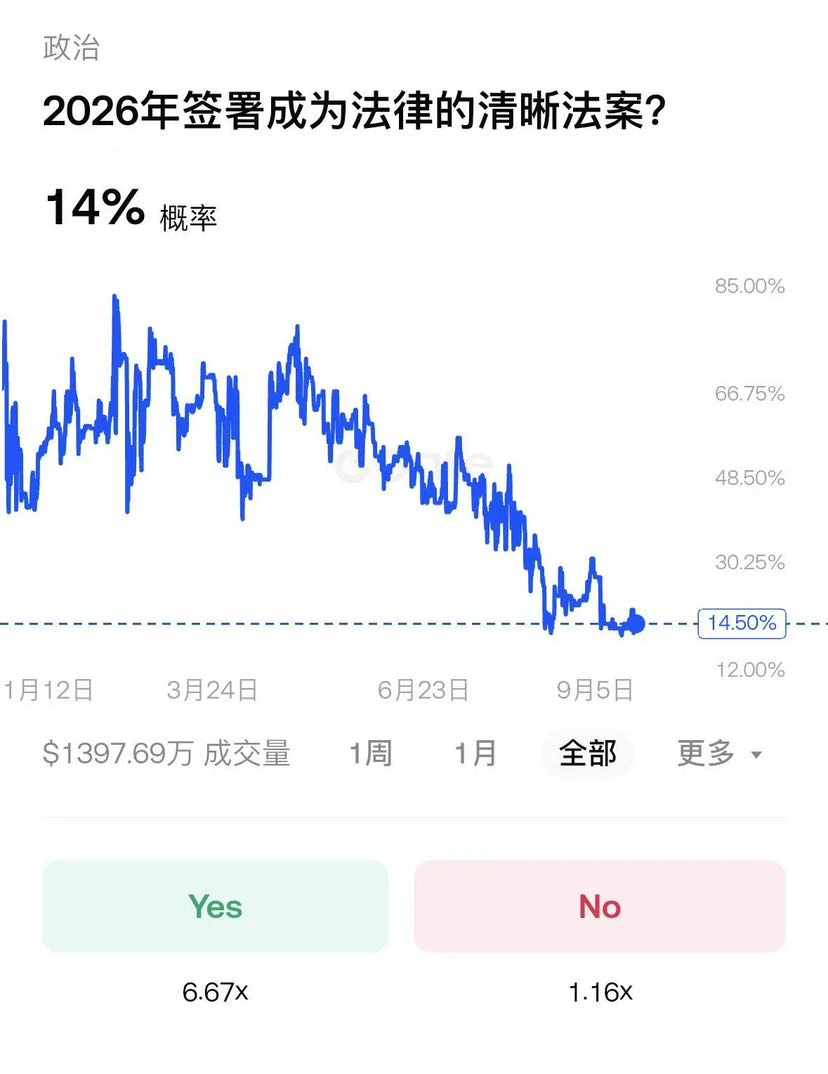
Expectations peaked early in the year before entering a sustained long-term downtrend; the probability has recently fallen further to a low of 14.5%, with market expectations that the bill will be enacted within the year continuing to cool.
post-image
$UAI was still at 0.51 an hour ago, but has now plunged straight back to 0.45, with $107 million in 24-hour trading volume. The volatility of this kind of meme coin is more intense than SOL’s entire week. Don’t stare at the candlestick chart asking why: the Fed’s hawkish March meeting minutes were released early today, sending the probability of a June rate cut from 73% down to 61%, while the 2-year U.S. Treasury yield surged to 4.8% and Nasdaq futures plunged. AI-sector coins were hit the hardest because these high-beta assets are the first to be drained of liquidity.
I ran a correlation bac
UAI+24.95%
SOL-1.61%
NAS100-0.37%
BTC-1.63%
USIDX+0.15%
Bitcoin’s next big test is TODAY
BTC is hovering near $76.5K–$77K after US strikes on Iran spiked oil past $94 and revived inflation fears. Now the US jobs report drops today — and it lands into a market already pricing ~60% odds of a September Fed rate hike.
A hot number = more hike pressure = more heat on crypto.
A weak one could flip the whole mood.
Two macro bombs in one week, and BTC’s still outperforming gold and stocks.
Are you positioning before the print or waiting for the dust to settle?
BTC-1.63%
Gate News followed According to ETFCheck, South Korea’s leading commodity-tracking platform, oil-linked ETFs posted the highest returns this week as geopolitical tensions escalated. KODEX WTI Crude Oil Futures (Hedged), managed by Samsung Asset Management, rose 9.93% over the past seven days, followed by TIGER Crude Oil Futures Enhanced (Hedged), which gained 9.62%. The surge in ETF returns reflected a sharp rise in international oil prices. On September 2, West Texas Intermediate crude rose to $91.01 per barrel, a weekly gain of 9%; meanwhile, the escalation of the U.S.-Iran military conflict
MU+5.89%
  • 1
US equities closed lower: Dow -0.51%, S&P -0.38%, Nasdaq -0.29%; TSLA -5.92%, AAPL -2.51%, MSFT -2.04%. AI chip names led gains (SNDK +11.9%, MU +6.1%, INTC +4.5%). $COIN and crypto names drifted lower.
post-image
DOW-3.04%
SPX-0.65%
TSLA-5.96%
AAPL-2.51%
MSFT-2.03%
  • 24
  • 1
The more sharply $PONS rises, the harder it falls—by ten times as much.
post-image
PONS-3.65%
Today’s update: yesterday, gold pulled a move and took me from 1,000U down to 200U. I then went all-in long and made back 700U. Not bad, I guess—neither profit nor loss overall, with futures down by over 100U.
post-image
PAXG-0.76%
XAU-0.81%
JUST IN: Anthropic near IPO with Morgan Stanley as left lead underwriter and Goldman Sachs as stabilization agent; NY listing expected end of Sep/early Oct. This could impact AI sector funding dynamics and sentiment around big tech listings. $AI
post-image
MS+0.25%
GS-0.03%
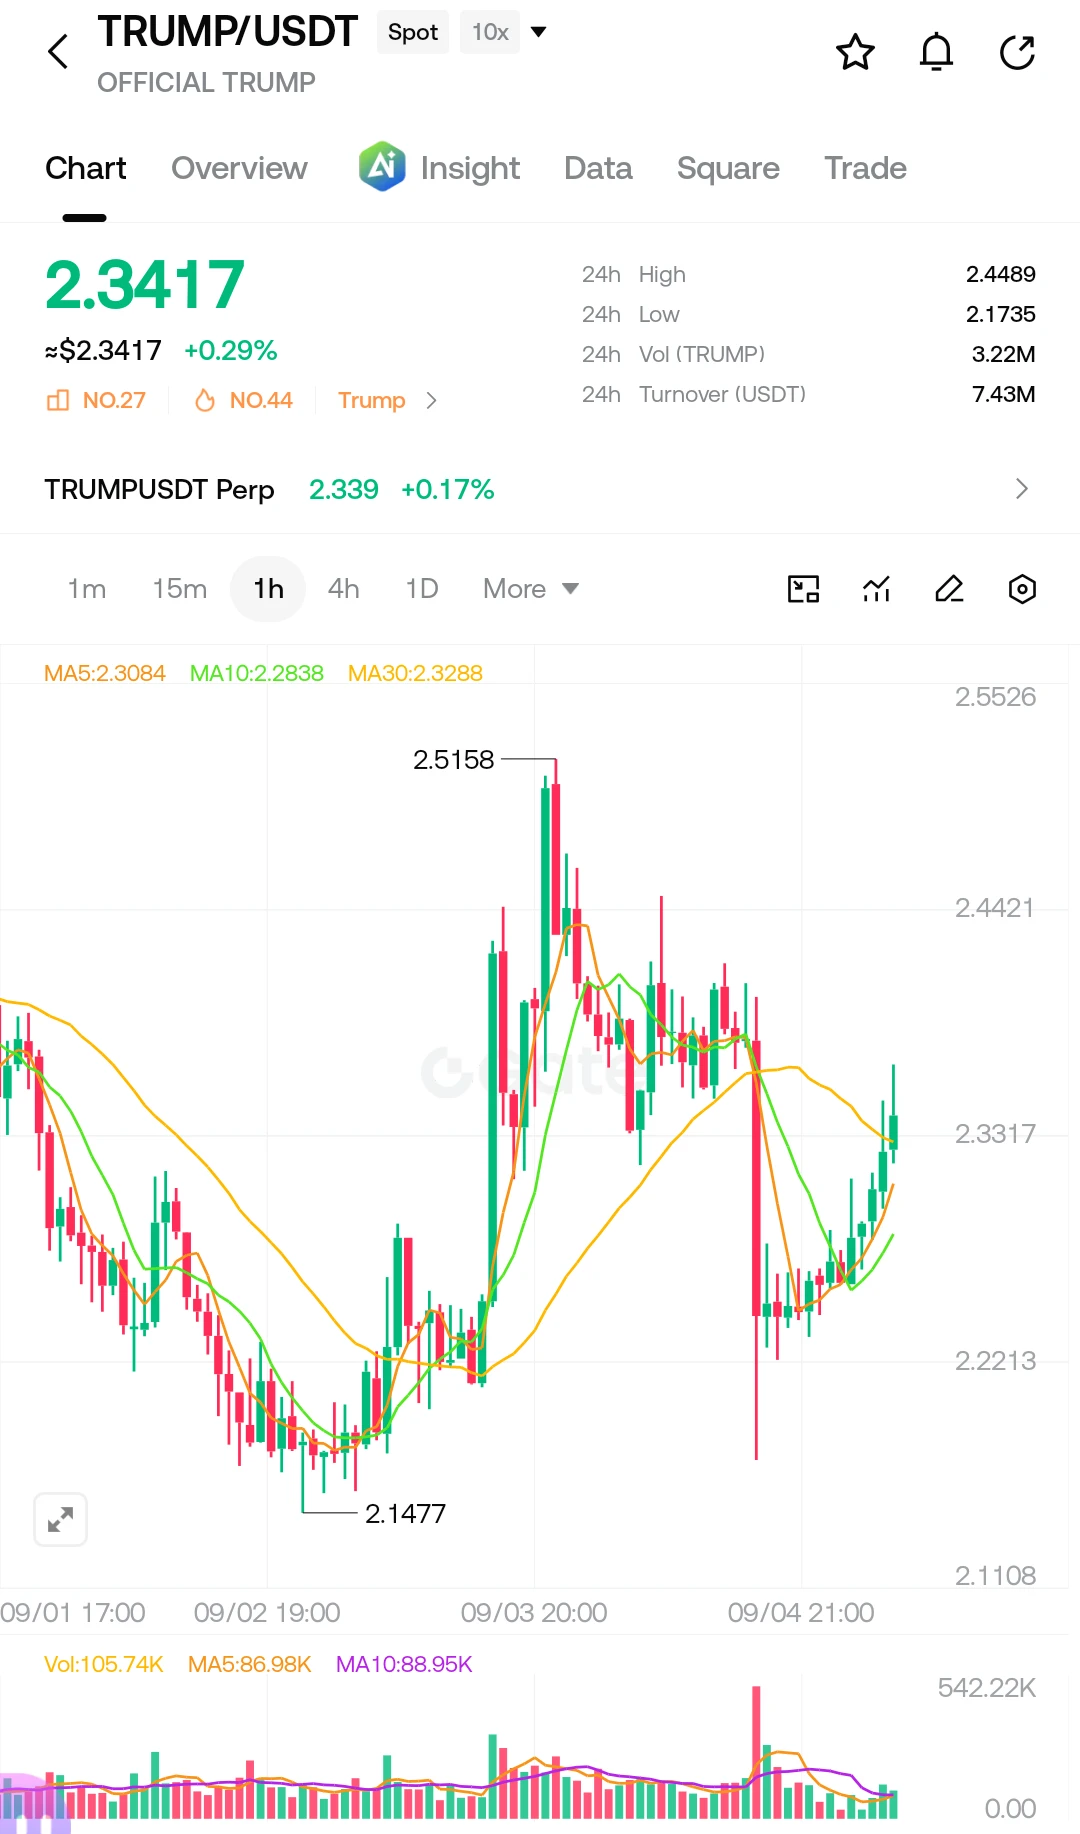
👀 I’m keeping $TRUMP /USDT on my radar here.
The chart looks like it’s trying to build momentum again after that sharp flush. Price has climbed back above the short-term moving averages, but I’m not chasing the move I want to see buyers prove they can hold the breakout area.
📍 Entry Zone: $2.30 – $2.34
🎯 TP1: $2.42
🎯 TP2: $2.50
🎯 TP3: $2.58
🛑 Stop Loss: $2.24
If $2.34 holds as support, the next push toward the previous resistance zone could get interesting. ⚡
My approach: patience on the entry, partial profits on the way up, and strict risk control if the setup breaks down.
⚠️ Disclaime
post-image
TRUMP-0.45%
Load More

Join 40 M users in our growing community

⚡️ Join 40 M users in the crypto craze discussion

💬 Engage with your favorite top creators

👍 See what interests you

View More