


Square
Following
Hot
News
Notifications
Profile
Share your thoughts
placeholder
Article
$SOL ‌ Potential for a continued decline following a minor rebound. Trend: Strongly bearish; selling pressure remains dominant. Support: 88.76 – 88.41. Resistance: 90.70 – 94.14. MACD: Negative; bearish momentum persists. Conclusion: SOL may retest the 88.76 level. If this support is breached, the decline could extend further. A stronger bullish signal would emerge only if the price manages to break back above 90.70.

Note: Crypto and stock transactions carry the risk of loss. Please conduct your own research (DYOR) before trading. This information is for general purposes only and does not co
post-image
SOL-0.74%
  • 3
$ATOM — Long entry price: 1.437; Take profit 1: 1.485; Take profit 2: 1.535; Stop loss: 1.305. ATOM has performed better than several other assets in this batch. If buyers hold the current area, advancing toward the intraday high would be a reasonable target.
post-image
ATOM+0.49%
Trenches
ZIG
Z
bade
b
ZIG
0x8c...1145
Market Cap
$.
Change
.
24h Vol
$.
Holders
.
BTC
B
bade
b
BTC
C5xp...pump
Market Cap
$.
Change
.
24h Vol
$.
Holders
.
HIGH
H
bade
b
HIGH
7ymF...high
Market Cap
$.
Change
.
24h Vol
$.
Holders
.
CORLA
C
bade
b
CORLA
0xba...7777
Market Cap
$.
Change
.
24h Vol
$.
Holders
.
STONK
S
bade
b
STONK
6GmA...UNgx
Market Cap
$.
Change
.
24h Vol
$.
Holders
.
#USNonfarmPayrolls US Nonfarm Payrolls: Key Economic Data in Focus

The US Nonfarm Payrolls (NFP) report is one of the most closely watched economic indicators, measuring the number of jobs added or lost across the US economy, excluding agricultural employment and certain other categories.

The October 2026 employment report is particularly important for investors because it could influence expectations about the Federal Reserve's next interest-rate decision. Traders will closely monitor job creation, unemployment and average hourly earnings to assess the strength of the US labor market.

A st
GT-2.41%
SOL-0.77%
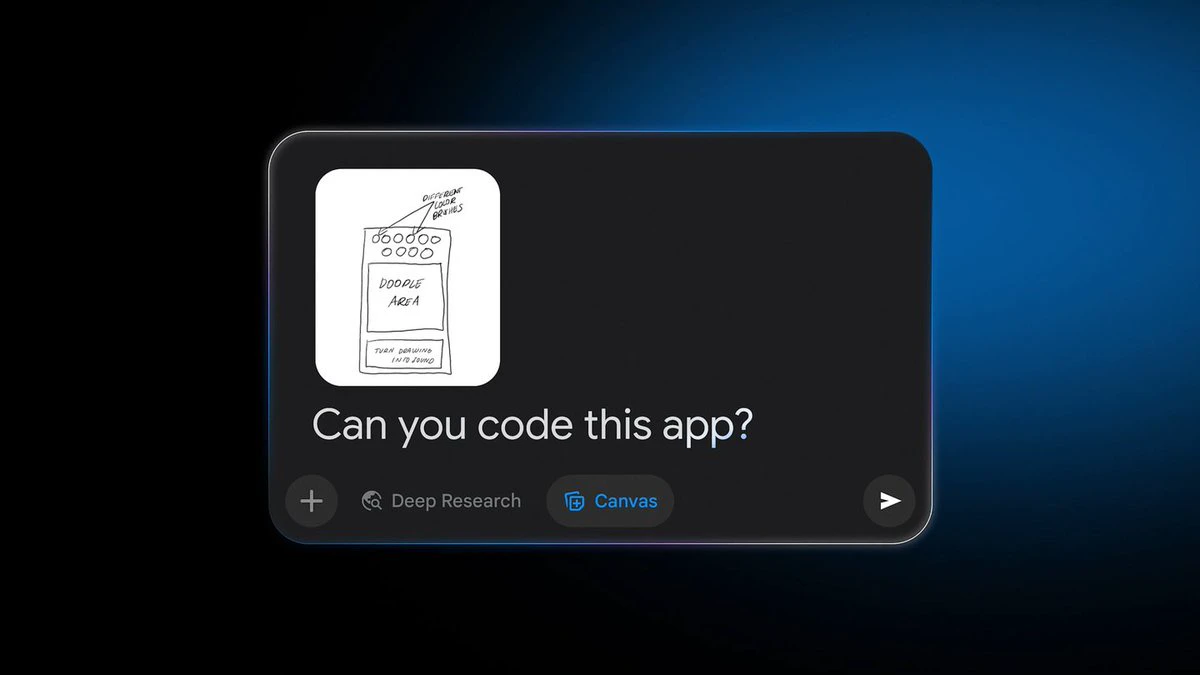
Google’s official blog headline says you can use Gemini to turn quick hand-drawn sketches into working apps or interactive tools.

The pitch is compelling, but the body only says it can turn good ideas on paper into interactive tools. It doesn’t explain code quality, debugging, deployment, or permission boundaries. At this stage, it seems more like a showcase of its ability to transform ideas than a promise that anyone can draw something and get a usable product.

$BTC
post-image
BTC-0.67%
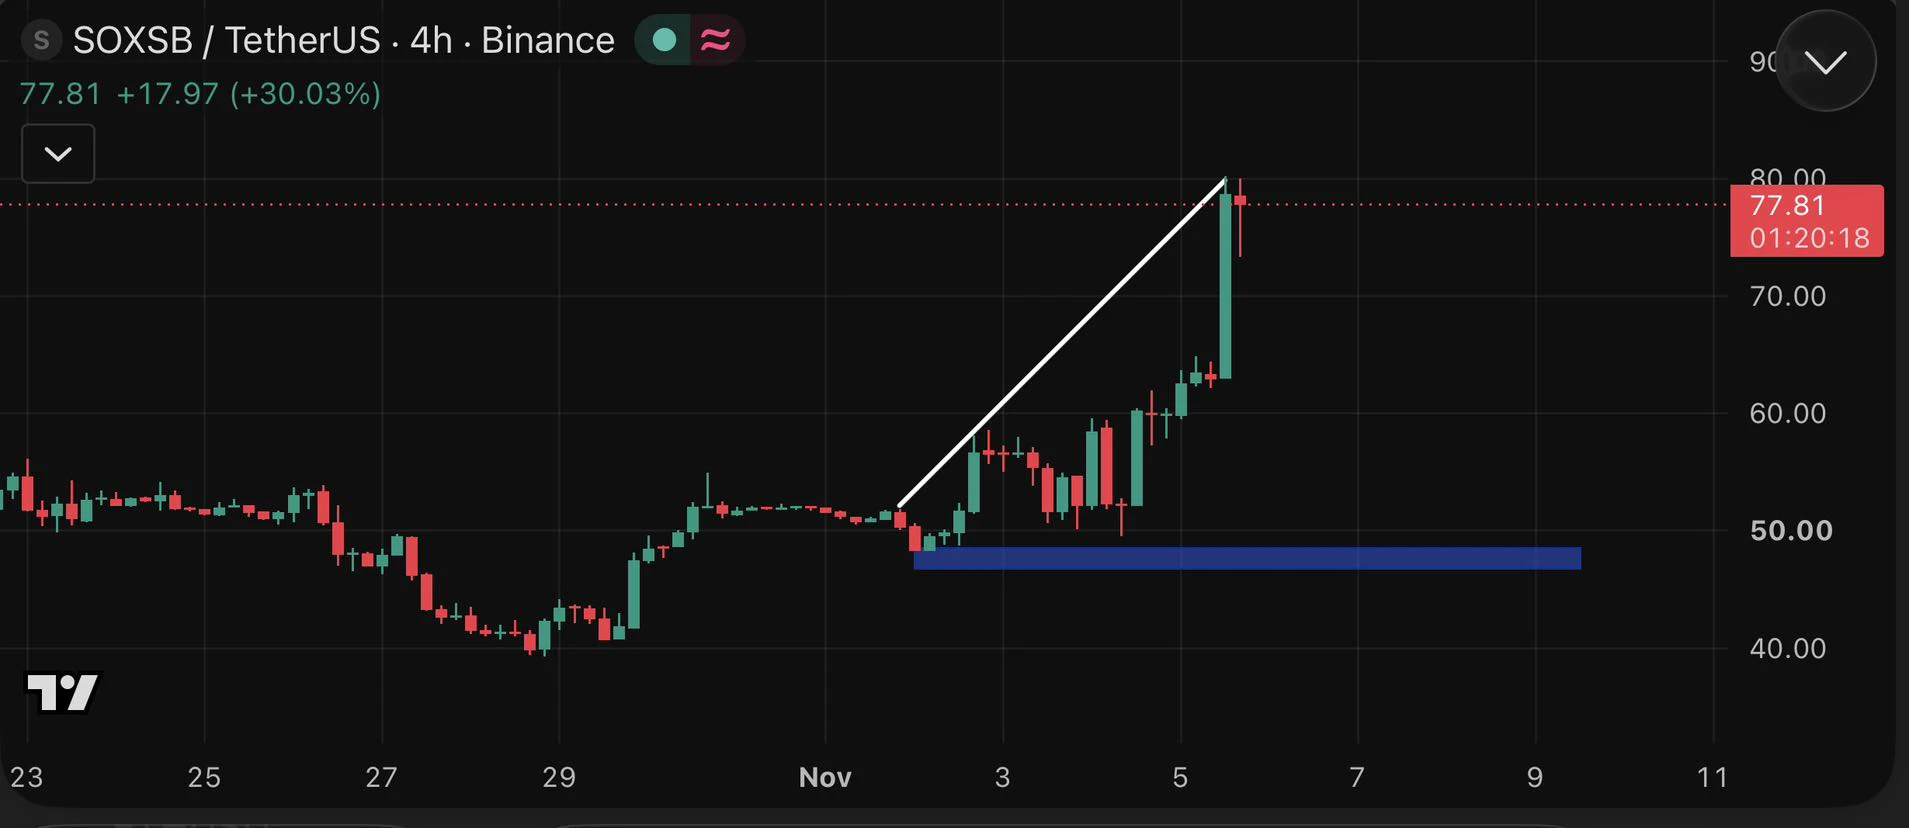
$SOXS is gaining attention after a strong 30% rally!

I’m watching the $70–$73 zone for a possible pullback and buying opportunity.

Targets: $80 | $85 | $90

If buyers defend support, another upward move could follow. Losing $70 may weaken the bullish setup.

I’m waiting for a clean entry instead of chasing the pump.

#SOXSB #Crypto #Trading
post-image
SOXS+1.46%
  • 3
  • 1
Democrats take both chambers, Jeffries officially goes after the speaker’s gavel, and Mississippi and Alaska are still counting—historians see it this way: whenever power changes hands, markets move on expectations first; once the dust settles, the trade is over. What do you think?
post-image
  • 10
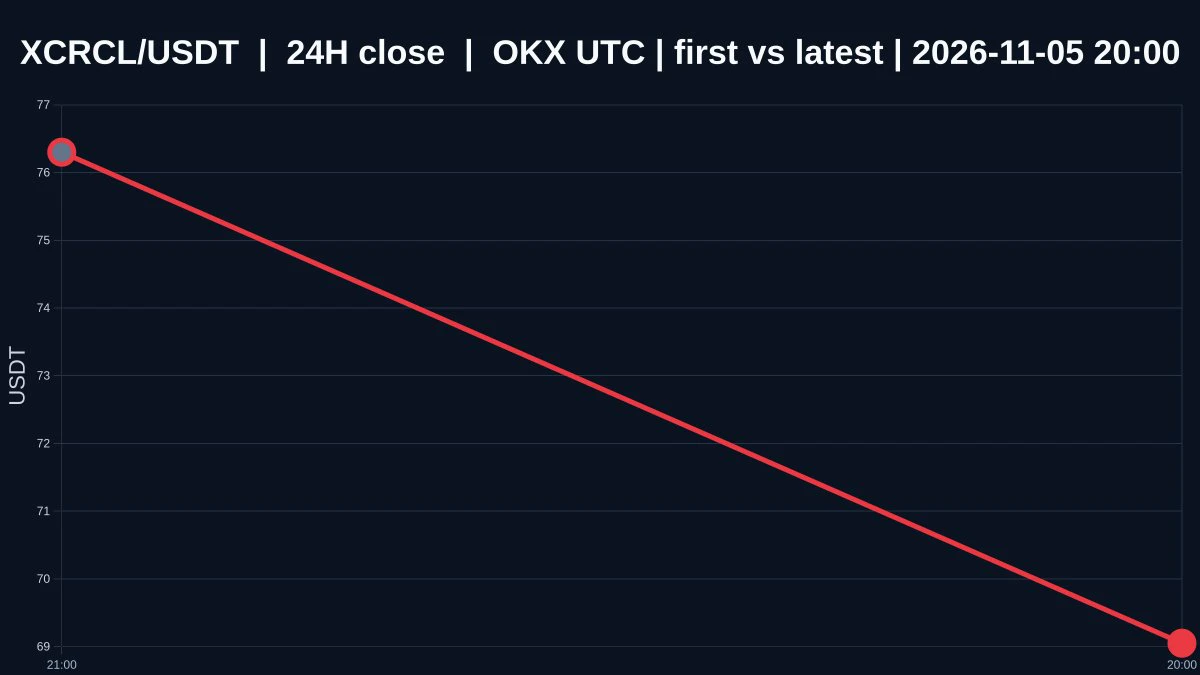
$XCRCL Falls to 69.15; Oversold Does Not Automatically Mean a Bottom Is In
$XCRCL is currently priced at 69.15, down 9.702272133716361% over 24 hours, with an intraday range of 65.34 to 77.33. The 1-hour and 4-hour trends are both weak, and the 1-hour volume ratio is 0.0006001285474826546. The price has fallen to this level, and short-term oversold conditions are building, but the structure has not stopped weakening. I would not equate oversold with a bottom.

Oversold describes a price that has fallen enough over a short period. A bottom describes selling pressure genuinely drying up and buye
post-image
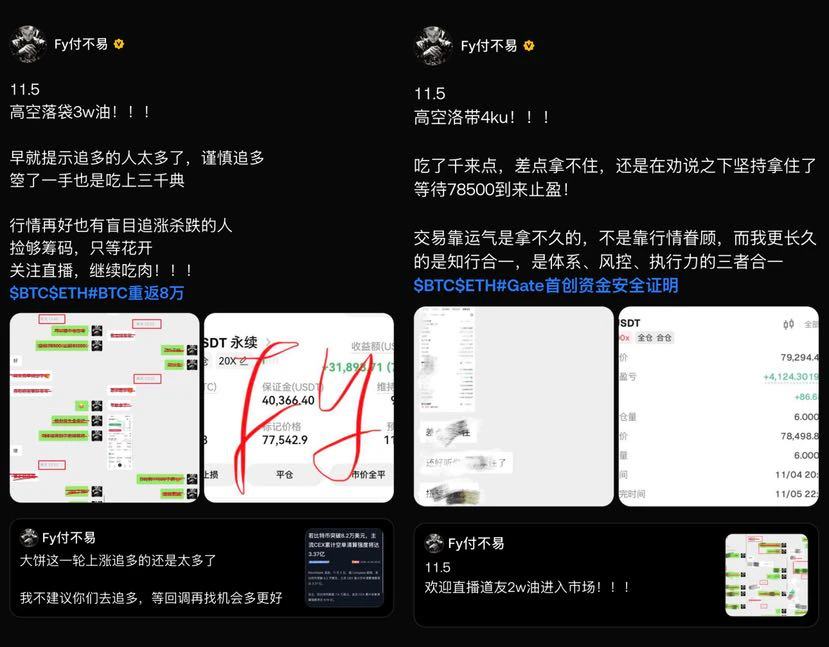
11.5
Having some noodles, then going to sleep, guys.
Back at it tomorrow!!!
Bitcoin is still trading sideways!
$BTC $ETH #BTC重返8万
post-image
FyPaymentMadeEasy
11.5
Today's recap
BTC short trade secured today; BTC is back at 76000
Yesterday it went from 76000 to 81000; after “drawing a door,” today it returned to yesterday’s price level

Another fellow Daoist has joined!!!
$BTC $ETH #BTC重返8万
repost-content-media
BTC-0.65%
ETH-1.23%
$GVZ ‌$XAU ‌
With the price of gold trading at $4,093, many investors in the market are focused solely on the charts, asking, "Is it heading up or down?" Yet, the true dynamic driving gold lies much deeper—hidden within the complex equation of the bond markets.

To view gold merely as a "safe haven" is to overlook the macroeconomic realities of 2026. Three fundamental factors are currently shaping gold: real yields, bond interest rates, and market volatility. Let’s break down this equation, step by step.

📉 The Pressure of Real Yields: Gold’s Invisible Chain

By its very nature, gold is an
GVZ+2.87%
XAU+0.38%
  • 9
  • 4
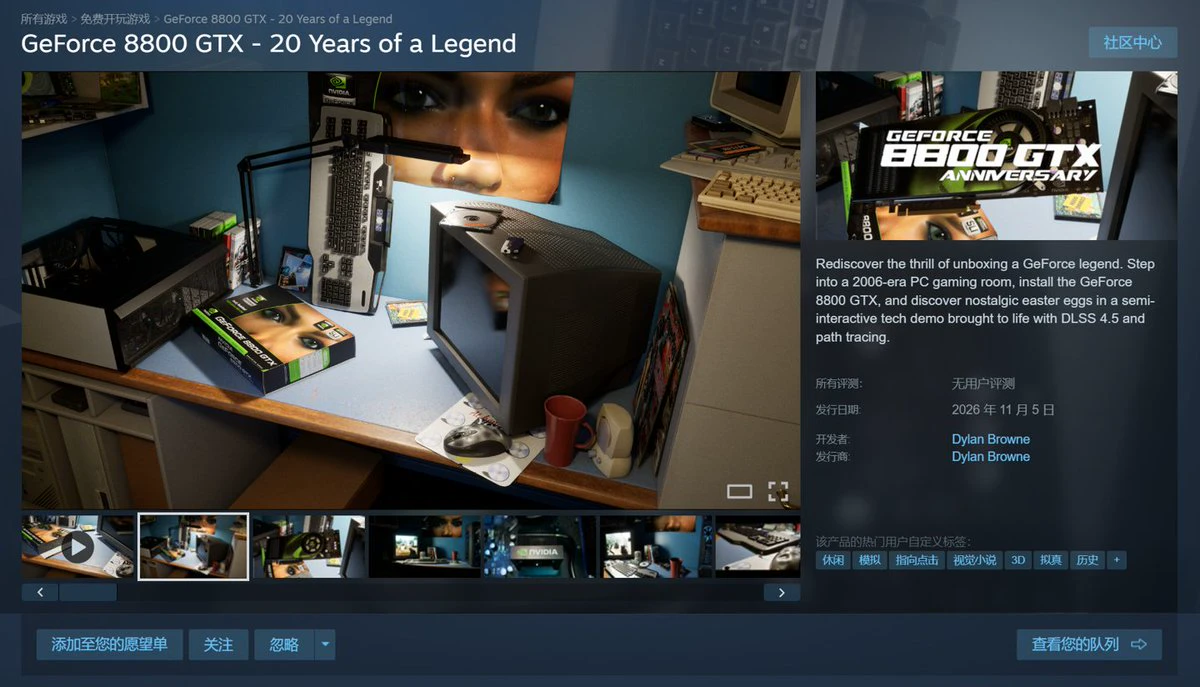
NVIDIA has released a Steam demo game created by Unreal Engine artist Dylan Browne, taking players back to a 2006 gaming room to unbox and install a GeForce 8800 GTX, which launched on November 8, 2006.

The contrast is striking: the flagship card of the time had just 768MB of GDDR3, 155W of power consumption, and PCIe 1.0, while the commemorative demo supports modern technologies such as path tracing and DLSS 4.5 Ray Reconstruction—wrapping nostalgia for the old card in a layer of modern ray tracing.
$BTC
post-image
NVDA-9.33%
BTC-0.67%
BREAKING 🚨Nvidia crashes, losing roughly $400 billion in a single day, its biggest drop since the DeepSeek crash. ⚡Shares slid 8% to $183, wiping out 2026 gains and sitting 23% below the October 6 record of $239.24. It ranks as the second‑largest one‑day loss after a 600 billion plunge on Jan 27 2025. Chipmakers fell as Democrats’ congressional sweep fuels AI‑regulation concerns. 🚀Stay tuned for updates.UVXYB , SOXSB , ARIA
post-image
NVDA-9.33%
DEEPSEEK-2.21%
ARIA+22.03%
Anything Anyone needs to Say on it….
Holy shit, holy shit, holy shit—three holy shits. BTC is giving another chance to get into spot; back near 75000, current price 76000. Get into spot in batches. ETH, 2230, got in at the current price. SOL, 90, got in at the current price. SPCX, 123, got in at the current price. The sky is falling, US stocks. $BTC
post-image
BTC-0.67%
ETH-1.26%
SOL-0.77%
SPCX+0.78%
Spatial Aggregation
live-cover
LIVE80
$CAP ‌ is building a strong bullish structure, and buyers are clearly back in control.

Price has climbed to $0.1071 after reclaiming the $0.09 area. The daily Supertrend remains bullish at $0.06086, while momentum is now bringing the previous high into focus.

Key levels to watch:

Support: $0.091–$0.089

Near-term resistance: $0.1129

Major resistance: $0.1219

Trend support: $0.0608

A clean break above $0.1129 could set up a retest of $0.1219. If buyers fail to hold $0.089, a deeper pullback becomes possible.

CAP is showing impressive relative strength. The next challenge is turning thi
CAP+8.34%
TSLA-10.84%
  • 2
  • 2
$BIRB Still faces strong resistance at 0.10. Price: 0.09606 Resistance: 0.098 – 0.10 Support: 0.091 – 0.087 BIRB rebounded strongly, but bulls still failed to break above the 0.10 resistance. As long as the 0.10 resistance holds, the price could still pull back to 0.091, or even 0.087. A decisive break above 0.10 could usher in a new rally. Still capped by resistance... Don't get trapped at the top $BIRB
post-image
BIRB-16.68%
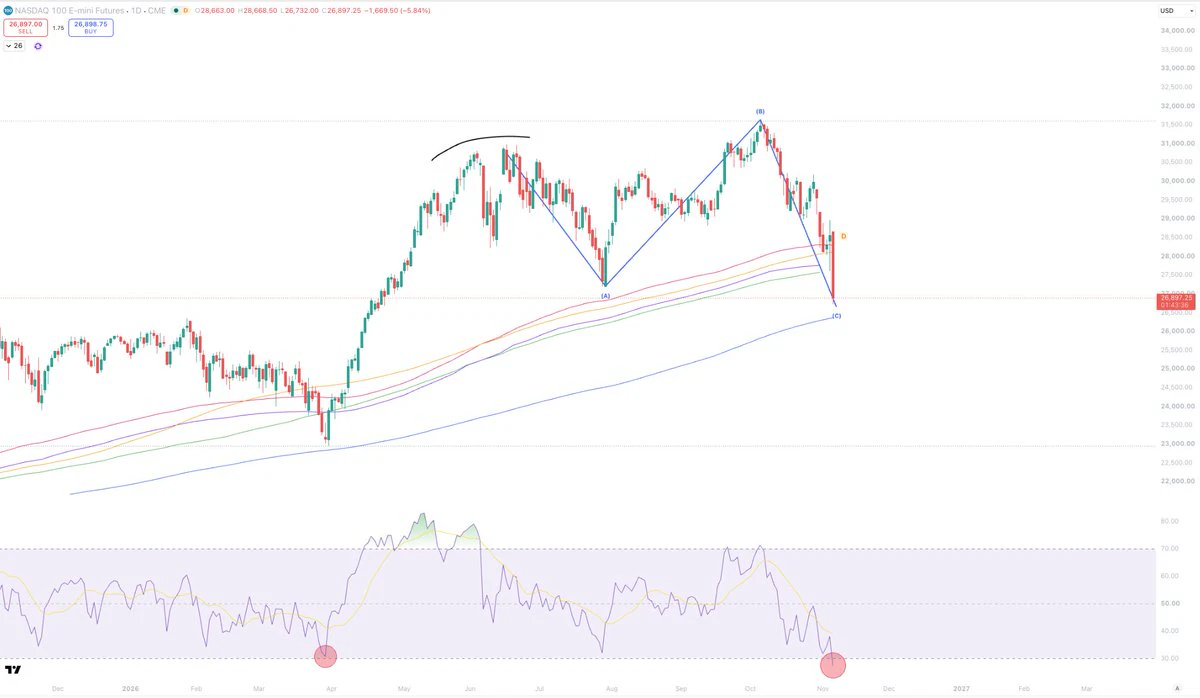
I think you could bid this Nasdaq nuke pretty comfortably.
Scary headlines out there but this looks like a pretty textbook expanded flat.
The VIX up 64% today which historically a buy signal.
And the lowest Daily RSI reading in 17 months.
These kinds of RSI readings are very uncommon in equities.
post-image
NDAQ-2.63%
Crypto investors often focus on the candlestick patterns on their screens. But have you ever considered the invisible hand that moves those candles?

Sometimes, the source of the biggest market movement isn't hidden in the Bitcoin chart or the news feed of an altcoin. The real scenario is often written in the shadow of macroeconomic labels. Right now, we're looking at one of those shadows: the Dollar Index (DXY).

The data on the chart is quite clear: the DXY is at 101.62 today, with a modest increase of 0.09%. However, this small green candle shouldn't mislead investor psychology. Because the
post-image
BTC-0.67%
ETH-1.26%
XAU+0.38%
XAG+0.47%
NAS100-7.14%
  • 9
Load More

Join 40 M users in our growing community

⚡️ Join 40 M users in the crypto craze discussion

💬 Engage with your favorite top creators

👍 See what interests you

Trending Topics

GateLaunchesPoSECProofOfSecurity

8.29k Views546 Discussing

Beyond Proof of Reserves, Gate has introduced PoSEC, a new Proof of Security framework focused on how user assets are stored and protected. By disclosing the distribution of assets across cold storage and hot wallets, users can directly understand Gate’s storage structure and risk coverage under extreme scenarios. Gate’s latest cold storage coverage ratio stands at 104.58%, meaning cold-storage assets alone are sufficient to cover all user assets. PoR verifies whether reserves are sufficient, while PoSEC shows how assets are stored and how risks are covered — together forming a more complete asset security framework. Share your results and experience! [👉 Learn more](https://gate.com/proof-of-security)

BTCBackAbove80K

132.11k Views41.58k Discussing

DemocratsWinBothChambers

29.06k Views535 Discussing

View More