Square
Following
Hot
News
Notifications
Profile
Share your thoughts
placeholder
Article
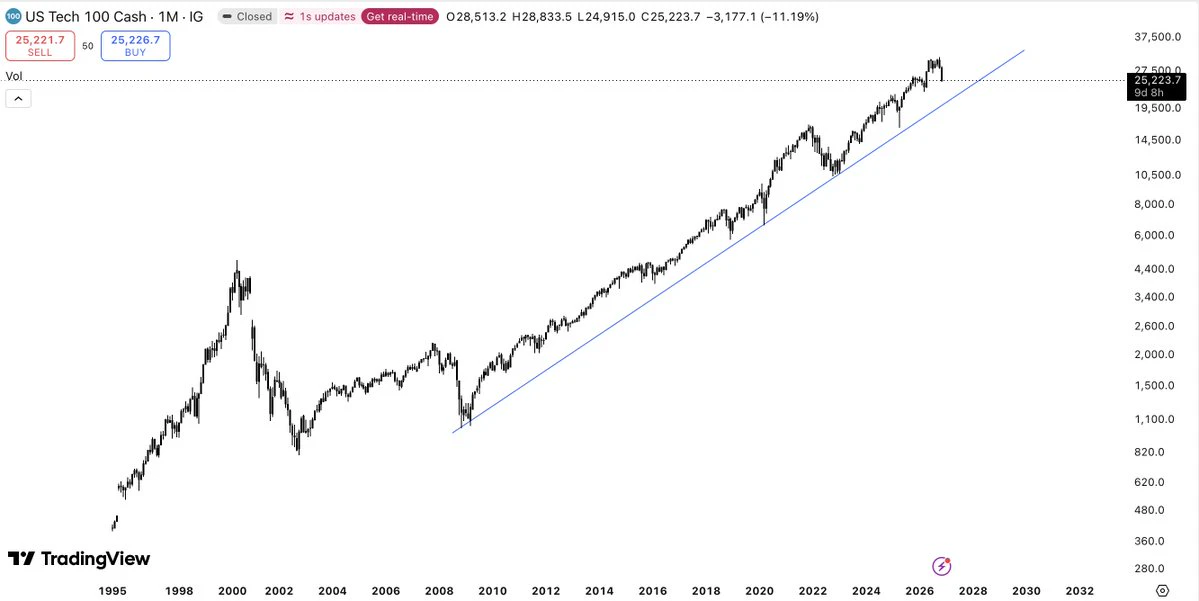
NASDAQ looks like this and the timeline is acting like the world is ending.
we could drop another 20% from here and the multi-decade uptrend would still be fully intact.
if anything, this is a great buying opportunity for anyone with a long time horizon.
just chill ffs.
post-image
NDAQ-0.95%
#GateDirectIPOPhase3ANTAllocates92100Shares #ShareWeekly

ANT After the IPO: $200 Billion in Unlocked Liquidity, Massive Share Supply, and What Comes Next?

The end of the $ANT IPO trading period marks the beginning of a much more complicated phase for the market. While the listing attracted enormous attention and generated significant trading activity, the more important question now is not simply how high or low ANT can trade. It is how much liquidity has been released, how much additional supply is approaching, and whether institutional demand can absorb the selling pressure over the comin
post-image
ANT-8.68%
MSCI-2.28%
CRSP+0.82%
MORN-0.38%
NAS100-0.07%
Trenches
PIEVERSE
P
bade
b
PIEVERSE
0x0e...25a9
Market Cap
$.
Change
.
24h Vol
$.
Holders
.
FIONA
F
bade
b
FIONA
B34n...pump
Market Cap
$.
Change
.
24h Vol
$.
Holders
.
IDOL
I
bade
b
IDOL
0x3b...ab07
Market Cap
$.
Change
.
24h Vol
$.
Holders
.
Singularity
S
bade
b
Singularity
7R4M...pump
Market Cap
$.
Change
.
24h Vol
$.
Holders
.
CLAUDIA
C
bade
b
CLAUDIA
2j5S...W2ZM
Market Cap
$.
Change
.
24h Vol
$.
Holders
.
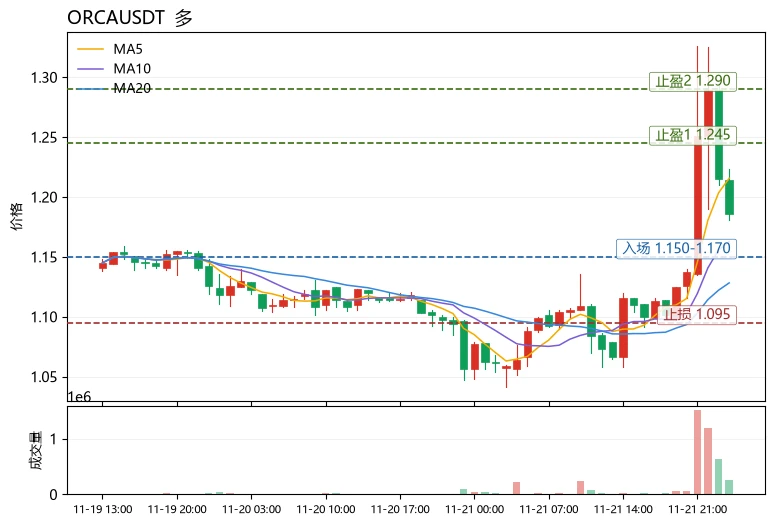
$ORCA Current price 1.184, 24h +11.17%, trading volume 5.5M USDT. MA5=1.2156 remains above MA20=1.1282, so the medium-term structure is intact, but the price has fallen below MA5, entering a short-term moving-average retest confirmation phase; the MACD histogram at +0.01431 remains bullish, with momentum still present but the histogram may contract; RSI at 57.6 is in the neutral-to-strong zone and has not reached overbought levels, leaving pullback room manageable; the upper Bollinger Band at 1.24503 is the main resistance, while the middle band provides dynamic support. The funding rate of -
post-image
ORCA-5.19%
HYPE+0.24%
PENGU+0.40%
Look at this: The AI bubble “bursts” once every year, because:
1. U.S. investors are so used to “asset-light” businesses that they really can’t stand needing capex to make money
2. 99% of people who trade stocks don’t use it, so they can’t experience it firsthand
3. They’re used to looking at SaaS and expect steady monthly growth. They don’t understand that AI revenue is stepwise and pulse-driven. When it grows 60% in a month, they dream it can keep going for a long time; when it grows 10%, they say demand has hit a bottleneck
There’s no denying that recent liquidity shortages and panic over c
WMT+1.54%
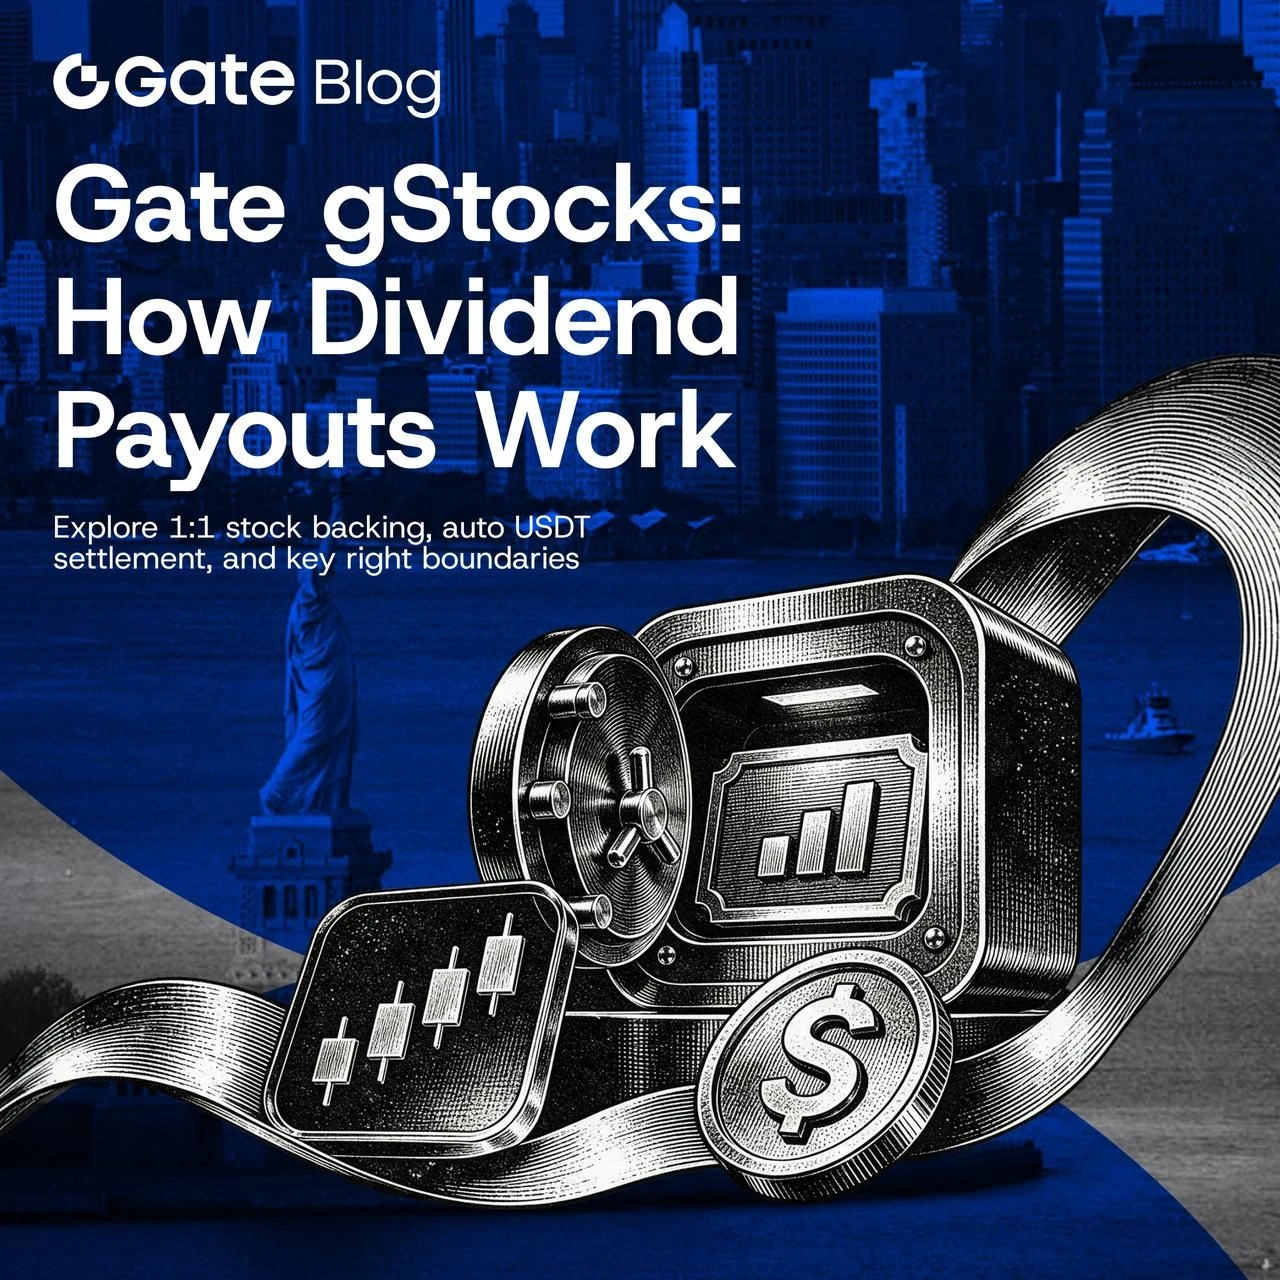
gate gstocks automatically credits eligible stock dividends in usdt, after a 10% withholding tax, with no manual claims required.

\#GSTOCKS #DIVIDENDS
$GATE
post-image
IN-6.89%
#黄金逼近3500美元关口 Gold is falling alongside stocks this time because cash is scarce, rate expectations are tightening, and safe-haven demand has temporarily taken a back seat. $3,500 is the most important level to watch right now, but it is more a test of whether prices can stop falling than a firm support level. A real reversal will likely have to wait until rate-hike expectations ease.

Why safe-haven demand has temporarily failed
· Rate-hike expectations are weighing on gold: The market has priced in about a 96% probability of a 25-basis-point rate hike in December. The real yield on U.S. Treas
post-image
XAU+0.38%
ANT-8.68%
$MSTRB Diverges Between the Short and Longer Term—Which Will Change First?
$MSTRB The current price of $MSTRBUSDT is 80.22, down 1.775% over the past 24 hours, with an intraday range of 72.36 to 82.52. The 1-hour chart is showing strength, with the price above the EMA20 (79.1409). The RSI14 is 55.99, in neutral-to-bullish territory, and the volume ratio is 1.96, indicating signs of active buying support in the short term. The 4-hour chart remains weak, with the price still below the EMA20 (84.9559). The RSI14 is only 20.47; while not deeply oversold, momentum is lacking, and resistance is far
post-image
London Solana Breakpoint ‘26
- Sent from my digicam
SOL-0.77%
I shorted $ENA $ENA, but was stopped out. The trade didn't develop as planned. BTC rose 3.64%, while ENA's maximum move was only 0.83%, falling short of the 1.86% required for TP1. Check BTC's movement before trading altcoins in the same direction. Details: - The 0.095232–0.095726 range was filled exactly at the limit order price - The maximum favorable move was 0.83%, falling short of the 1.86% required for TP1 - SL at 0.098442 was hit about 1 hour and 15 minutes after entry - The stop loss was triggered by a wick, and the candle closed back inside the range - BTC's gain during this period: +3
post-image
ENA+8.04%
[NEW STREAMER]market update
live-cover
LIVE2,332
BTC-0.67%
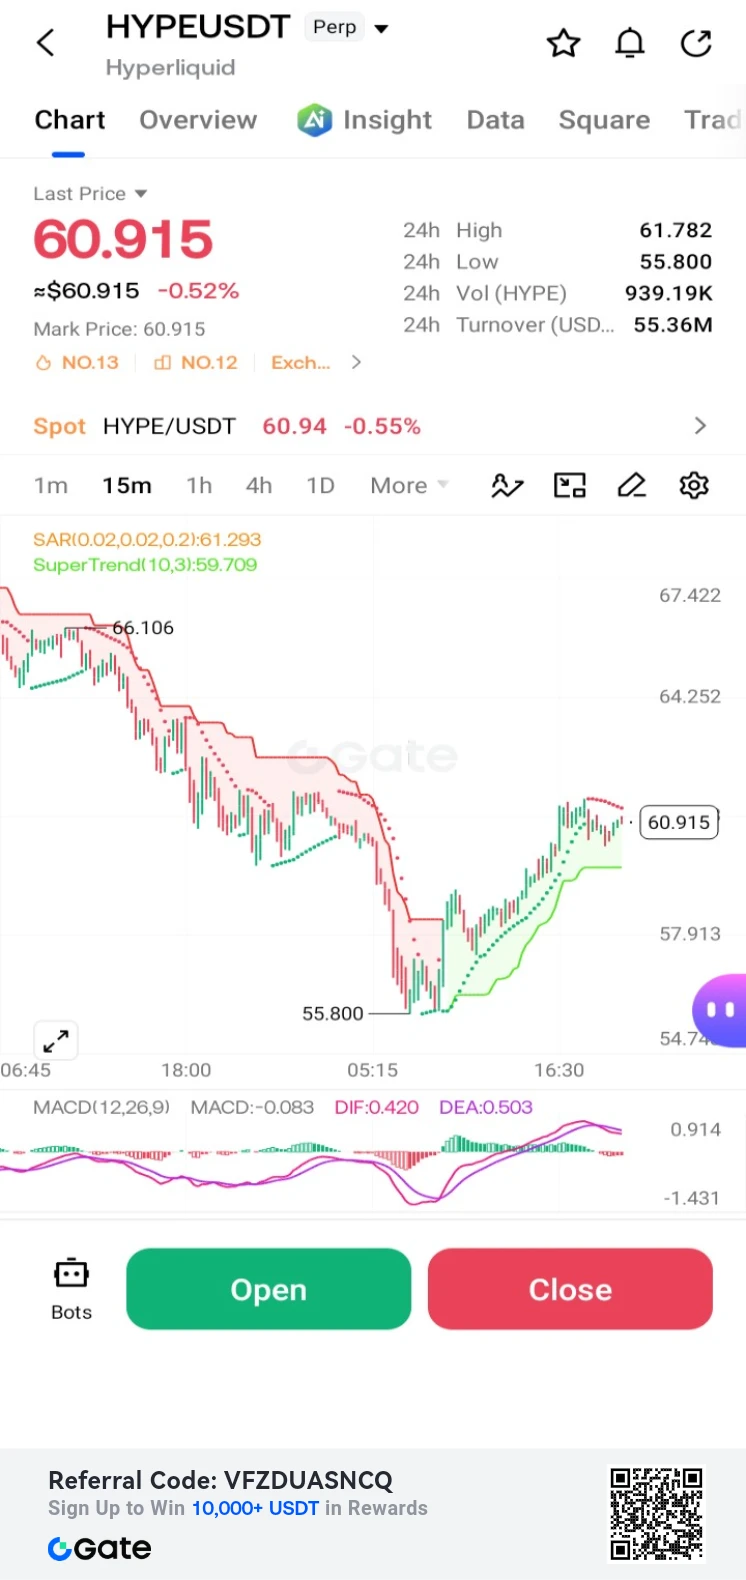
$HYPE /USDT Perp – "Uptrend Recovery – Long"**
Trading Plan Long $HYPE
Entry: 60.915
SL: 59.709
TP1: 61.782
TP2: 64.252
HYPE is down -0.52% but staging a steady recovery from the 55.800 low. MACD is bullish; targeting a retest of the 61.782 local high.
post-image
HYPE+0.33%
The extent of ETF redemptions determines how low $ETH ’s bottom will go—and that’s now playing out.

In the past, spot ETH ETFs saw net outflows on most trading days. Institutional redemptions accelerated noticeably in November, reaching 131 million in a single day on Thursday. Although the on-chain staking queue is long, it still cannot stop spot selling pressure. Combined with macro risk aversion and a breakdown in the broader market, ETH fell about 20% in a month. Yesterday, the Ether reference index plunged 10.5% in a single day, and the rebound in retail demand still couldn’t fill the ins
ETH-1.23%
AKE+6.39%
  • 1
If $NVDA keeps dropping….
post-image
NVDA-13.84%
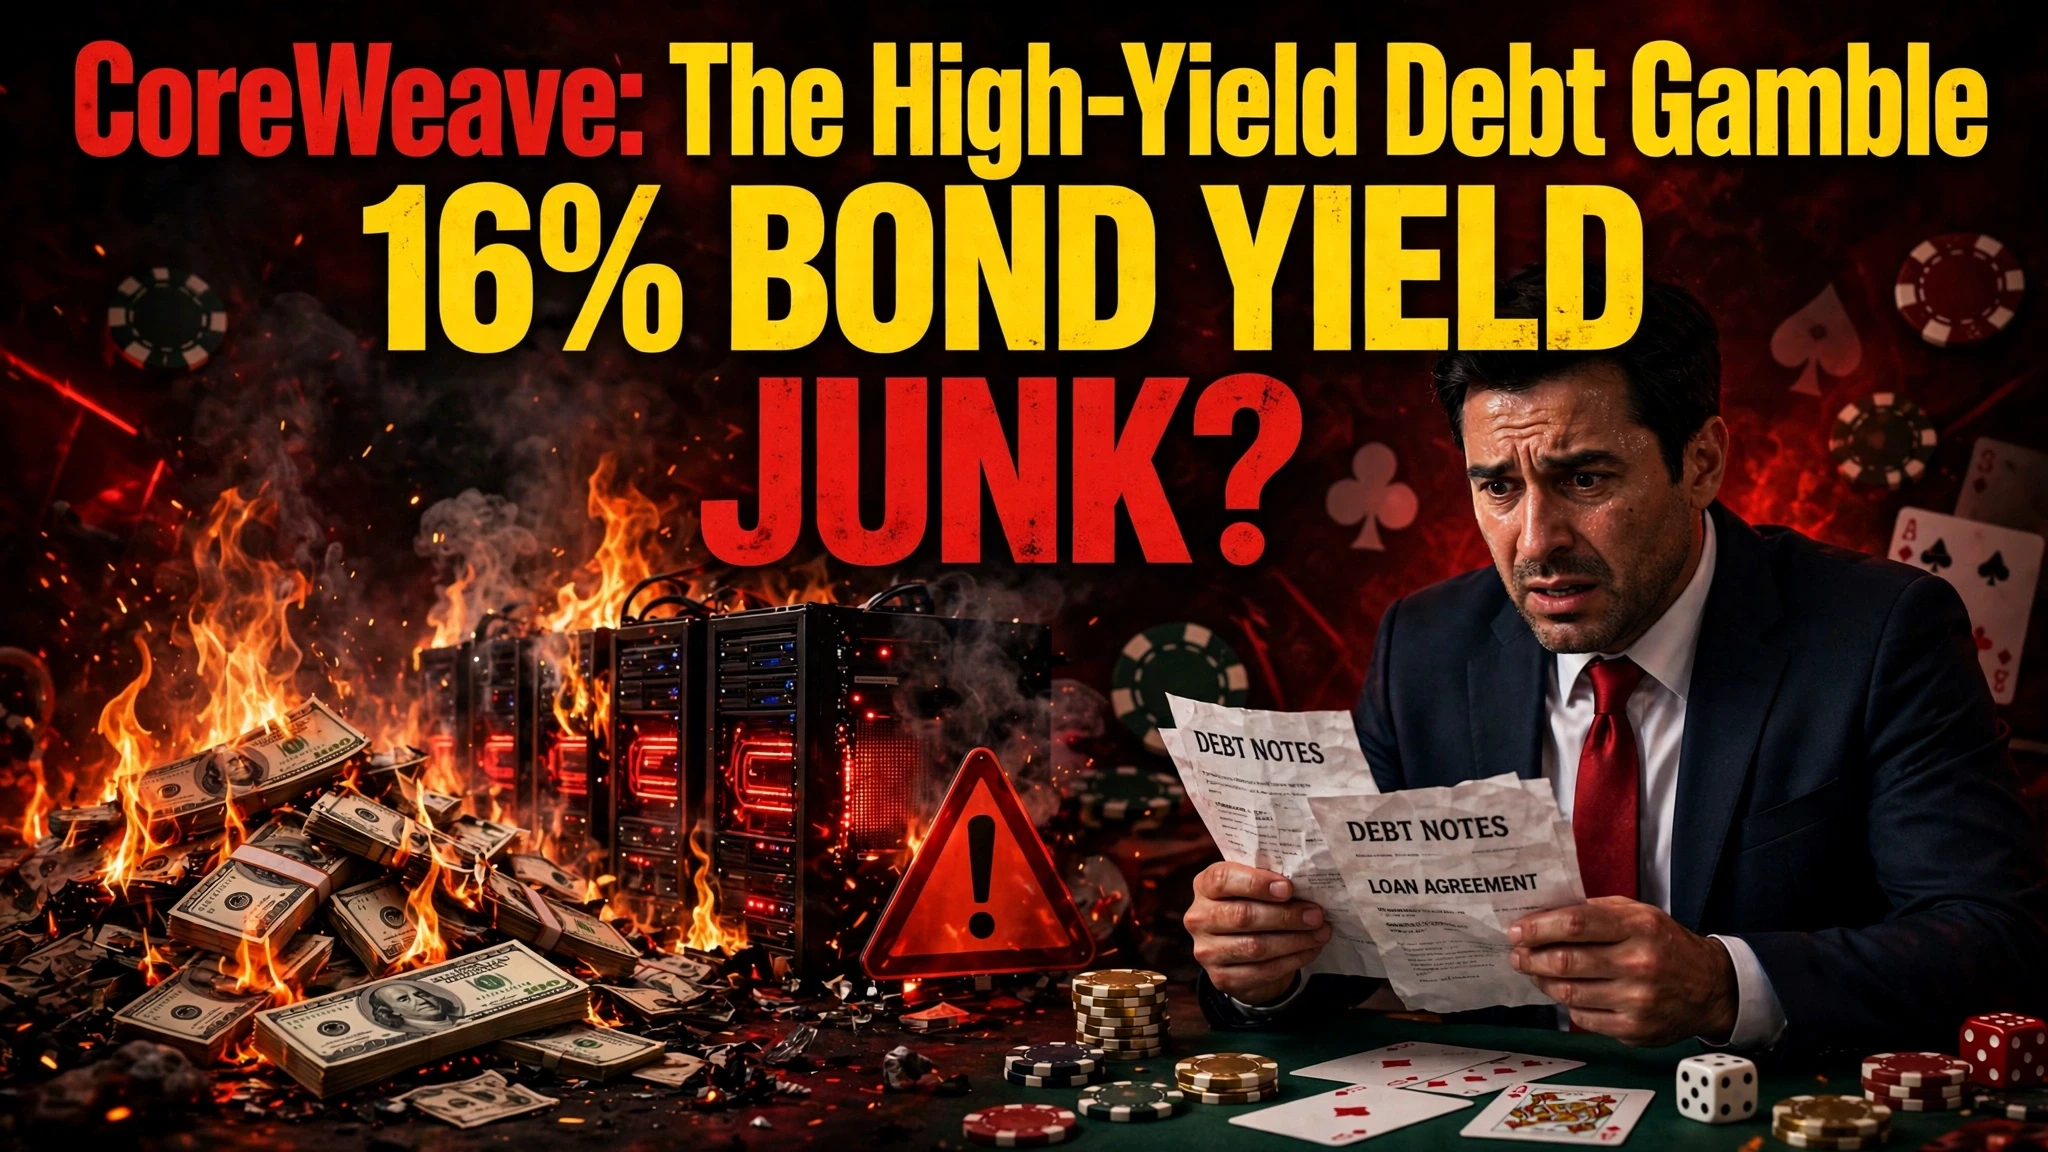
CoreWeave: The High-Yield Debt Gamble
CoreWeave bond yields approach 16%, prompting its co-founders to buy corporate debt.
This is a massive red flag wrapped in a high-risk opportunity. CoreWeave is a major player in the AI cloud computing space, but a 16% bond yield indicates that the market views the company's debt as highly speculative or "junk" status. Investors are demanding a massive premium to lend money to CoreWeave due to concerns about its capital-intensive business model, high debt load, and the volatile nature of the AI hardware market.

The fact that the co-founders are buying th
post-image
CRWV-12.10%
Corporate AI Budgets Face New Tests From Higher Financing Costs
live-cover
LIVE1,114
MU-13.88%
NVDA-13.84%
AAPL-1.83%
SPCX-7.38%
AMD-13.27%
Price and EMA20 are showing positive divergence, but the current volume ratio is low; although ATR% is slightly high, MACD remains bullish. $LTC — Long entry price: 40.07 Take-profit 1: 40.47 Take-profit 2: 40.87 Stop-loss: 38.47
post-image
LTC-0.07%
🚀 $PIEVERSE Bullish strategy – bulls regain momentum after the pullback… Long entry: 3.300 – 3.350 Take-profit 1: 3.400 Take-profit 2: 3.500 Final take-profit 3: 4.000 Stop-loss: 2.90 Leverage: 10x – 20x Margin: 1% – 3% Risk warning: If take-profit 1 is reached, take partial profits and move the stop-loss to the entry price to protect your principal. Trade here on $PIEVERSE … 👇
post-image
PIEVERSE+0.58%
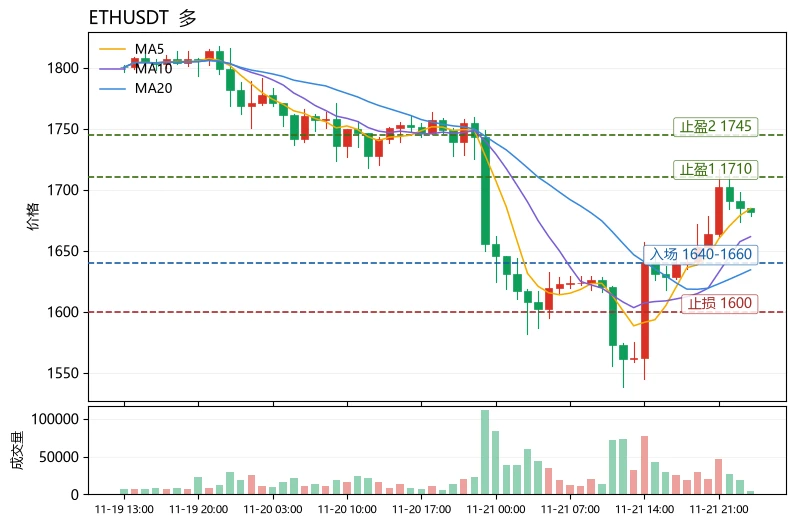
The Fear and Greed Index is only 12, yet the market is sending a contrarian signal: $ETH is up 2.37% against the trend in 24 hours, with the current price at 1681.64. Its resilience amid extreme fear is the most unusual detail today. The moving-average structure shows MA5=1684.51 above MA20=1634.28, the MACD histogram remains bullish at +13.1, and RSI at 55.8 is neutral to strong, indicating that selling pressure has been absorbed; however, the funding rate of +0.0030% shows that longs are slightly crowded, so caution is warranted when chasing the price higher. BTC's stabilization continues t
post-image
MMT-2.35%
BNB-0.76%
$ETH If you can't get filled at an average price of 1,550.45, you can't chase it. Being able to place an order in the lowest zone at the tail end of a decline means the bet at the time was that "it couldn't fall any further," not that "it was starting to rise."

There was only one basis: after a sharp drop, the price failed to make a new low for the first time, and the rebound recovered half of the previous candle's body. At that moment, the bulls hadn't grown stronger; the bears had simply run out of steam.

The $135 move from 1,550.45 to 1,685.65 was fueled entirely by short covering, not by
ETH-1.23%
BTC-0.65%
SNDK-0.18%
After tightening the last screw, Lao Zhao at the repair shop wiped his hands with a rag and said the car had been sitting for a week without being driven, but the battery had still gone weak. $DODOX It’s up 20.34% today, with 117.6M in trading volume—a substantial amount under normal circumstances. The strange thing is that the price surged to 0.0437 and then fell back to 0.0390, while volume didn’t follow the price and hold at the highs. Money came in, but it didn’t all stay up there. There are three possibilities: first, someone used the rally to rotate positions, selling old holdings into t
  • 2
  • 3
Load More

Join 40 M users in our growing community

⚡️ Join 40 M users in the crypto craze discussion

💬 Engage with your favorite top creators

👍 See what interests you

Trending Topics

BTCBreaksBelow60K

2.1M Views29.9K Discussing

BTC fell below $60,000 on November 20 for the first time since July, alongside a tech stock selloff and broader pressure on risk assets. Will $60K become resistance, or can BTC quickly reclaim it? What price or volume signals would convince you that selling pressure is easing?

GateDirectIPOPhase3ANTAllocates92100Shares

779.2K Views4.9K Discussing

NvidiaDropsNearly14Percent

326.7K Views7.6K Discussing

View More