Share your thoughts
placeholder
Article
Everyone’s watching gold, but $XAG /USDT just flashed a sell signal that nobody’s tweeting about yet.

$XAG /USDT - SHORT

Trade Plan:
Entry: 66.26 – 66.32
SL: 66.62
TP1: 66.04
TP2: 65.88
TP3: 65.63

Why this setup?
Why now? The 4h frame is whispering SHORT at 66.29 with only 55% conviction—this isn’t a slam dunk, it’s a scalp.
- RSI on the 15m is overheated at 64.45, meaning the last push up is losing steam.
- ATR (1h) is tight at 0.1377, so moves are compressed—breakouts will be violent.
- Price is stuck in a 1D range, but our targets drip lower: TP1 at 66.04, TP2 at 65.88, TP3 at 6
XAG+0.56%
#Gate60MillionUsers
My first Gate trade still makes me laugh 😂
I remember staring at the chart like I had everything figured out. I saw a move, got excited, and entered without giving much thought to risk.
For a few minutes, everything looked perfect.
Then the market moved against me.
I kept staring at the screen thinking, “It’ll come back.”
Spoiler: it didn’t. 😂
That tiny trade taught me something I still remember today: the market doesn’t care how confident you feel.
Looking back, losing that trade wasn’t the worst part. The funny part was how seriously I thought I knew what I was doing.
post-image
GN to those who GN💤
post-image
I originally just planned to test the waters with a small position, but it nearly fell short? No, it delivered a big move instead! During the repeated intraday swings, I watched the order book for a long while. Every dip held its level, while the volume-price action grew healthier and healthier. My instincts told me this move had potential. I went with the pullback during the day and entered at 0.08454. When I opened the app again after lunch, it had already reached 0.08915, pushing the return to +507.25%. My account was dancing on its own—I was worried it might fall.

Profits, plain and clea
post-image
ZEC+2.18%
SOL+2.57%
4 figures at 27
Alhamdulilah 🙏
post-image
Everyone’s long gold at 4439—but the 4h tape just whispered a secret that breaks the bull narrative.

XAU/USDT - SHORT

Trade Plan:
Entry: 4437.22 – 4440.94
SL: 4456.97
TP1: 4425.66
TP2: 4416.72
TP3: 4403.30

Why this setup?
Why now?
- 1D is *range*, not trend—so shorts aren’t fighting momentum, they’re fading a dead cat bounce.
- RSI 15m at 65.63 = overheated micro-pump into resistance (4439.08).
- TP1 4425.66 → TP3 4403.30 is a clean 80‑pip drop if 4440 fails.
- Invalidation at 4470.01 keeps risk tight. This is a statistical fade, not a gamble.

Debate:
Will 4440.94 reject this p
XAU+0.35%
Once this shot is fired, there will still be opportunities later—don't rush.

$XRP $ZEC
post-image
XRP+2.01%
ZEC+2.18%
#Gate事件合约晒单挑战
PONS IS MAKING NOISE
Pons is suddenly one of the most watched launchpad stories on Robinhood Chain. The latest GateNews data shows Pons generated $1.84M in 24-hour revenue, surpassing Pump.fun’s $1.18M. That is a major signal because revenue reflects actual activity flowing through the platform rather than price movement alone.
THE NUMBERS MATTER
Pons generated roughly $660K more revenue than Pump.fun during the reported 24-hour period, meaning Pons was ahead by about 56% on that comparison. This puts the focus directly on activity, users and transaction flow around Robinhood Ch
post-image
PONS+28.01%
PUMP-4.80%
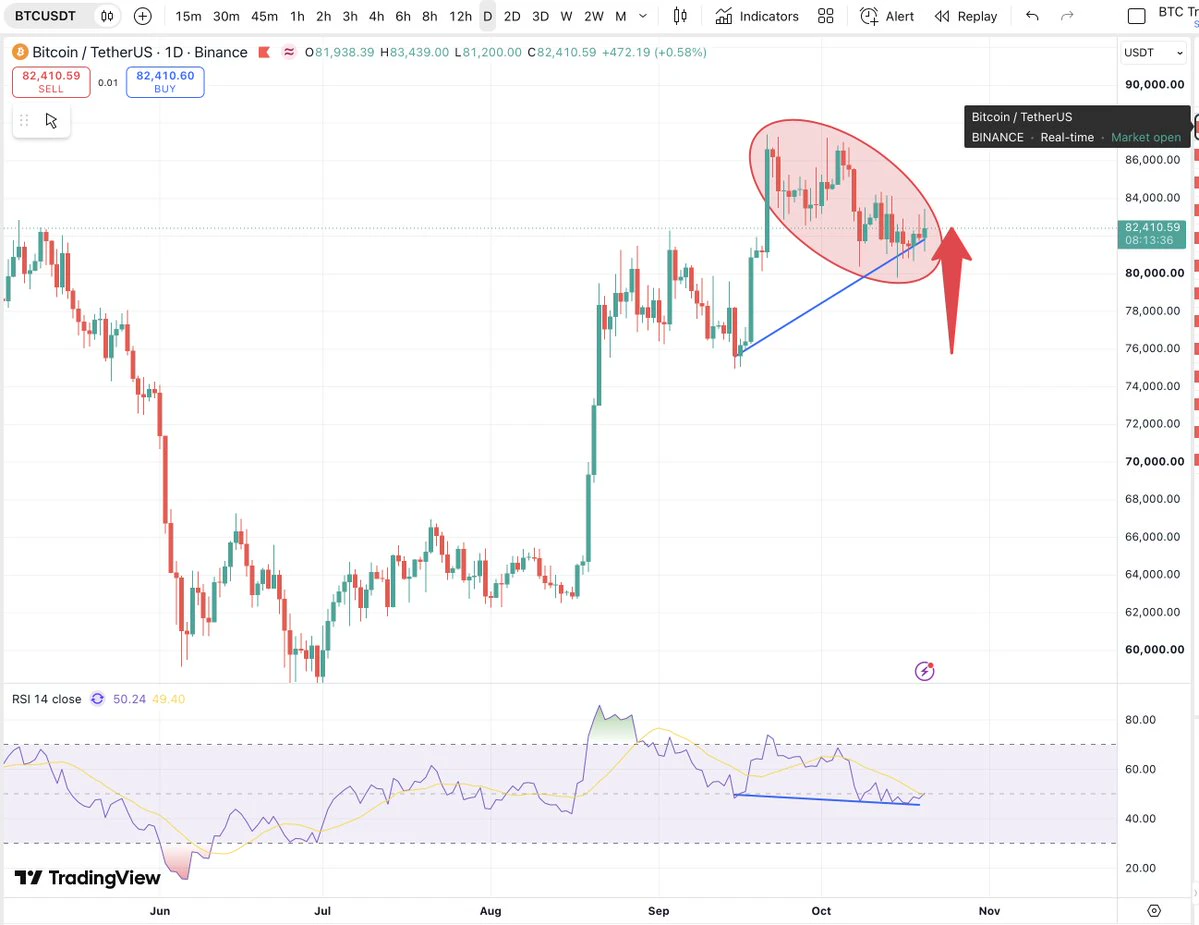
BTC update
live-cover
LIVE1,669
Everyone’s staring at SKYAI’s bounce—but the 4h chart just screamed something they’re ignoring.

$SKYAI /USDT - SHORT

Trade Plan:
Entry: 0.05955 – 0.06017
SL: 0.06280
TP1: 0.05766
TP2: 0.05619
TP3: 0.05399

Why this setup?
- 95% confidence on the short, and the 1D trend is already bearish—this isn’t a guess, it’s gravity.
- RSI on the 15m is at 63.66, meaning the last pop is running out of fuel right at our entry zone (0.05986).
- Why now? Price is hugging resistance between 0.06017 and 0.05955, while ATR (0.001223) shows volatility is compressing—breakouts here tend to snap hard.
-
SKYAI+5.20%
Fatcoin double cheeked up here with the BBL bottom pattern
post-image
FATCOIN+28.11%
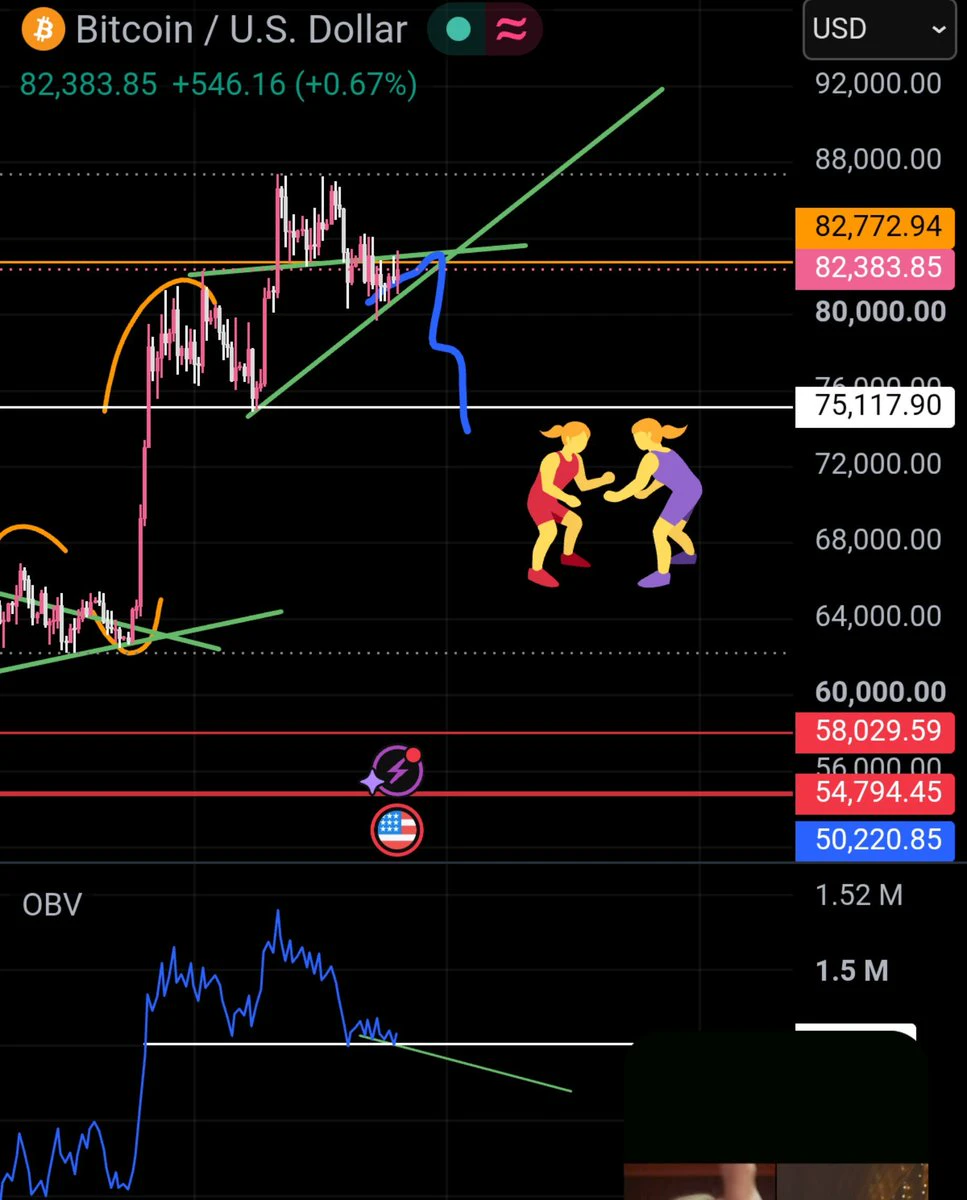
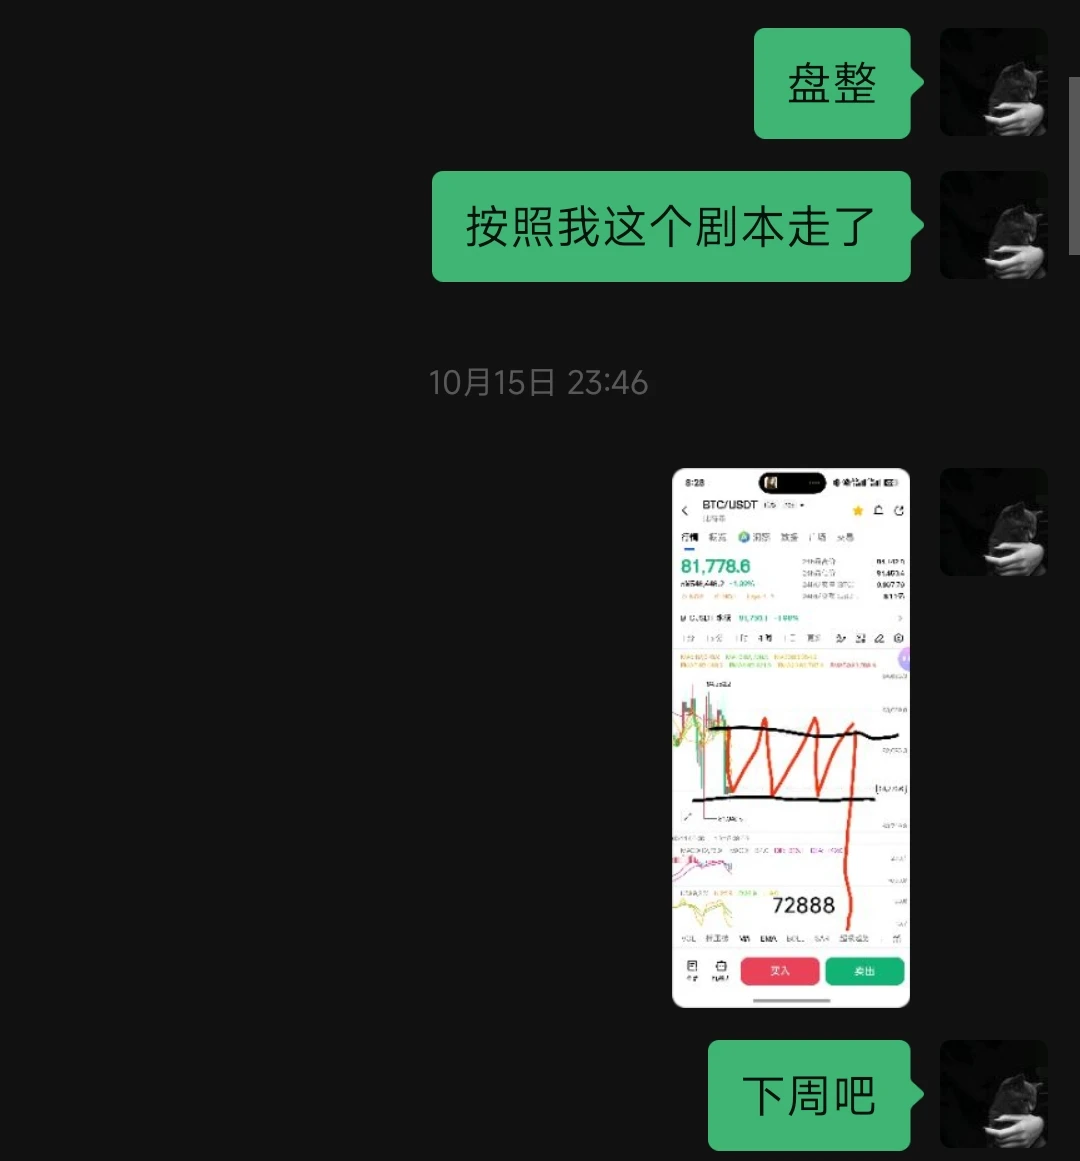
#美国8月非农超预期 #辣妹儿李嘉欣 With the broader market pressing down here, gate probably has 90% of people believing this rally is not over yet, but before it finishes rallying, there has to be a move back to around 72000, followed by another rally. Don’t ask me where this 90% came from—it’s like the 80% win rate shouted out in livestreams, synthesized through the Nobel Prize in Mathematics, Musk Leninism, and borderline short videos on short-video platforms. That’s not important. What matters is that according to the logic of these 90% of people, there should be a pullback before another rally. But if I
post-image
GT+12.18%
  • 4
Everyone’s chasing the 1D range—but the 4h clock on $MU /USDT is ticking toward a trapdoor.

$MU /USDT - SHORT

Trade Plan:
Entry: 1014.86 – 1017.08
SL: 1029.83
TP1: 1005.57
TP2: 998.64
TP3: 988.24

Why this setup?
Why now?
- RSI 15m at 55.7 is cooling, not reversing—momentum is bleeding into the 4h short bias (77.4 confidence).
- ATR 1h at 4.44 shows tight coils; the 1015.97 ref is a pivot. A break below 1014.86 opens TP1 at 1005.57, then TP2 at 998.64.
- 1D range means no rescue rally—just chop that favors sellers on the 4h.
- Your entry is waiting, not filled. That’s the edge.

post-image
MU+1.69%
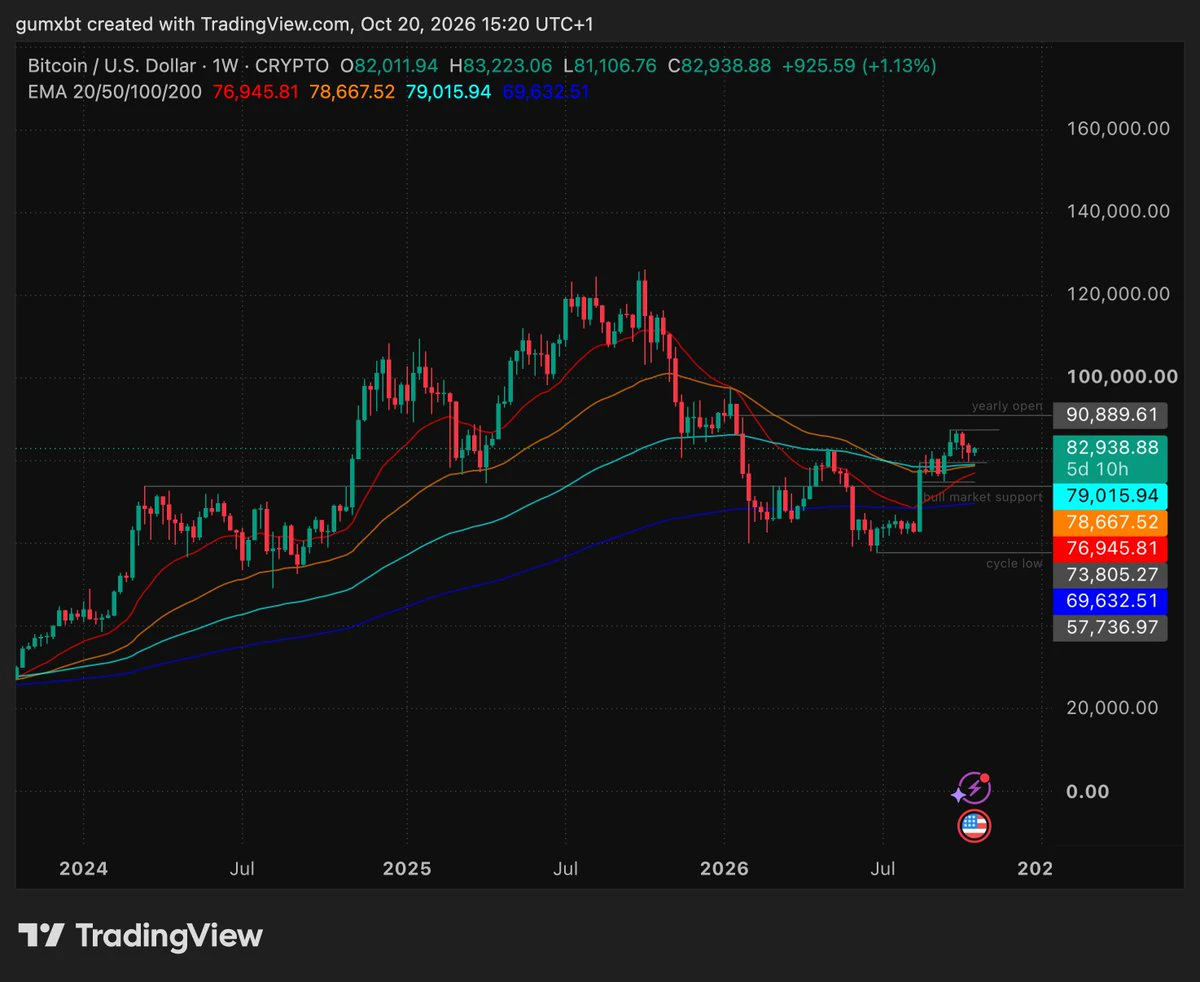
market update BTC
live-cover
LIVE675
JUST IN: Anthropic's Claude produced the first computer-checked formalization of Fermat's Last Theorem in Lean, closing a problem that stood for 350 years.
  • 2
With this trend, I don't even need to think—the account is partying on its own.

When I opened the chart this morning, $BASED held after the pullback, funds quietly entered, and volume began recovering. These signs had already appeared around 0.05933.

Now it's at 0.06948, with unrealized gains of +824.46%. This profit feels really good; everyone aboard must be smiling.

But no matter how good it feels, the rules can't be broken: take profit on 80% first and bank the bulk of it; move the stop-loss on the remaining 20% to the entry price and let it choose its own direction. If it dares to p
post-image
BASED+1.63%
LAB+2.45%
DOGE+6.35%
$XAN is surging rapidly and beginning to move away from the main force's cost basis. Everyone follow the momentum and enter long positions—it’s about to take off.
post-image
XAN+18.13%
  • 1
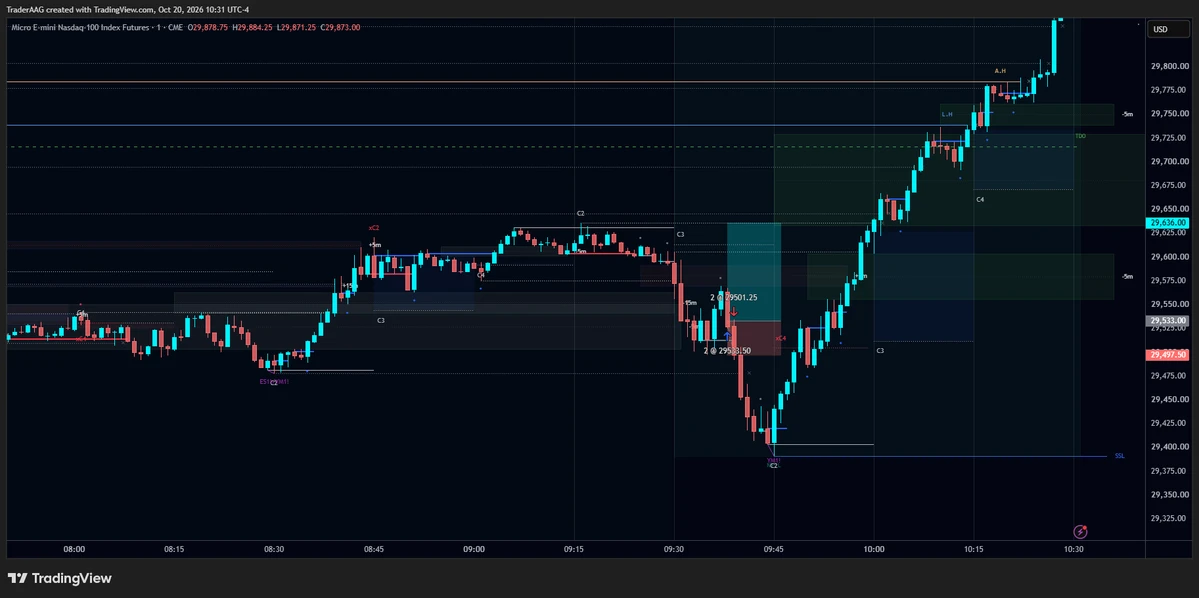
Warsh === bond volatility
$NQ doesn’t ignore high long-term yields—it can adapt to them if it’s stable and it has the strong earnings to survive this high yield environment.
But it would move violently in short term due to any high bond volatility.
Watch out for this FOMC.
post-image
Everyone’s staring at SOL’s 103.1—but the real trap is hiding in the 15-minute RSI.

$SOL /USDT - SHORT

Trade Plan:
Entry: 103.0 – 103.2
SL: 104.5
TP1: 102.1
TP2: 101.4
TP3: 100.4

Why this setup?
• RSI at 61.91 on the 15m screams overbought *before* the 4h rejection zone—this is a classic fade setup.
• Trend is range-bound on 1D, so 103.1 is the pivot: shorts target 102.1 (TP1) and 101.4 (TP2), while invalidation sits at 102.3.
• Why now? ATR (0.56) shows low volatility—meaning the squeeze is building, and the first move past 103.2 likely triggers the cascade.

Debate:
Do you trust t
post-image
SOL+2.57%
$NEAR
Ripping from 1.780, now pressing 2.335. Price below the 5 and 10 but above the 30—pullback after a strong move. Break above 2.289 triggers recovery; rejection retests 2.187. Momentum cooling but structure intact.
Entry Zone: 2.186 – 2.188
TP1: 2.289
TP2: 2.335
TP3: 2.400
Stop-Loss: 2.050
#NEAR #Gate60MillionUsers #BTCReclaims80K #HYPEBreaks88HitsNewAllTimeHigh #GateEventContractTradeSharingChallenge
post-image
NEAR+13.72%
  • 2
  • 1
Load More

Join 40 M users in our growing community

⚡️ Join 40 M users in the crypto craze discussion

💬 Engage with your favorite top creators

👍 See what interests you

View More