Share your thoughts
placeholder
Article
Weekly Macro Highlights: Nonfarm payrolls reignite expectations for Fed rate hikes
live-cover
LIVE1,808
HYPE breaks above $88 to hit a new all-time high! Is this takeoff, or is the market starting to get overexcited?
HYPE really has “something going on” this time—the price broke above $88, directly setting a new all-time high. For holders, this is more than just a number; it is the result of market sentiment, capital attention, and ecosystem expectations coming together.
What deserves the most attention is that HYPE’s market narrative has clearly heated up after breaking its previous high. Usually, when an asset breaks through its all-time high, it means less overhead selling pressure from trapp
HYPE+1.20%
  • 46
$MARSCOIN starting to form bearish structure on lower time-frames. Gonna try to short it another time from here.
Entry zone 0.2435 - 0.2475
Stop loss 0.25422
#MARSCOIN
post-image
MARSCOIN+27.50%
SKYAI’s 95% short signal just armed—but the real trap is waiting below 0.05828.

SKYAI/USDT - SHORT

Trade Plan:
Entry: 0.05894 – 0.05954
SL: 0.06208
TP1: 0.05711
TP2: 0.05569
TP3: 0.05356

Why this setup?
- 4H bias is SHORT with a 95% confidence score—this isn’t a coin flip.
- Daily trend is bearish, and RSI on 15m sits at 41.12, still room to drop before hitting oversold.
- Entry zone 0.05924–0.05954 aligns with ATR’s 0.001184 volatility—tight risk for a 3-TP cascade down to 0.05356.
- Why now? Price is hugging the 1H pivot while momentum bleeds; the invalidation at 0.05828 is your
SKYAI+6.42%
I remain bullish on this market cycle, and I don't think we're at the end of the bull market. Instead, it looks more like the main uptrend is beginning to spread from BTC to altcoins.
Why do I see it this way?
Because what is happening in the market is no longer just one or two coins performing independently.
ZEC keeps making new highs, DASH and XMR are beginning to accelerate, and platform tokens like GT are rising in succession. This shows that capital has started flowing out of BTC, ETH, and the earlier Meme rally, and is once again searching for the next batch of assets with attractive ris
NVDA+0.87%
Everyone’s staring at $H /USDT’s bounce, but the 95% short signal says they’re about to get run over.

$H /USDT - SHORT

Trade Plan:
Entry: 0.07620 – 0.07690
SL: 0.07991
TP1: 0.07403
TP2: 0.07236
TP3: 0.06984

Why this setup?
Why now?
- The 1D trend is still **bearish**, and the 4h setup is armed for a drop—not a reversal.
- RSI (15m: 41.4) shows weak momentum, no oversold snap-back fuel.
- Price sits at 0.07655, with immediate targets at 0.07403 and 0.07236—that’s a 5%+ slide before any real support.
- ATR (1h: 0.001398) means volatility is alive, but the path of least resistance i
H-5.54%
🇺🇸 US dollar has lost 97% of its purchasing power since the Federal Reserve was created.
A $3 item in 1913 would cost $100 today.
post-image
Everyone’s staring at 103.36—but the real trap is hiding in plain sight on $SOL /USDT.

$SOL /USDT - SHORT

Trade Plan:
Entry: 103.18 – 103.54
SL: 105.05
TP1: 102.09
TP2: 101.25
TP3: 99.98

Why this setup?
- The 4h frame says SHORT, but confidence is just 55—this is a knife-edge, not a conviction.
- RSI on 15m (45.75) is dead neutral: no panic, no euphoria—just a coiled spring.
- ATR 1h at 0.70 means the next 4 candles could fake you out before the real move.
- Why now? The range on 1D is the anchor—we’re bouncing inside it, and TP1 at 102.09 is the first magnet, but a break below 102
SOL+1.36%
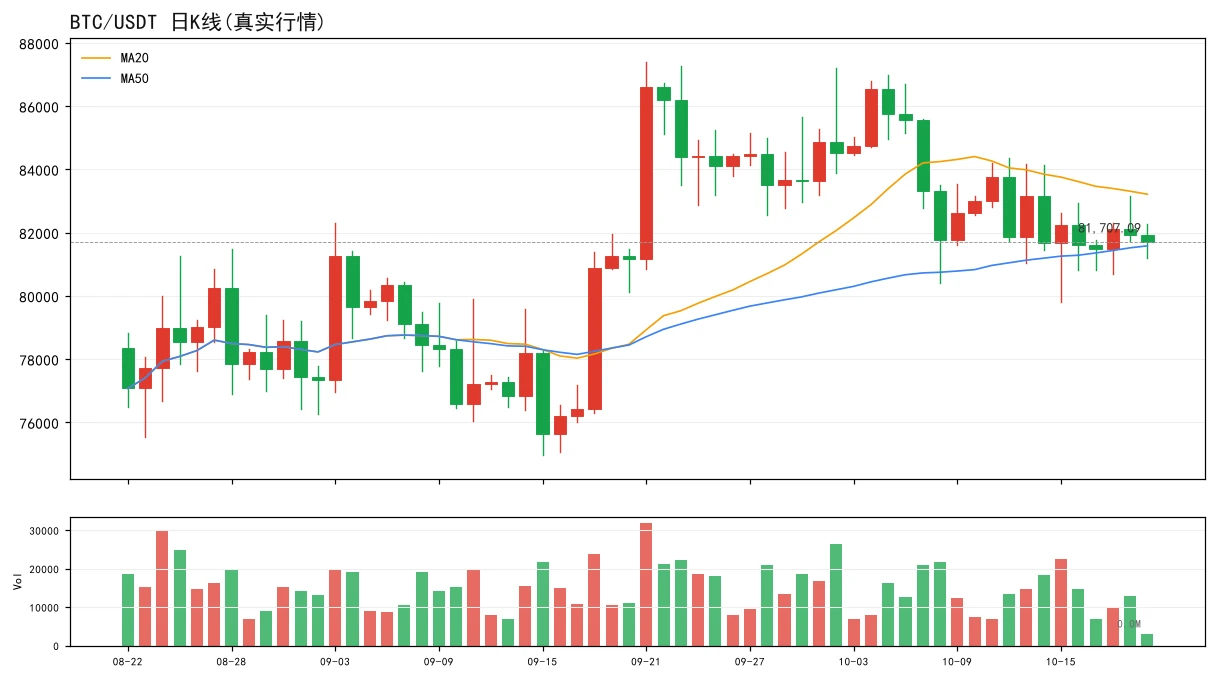
Bull-Bear Divide Deepens Around $82K! B.TOP Founder Sells All His BTC
live-cover
LIVE38
Everyone’s watching $MU /USDT for a breakout—but the 4H chart just whispered a secret the crowd missed.

$MU /USDT - SHORT

Trade Plan:
Entry: 1015.38 – 1017.00
SL: 1026.36
TP1: 1008.56
TP2: 1003.48
TP3: 995.86

Why this setup?
- RSI (15m) at 47.92—no momentum spike, just sideways exhaustion.
- ATR (1H) at 3.25 shows shrinking volatility, priming for a sharp squeeze lower.
- 1D trend is *range*—so we’re not chasing; we’re fading the top of the box at 1016.19.
- TP1 at 1008.56 is 0.75% away; TP2 at 1003.48 is the real magnet if 1015 support cracks.

Debate:
Is 1016 the fake ceiling be
MU+0.11%
This rebound in $LIT has honestly been stronger than I expected. After the earlier wick swept out the stop-losses on several of my long positions, the price pulled back up and firmly reclaimed the key level. But compared with predictions, I care more about how to respond. With unrealized profit reaching +1175.49%, I took profit and exited 70% of the position first, and moved the protection level on the remaining 20% above the entry price. The reason is simple: the higher it goes, the more we need to watch out for false breakouts and profit-taking.

The price is now around 4.752. As for wheth
post-image
LIT-0.81%
ADA+3.65%
ZEC+0.15%
Everyone’s staring at the 1D range, but the 4h clock just struck midnight for $MU /USDT.

$MU /USDT - SHORT

Trade Plan:
Entry: 1015.04 – 1016.60
SL: 1025.51
TP1: 1008.56
TP2: 1003.71
TP3: 996.45

Why this setup?
- RSI on the 15m is already at 45.18—that’s not oversold, that’s a bull trap losing its breath.
- With ATR at 3.10 on the 1h, the move down from 1015.82 to TP1 (1008.56) is just 2.3x the average hourly range—easy prey.
- The “Armed” status means the trigger is live; we don’t need a trend flip, just a range rejection.
- Why now? Because the 1D is sideways, and sideways always
MU+0.11%
The Truth Behind AKE’s Overnight Surge: A Carefully Orchestrated Hunt
Last night, Shandi surged strongly from 0.008, with its price increasing sixfold
Many people only saw the explosive price rise
Yet overlooked the silent battle behind it.
From my observation,
AKE had recently been trading sideways for a long time, continuously luring in shorts. A top influencer had opened a heavily leveraged short position in advance,
with an enormous position that had practically become the most conspicuous short on the order book.
And the market maker had set its sights precisely on this “certainty.”
Start
post-image
AKE+40.03%
SNDK+1.80%
Don’t just show your profits! What’s really interesting is why you dared to bet on this side.
Recently, after taking part in Gate’s event contract P&L-sharing challenge, I found that the most interesting part of this format isn’t simply showing how much you made, but laying out your full market judgment.
The biggest appeal of event contracts is that every choice is based on a clear question: up or down? Breakout or pullback? Will a certain event ultimately happen?
My approach has always been fairly simple: look at the macro picture first, then price, and finally market sentiment. For example,
BTC+0.25%
WLD's 4h chart is whispering a short—but 55% confidence means the market is laughing at certainty.

$WLD /USDT - SHORT

Trade Plan:
Entry: 0.3960 – 0.3982
SL: 0.4076
TP1: 0.3892
TP2: 0.3839
TP3: 0.3760

Why this setup?
Why now? The 1D trend is *range*, not breakout—so mean-reversion rules. RSI on 15m sits at 51.01, dead neutral, giving price room to drop without overbought friction. Entry ref at 0.3971, with TP1 at 0.3892 (a clean 2% sweep) and TP2 at 0.3839—that's where the range's lower lip likely bites. ATR on 1h (0.004387) is tight, so the move should be slow, not violent—perfect for a
WLD+3.92%
Giveaway 3 GTD spots @Chomponhood
Requirements
> Drop evm wallet
12 Hours
post-image
Most traders still think DOGE is bullish—here’s the 4h signal they’re ignoring.

$DOGE /USDT - SHORT

Trade Plan:
Entry: 0.08945 – 0.09013
SL: 0.09301
TP1: 0.08737
TP2: 0.08576
TP3: 0.08334

Why this setup?
Why now?
- RSI 15m at 43.67 = weak bounce, sellers reloading.
- 1D trend is *range*, not uptrend—so shorts work at range highs.
- Entry zone: 0.08945–0.09013. TP1 at 0.08737 is a 2.7% drop; TP3 at 0.08334 is a 7% drop.
- Stop at 0.09301 caps risk above range midpoint.
- Confidence 55% isn’t screaming, but the asymmetry (risk ~3.5% vs reward ~7%) favors the short.

Debate:
If D
DOGE+5.99%
Most traders will ignore $LAB /USDT at 0.07413—that’s exactly why the 95% short setup is armed.

$LAB /USDT - SHORT

Trade Plan:
Entry: 0.07390 – 0.07436
SL: 0.07630
TP1: 0.07250
TP2: 0.07142
TP3: 0.06979

Why this setup?
- 4h structure is bearish, but the 1D trend confirms it: downside is the path of least resistance.
- RSI on 15m at 37.24 shows momentum is already rolling over—no bounce strength to fight the slide.
- Entry window is tight (0.07390–0.07436), with TP1 at 0.07250 and TP3 at 0.06979.
- The invalidation at 0.07428 is razor-thin—either we break down fast or this signal di
LAB+0.31%
$COIN Signal】Long · 1H buying support enters
$COIN 4H RSI 70.07, MACD histogram narrowed to 0.0056, with the price moving sideways in the 0.176-0.181 range. 1H MACD bearish expansion, with buying support appearing repeatedly at the 0.1699-0.1717 lows and buyers providing real-time support. Depth imbalance is 1.77%, Bid/Ask depth is 1.04, and selling pressure is being absorbed quickly.
🎯Direction: Long
⚡Entry/limit order: 0.178164-0.178700
🛑Stop-loss: 0.176913
🚀Target 1: 0.181381
🚀Target 2: 0.182721
🛡️Trade management: - Execution strategy: After reaching target 1, reduce the position by
post-image
COIN+0.71%
BTC+0.25%
ETH+1.15%
SOL+1.30%
Is HYPE’s new all-time high just the beginning? The real test comes after $88!
HYPE broke through $88 and set a new all-time high, and this kind of move is most likely to ignite market sentiment.
Why does a new high matter? Because once the price breaks above all previous highs, the pressure from holders trapped at higher levels is significantly reduced, and the market begins to enter a new phase of “price discovery.” At this point, the market’s focus also shifts from “Can it break through?” to “Where is the next stop?”
But the stronger the rally, the less you should focus solely on the gains.
HYPE+1.20%
  • 48
Load More

Join 40 M users in our growing community

⚡️ Join 40 M users in the crypto craze discussion

💬 Engage with your favorite top creators

👍 See what interests you

View More