










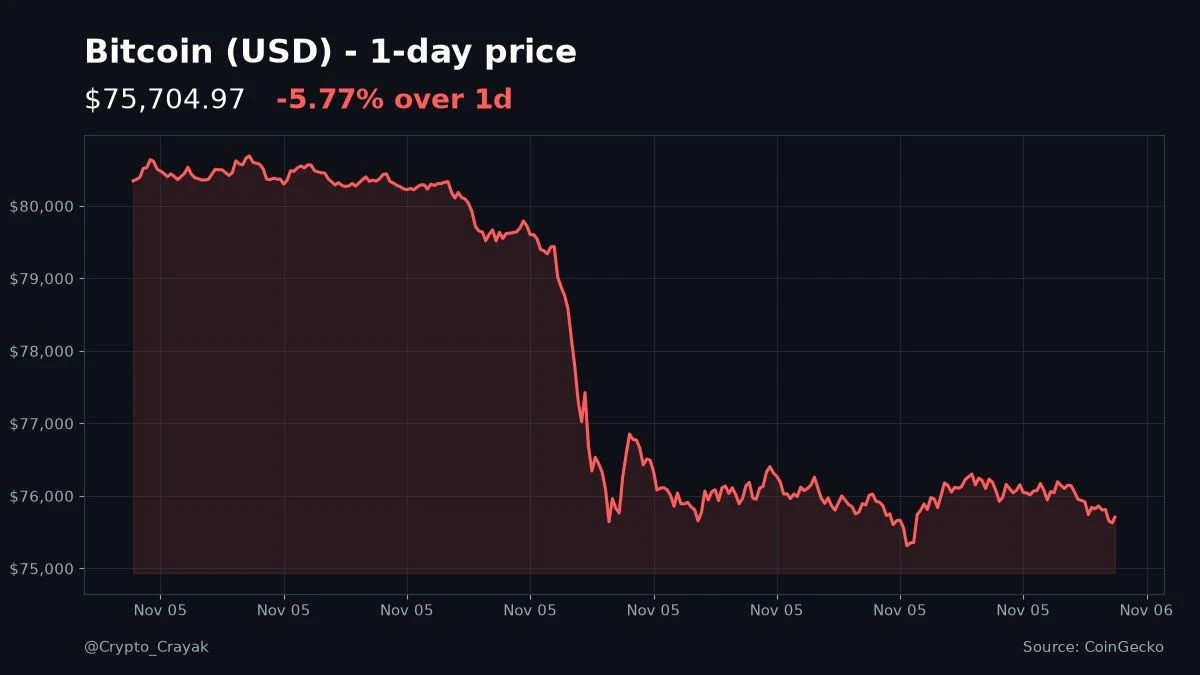


Don’t let the numbers mislead you; those figures don’t point to a market collapse, but rather to an entirely different structural mechanism.
The real story lies within a historic wave of selling—triggered in the artificial intelligence and semiconductor sectors following the U.S. midterm elections—that rippled across the Pacific all the way to Seoul. What unfolded on Thursday, November 5, 2026, was more than just a correction; it was a watershed moment—a stress test for the AI trade, challenging both its valuations and the underlying policy landscape.
Just how severe was the sell-off on Wall Street?
The wave of selling that hit U.S. markets on Thursday marked the sharpest decline in recent years. The Nasdaq tumbled 5.52% to 24,315 points, falling 11.9% from its early-October peak and officially entering correction territory. The S&P 500 dropped 4.36%, while the Dow Jones slid 3.44%, shedding 1,833 points.
The devastation was most acute in the semiconductor sector. The semiconductor index plummeted 12.25% in a single day—its worst performance since March 2020. The stocks on your screen tell the story: Nvidia fell 9.33%, AMD 17.64%, Micron 17.23%, and SanDisk 22.24%, with various Asian ADRs also posting losses exceeding 10%. In total, approximately $2 trillion in market capitalization evaporated in just one day.
What was the hidden cause behind the sell-off?
There isn’t a single reason, but the midterm elections served as the primary catalyst. The Democrats gaining the upper hand in Congress has raised questions among investors as to whether regulations concerning the construction of data centers might become more stringent.
The market has begun to price in the possibility that the development of data centers—the backbone of the artificial intelligence revolution—could slow down due to new energy and environmental regulations. Signals from newly elected officials in states like Texas, Georgia, and Ohio, suggesting potential restrictions on data centers, have further fueled these concerns. According to one analysis, approximately 30% of the projected data center capacity in the United States through 2028 is now at risk due to potential construction delays.
Compounding this, a chip manufacturer’s announcement of a 26% decline in sales for its mobile phone chips has led the market to wonder: is spending on artificial intelligence beginning to cool off?
How did the shockwave from across the Pacific hit Seoul?
The turmoil on Wall Street spread to South Korea the moment its markets opened. The KOSPI index plummeted by more than 8%, falling below the 5,000-point mark and triggering a circuit breaker just three minutes into the trading session.
Korean corporate giants were at the heart of this collapse: SK Hynix shares fell by as much as 11.71% to 1,116,000 won—a sharp reversal, considering the company had reported record-breaking quarterly sales just a week earlier. Samsung Electronics shares dropped 9.98% to 181,400 won. A similar trend emerged in Japan, where Tokyo Electron, SoftBank, and Advantest saw their values decline by 2.58%, 8.59%, and 5.07%, respectively. Because the stock markets in South Korea and Japan are heavily weighted toward the semiconductor sector, they tend to amplify any technology-related shock originating in the United States. What is the secret behind the "-38" figures on the screen?
The extreme figures—such as -38.65% and +38.64%—seen in the leveraged products in the image do not represent a market collapse; rather, they are the result of reverse splits and the structural nature of leveraged ETFs.
For a product designed to deliver triple the daily performance of an index, a 12% decline in the semiconductor index would mathematically result in a drop of approximately 36%. The 38% decline shown on the screen also reflects a price adjustment following a reverse split. Conversely, a product designed to move inversely to the index (betting on a decline) will rise as the index falls. However, because such funds tend to lose value consistently over the long term, they frequently undergo reverse splits. The +38% increase seen on the screen is actually a byproduct of the consolidation process intended to offset the fund's historical loss in value.
In short, these figures are "structural noise" inherent to the nature of leveraged ETFs; they do not reflect the actual performance of the underlying stocks.
Is this a buying opportunity or a new regime?
The market is currently caught between two opposing scenarios. On one side are those who argue that this is merely a temporary correction—a liquidation of overheated positions in the artificial intelligence sector. On the other side are those who believe that AI valuations remain detached from reality and that this is, therefore, not a buying opportunity.
One thing is certain: the market is no longer driven by the same narrative. The triad of valuation, policy, and liquidity is being recalibrated. It would not be surprising to see further macro shocks of this nature until regulations regarding data centers in the United States are clarified. What you should monitor is the distinction between technical price adjustments in leveraged products and the primary market trend; the extent to which the declines in Seoul and Tokyo are driven by regulatory uncertainty in the United States; and whether semiconductor companies—despite these policy-related headwinds—are managing to maintain their order backlogs.
This content is for informational purposes only and does not constitute investment advice.
$MU $AMD $SNDK $TSLA $INTC
#USStocksFaceHistoricSelloff
#GateSquareTradingChallenge #Gate股票畅聊季 #GateStockTalkSeason #ShareWeekly
The real story lies within a historic wave of selling—triggered in the artificial intelligence and semiconductor sectors following the U.S. midterm elections—that rippled across the Pacific all the way to Seoul. What unfolded on Thursday, November 5, 2026, was more than just a correction; it was a watershed moment—a stress test for the AI trade, challenging both its valuations and the underlying policy landscape.
Just how severe was the sell-off on Wall Street?
The wave of selling that hit U.S. markets on Thursday marked the sharpest decline in recent years. The Nasdaq tumbled 5.52% to 24,315 points, falling 11.9% from its early-October peak and officially entering correction territory. The S&P 500 dropped 4.36%, while the Dow Jones slid 3.44%, shedding 1,833 points.
The devastation was most acute in the semiconductor sector. The semiconductor index plummeted 12.25% in a single day—its worst performance since March 2020. The stocks on your screen tell the story: Nvidia fell 9.33%, AMD 17.64%, Micron 17.23%, and SanDisk 22.24%, with various Asian ADRs also posting losses exceeding 10%. In total, approximately $2 trillion in market capitalization evaporated in just one day.
What was the hidden cause behind the sell-off?
There isn’t a single reason, but the midterm elections served as the primary catalyst. The Democrats gaining the upper hand in Congress has raised questions among investors as to whether regulations concerning the construction of data centers might become more stringent.
The market has begun to price in the possibility that the development of data centers—the backbone of the artificial intelligence revolution—could slow down due to new energy and environmental regulations. Signals from newly elected officials in states like Texas, Georgia, and Ohio, suggesting potential restrictions on data centers, have further fueled these concerns. According to one analysis, approximately 30% of the projected data center capacity in the United States through 2028 is now at risk due to potential construction delays.
Compounding this, a chip manufacturer’s announcement of a 26% decline in sales for its mobile phone chips has led the market to wonder: is spending on artificial intelligence beginning to cool off?
How did the shockwave from across the Pacific hit Seoul?
The turmoil on Wall Street spread to South Korea the moment its markets opened. The KOSPI index plummeted by more than 8%, falling below the 5,000-point mark and triggering a circuit breaker just three minutes into the trading session.
Korean corporate giants were at the heart of this collapse: SK Hynix shares fell by as much as 11.71% to 1,116,000 won—a sharp reversal, considering the company had reported record-breaking quarterly sales just a week earlier. Samsung Electronics shares dropped 9.98% to 181,400 won. A similar trend emerged in Japan, where Tokyo Electron, SoftBank, and Advantest saw their values decline by 2.58%, 8.59%, and 5.07%, respectively. Because the stock markets in South Korea and Japan are heavily weighted toward the semiconductor sector, they tend to amplify any technology-related shock originating in the United States. What is the secret behind the "-38" figures on the screen?
The extreme figures—such as -38.65% and +38.64%—seen in the leveraged products in the image do not represent a market collapse; rather, they are the result of reverse splits and the structural nature of leveraged ETFs.
For a product designed to deliver triple the daily performance of an index, a 12% decline in the semiconductor index would mathematically result in a drop of approximately 36%. The 38% decline shown on the screen also reflects a price adjustment following a reverse split. Conversely, a product designed to move inversely to the index (betting on a decline) will rise as the index falls. However, because such funds tend to lose value consistently over the long term, they frequently undergo reverse splits. The +38% increase seen on the screen is actually a byproduct of the consolidation process intended to offset the fund's historical loss in value.
In short, these figures are "structural noise" inherent to the nature of leveraged ETFs; they do not reflect the actual performance of the underlying stocks.
Is this a buying opportunity or a new regime?
The market is currently caught between two opposing scenarios. On one side are those who argue that this is merely a temporary correction—a liquidation of overheated positions in the artificial intelligence sector. On the other side are those who believe that AI valuations remain detached from reality and that this is, therefore, not a buying opportunity.
One thing is certain: the market is no longer driven by the same narrative. The triad of valuation, policy, and liquidity is being recalibrated. It would not be surprising to see further macro shocks of this nature until regulations regarding data centers in the United States are clarified. What you should monitor is the distinction between technical price adjustments in leveraged products and the primary market trend; the extent to which the declines in Seoul and Tokyo are driven by regulatory uncertainty in the United States; and whether semiconductor companies—despite these policy-related headwinds—are managing to maintain their order backlogs.
This content is for informational purposes only and does not constitute investment advice.
$MU $AMD $SNDK $TSLA $INTC
#USStocksFaceHistoricSelloff
#GateSquareTradingChallenge #Gate股票畅聊季 #GateStockTalkSeason #ShareWeekly