
Square
Following
Hot
News
Notifications
Profile
Share your thoughts
placeholder
Article
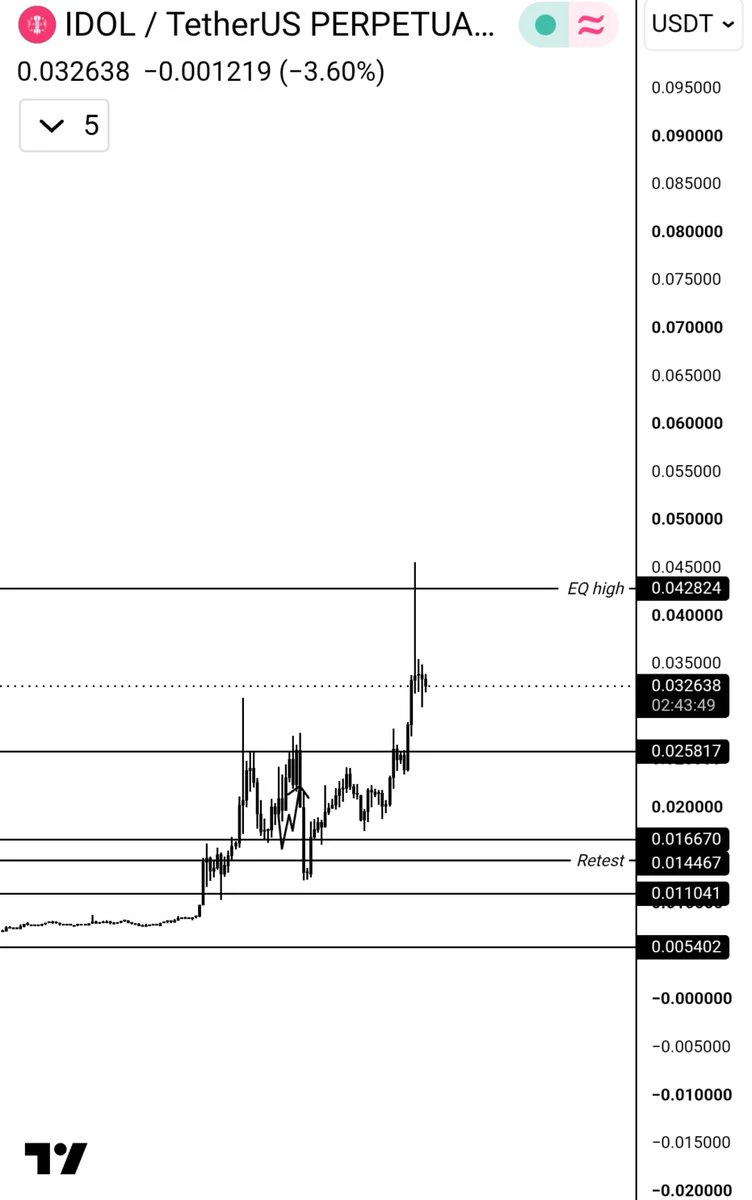
After #Idol $Idol reclaims 0.042$ I provide new targets
post-image
IDOL-6.71%
#Ahr999EntersBottomBuyingZone #Ahr999EntersBottomBuyingZone

The Bitcoin market is getting more attention as the AHR999 indicator enters the bottom buying zone. This indicator is followed by many Bitcoin investors because it can help them understand whether BTC may be trading at a relatively low price compared with its historical growth trend.

AHR999 is a Bitcoin market indicator that compares Bitcoin's current price with its historical price trends and long-term growth expectations.

When this indicator enters the bottom buying zone, some investors see it as a possible opportunity to accumul
BTC-0.67%
  • 2
Trenches
ZIG
Z
bade
b
ZIG
0x8c...1145
Market Cap
$.
Change
.
24h Vol
$.
Holders
.
STONK
S
bade
b
STONK
6GmA...UNgx
Market Cap
$.
Change
.
24h Vol
$.
Holders
.
IDOL
I
bade
b
IDOL
0x3b...ab07
Market Cap
$.
Change
.
24h Vol
$.
Holders
.
MAGGIE
M
bade
b
MAGGIE
8rHo...PmZV
Market Cap
$.
Change
.
24h Vol
$.
Holders
.
FLOAT
F
bade
b
FLOAT
Bv1a...BMmr
Market Cap
$.
Change
.
24h Vol
$.
Holders
.
#StakeOnLaunchpoolToShare450KVLX Stake on Launchpool to Share 450K VLX

The latest Launchpool opportunity is attracting attention from the crypto community, with a total reward pool of 450,000 VLX available for eligible participants. This campaign gives users an opportunity to participate in a token distribution event while learning more about the project and its ecosystem. Launchpool campaigns have become an important part of the cryptocurrency market because they connect new projects with users and give communities a chance to participate in early ecosystem growth.

The idea behind Stake on
VLX+0.00%
  • 5
#Ahr999EntersBottomBuyingZone
#ShareWeekly
AHR999 Indicator Enters Bitcoin’s Historical Bottom-Buying Zone: A Detailed Look at What It Means, Current Market Context, and Why Caution Remains Essential
As of early November 2026, the AHR999 indicator for Bitcoin has moved below the 0.45 threshold and entered the zone that historically has been associated with deeper value or potential accumulation opportunities. Recent readings have hovered around 0.43 (with reports citing approximately 0.429–0.431). This marks a return to the bottom-buying range for the first time since roughly August 20, 2026
#USCPIDataIncoming
The US Consumer Price Index (CPI) data is approaching, and financial markets are preparing for another important economic update. CPI is one of the most closely watched economic indicators because it provides valuable information about inflation and changes in the cost of living across the United States. Investors, traders, financial institutions, and policymakers will be paying close attention to the upcoming figures to understand the direction of inflation and its possible impact on the broader economy.

The CPI report measures changes in the prices consumers pay for ever
  • 3
Bitcoin ETF Outflows Accelerate as BlackRock Records Heavy Investor Withdrawals
live-cover
LIVE1,104
Are institutional funds collectively pretending to be asleep? BTC ETFs see $870 million in outflows—when will the next wave of dip buyers appear?

Bitcoin investors may be feeling a little down lately: retail investors are still studying candlestick charts, while institutions have already voted with real money.
U.S. spot BTC ETFs saw nearly $870 million in cumulative net outflows this week, and the retreating funds have once again made the market feel the harshness of reality.
But interestingly, outflows don't mean institutions have completely given up on Bitcoin.
For large investment institut
AUDUSD-0.96%
  • 28
crypto future market update
live-cover
LIVE1,912
Are you guys still sticking with AGC
I did the math on today's freebie and only claimed 3u🤣
If you're not continuing, then that's that. Looks like agents are about to fizzle out
Bitcoin Repeating 2023 Setup That Sparked Last Major Rally: Analyst
Bitcoin may be quietly setting up its next big move. Despite this week’s sell-off, a crypto analyst has spotted a pattern on the weekly chart that last appeared in 2023, shortly before BTC launched a rally that more than doubled its price.
BTC is currently trading around $76,000, sitting just above its weekly 50-period moving average (MA) at roughly $75,500. That comes after the price was rejected from the weekly MA 100 near $87,400, leaving Bitcoin stuck between the two lines.
⚠️ Personal market analysis only. NFA — manage ri
BTC-0.67%
#70%OfAltcoinsFallBelow200DMA
#OfAltcoinsFallBelow200DMA

The cryptocurrency market is facing another important moment as a large number of altcoins fall below their 200-day moving average (200DMA). This development is attracting attention from traders and investors because the 200-day moving average is an important indicator used to understand the long-term market trend.

The 200DMA helps investors identify whether an asset is showing strength or weakness over a longer period. When an altcoin falls below this level, it can indicate increasing selling pressure and weaker market momentum.

Thi
BTC-0.67%
  • 3
U.S. Stocks Weekly Outlook | 11.09–11.13: CPI to Set Rate Hike Expectations, AI Trade Faces Major Test

【This Week in Review: Weak Rebound After Sharp Selloff, Nasdaq Enters Technical Correction】
U.S. stocks saw sharp swings this week. On Thursday (November 5), AI computing power stocks came under heavy selling pressure. The S&P 500 Information Technology sector fell 7.3% in a single day, the Philadelphia Semiconductor Index plunged 12.2%, its biggest one-day drop in more than six years, and the Nasdaq slumped 5.5%, retreating nearly 12% from its October record high and entering a technical co
NAS100-0.07%
SPYX+0.01%
SPX+0.33%
CME-0.40%
CRWV+6.18%
The best decision I’ve made in recent years was starting to run an X account in June 2024. The second-best was going to HK at the end of 2025 and opening several overseas bank accounts
As a result, I’ve received a total of $26,607 in creator earnings from Boss Ma
It’s not a huge amount, but for an ordinary person, it’s already enough to improve their life
Some friends may be wondering: Uncle, do you have any way to fast-track creator earnings?
Just one: keep putting out valuable content, and keep putting it out
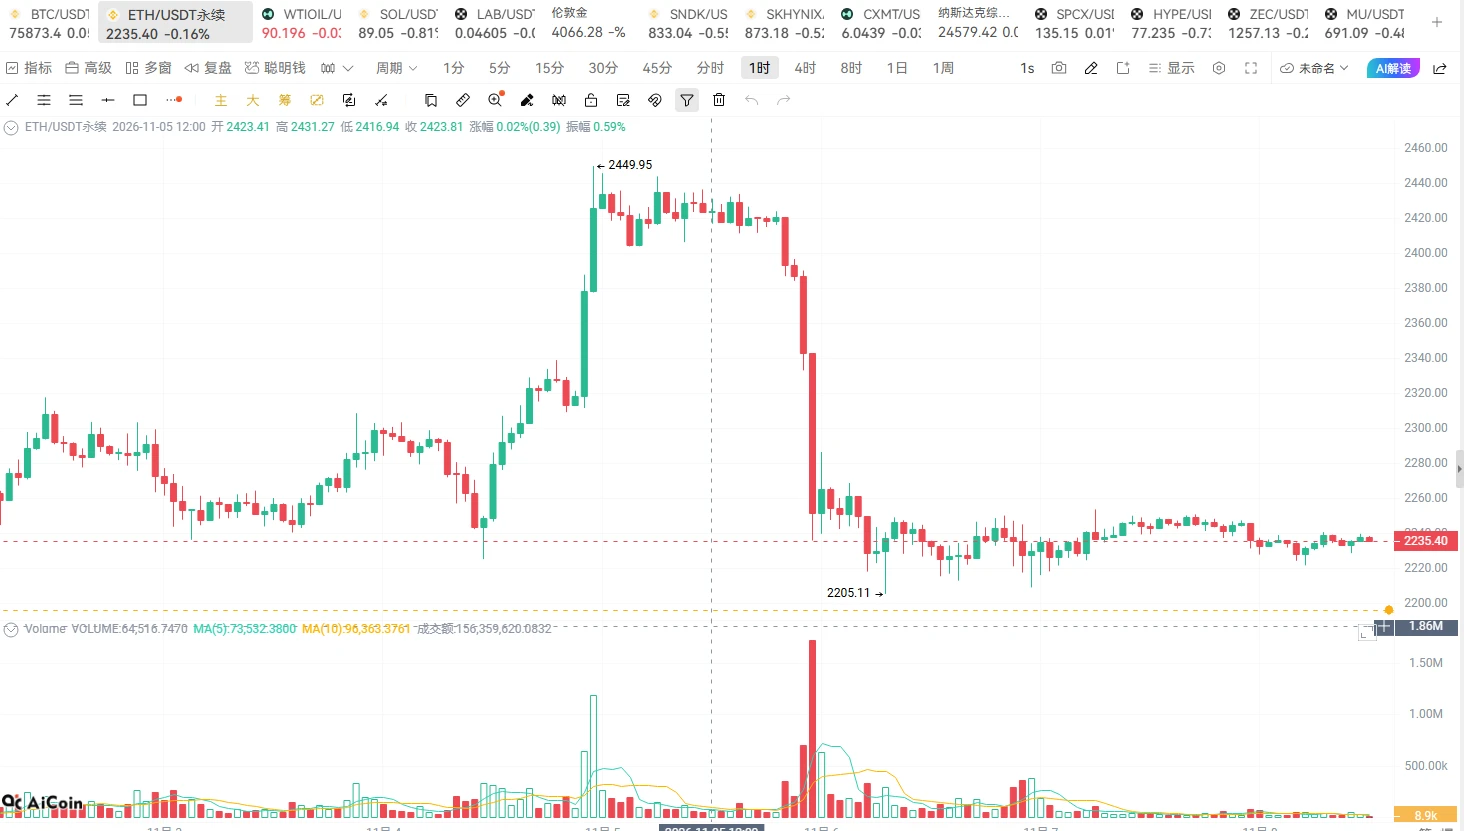
Yesterday’s 2200–2270 range call was validated; today, continue trading within the range

The 2200–2270 range outlined in advance yesterday saw ETH dip to around 2205, then rebound above 2250 and reach a high near 2260, with overall price action matching expectations.

Today’s ETH trading plan:

Go long at 2210–2220, with a stop-loss below 2195 and targets of 2240–2250, then 2260.

Try going short at 2250–2265, with a stop-loss above 2280 and targets of 2230–2220, then 2210.

Pause buying dips if ETH breaks below 2200 decisively.

Cancel the plan to short at higher levels if ETH holds above 22
post-image
ETH-1.26%
Expectations for a Fed rate hike in December suddenly surge. Is there still a chance of a year-end Bitcoin bull market?

The year-end rally hasn’t officially begun, but macro markets are already building suspense.
The U.S. added 165,000 nonfarm jobs in October, far exceeding market expectations. The strong jobs data has revived concerns that the Fed may continue tightening monetary policy, with the probability of a December rate hike reportedly rising to 77.7%.
For investors hoping for improved liquidity by year-end, this is undoubtedly a signal that deserves serious attention.
If the Fed cont
BTC-0.67%
  • 25
$ADA Current price: 0.1802. The first resistance above is at 0.1815 (where MA20 overlaps the Bollinger middle band), with support below at 0.1793 (the Bollinger lower band). Price is trading near the lower Bollinger band, and MA5 is slightly below MA20, indicating a weak trend structure. However, the MACD histogram has turned positive, and bearish momentum is fading, signaling a recovery phase within a weak market.
The funding rate is the key point of tension this round: at -0.0068%, shorts are continuously paying to hold their positions, indicating crowded short positioning in the derivative
post-image
ADA-1.48%
ONE-1.19%
PEPE+0.97%
  • 1
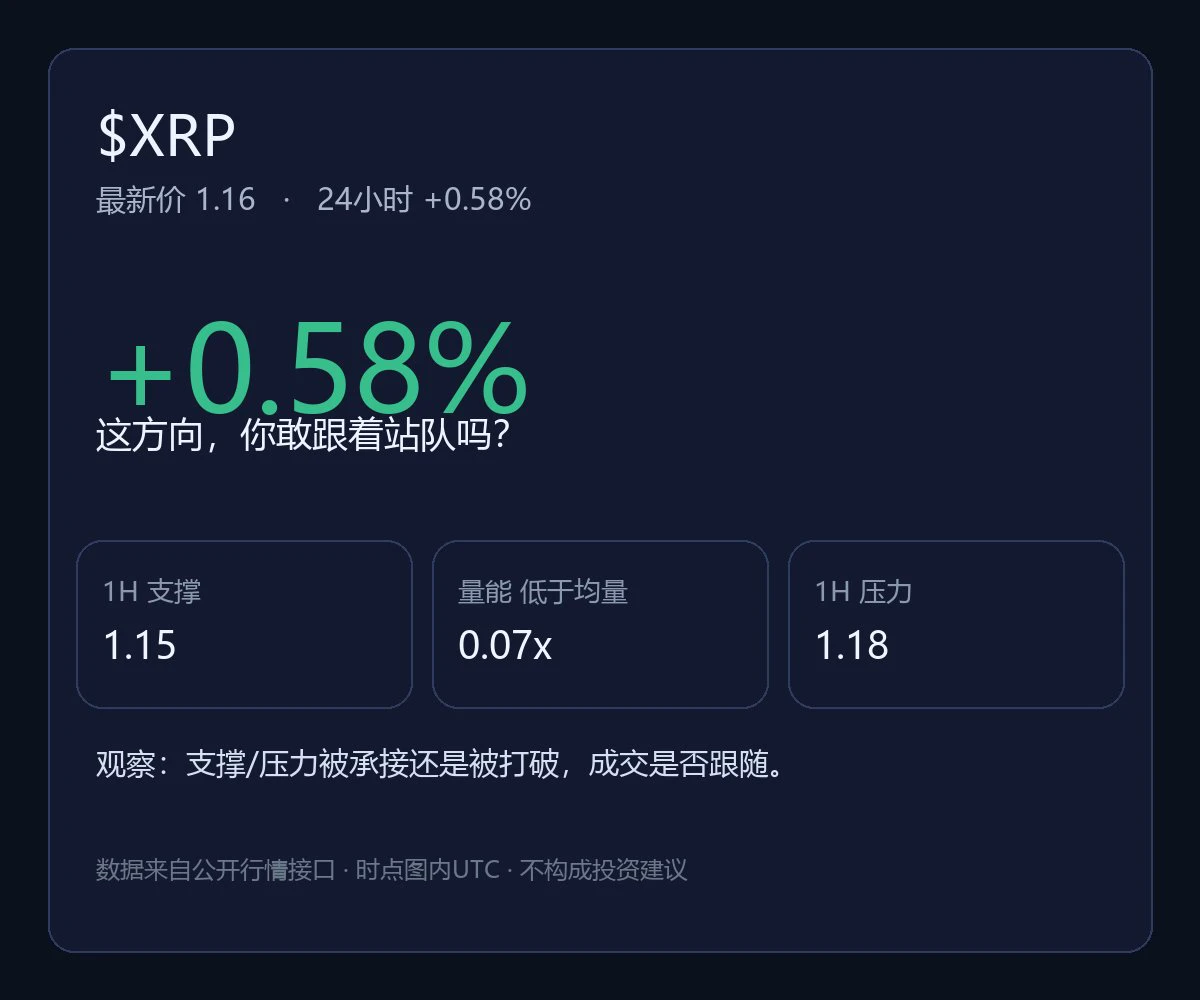
$XRP 's direction is holding for now, but low volume undermines its credibility

$XRP is currently priced at 1.1626, up 0.5796349165152925% over 24 hours, with an intraday high of 1.1821 and a low of 1.1495. The 1-hour and 4-hour trends are both weak, and the volume ratio is 0.06728641053227415. Price has moved first, but trading volume has not followed. This divergence is more worth watching than the color of a single candlestick.

In terms of key levels, the 1-hour support is 1.1495 and resistance is 1.1821. At 1.1626, the current price is about 0.0131 above support at 1.1495 and about 0.0195
post-image
XRP-1.15%
#USAIStocksHitHard 📉 US AI Stocks Hit Hard | Is the AI Rally Losing Momentum?

US AI and semiconductor stocks are facing renewed selling pressure as investors reassess valuations, earnings expectations, and the outlook for continued AI-driven growth.

⚠️ A sharp pullback in major AI names could put further pressure on the broader tech sector and potentially spill over into crypto markets.

👀 Traders are now watching closely for key support levels, upcoming economic data, and whether institutional investors see this dip as a buying opportunity—or the beginning of a deeper correction.

🔥 Is t
post-image
NDAQ+0.28%
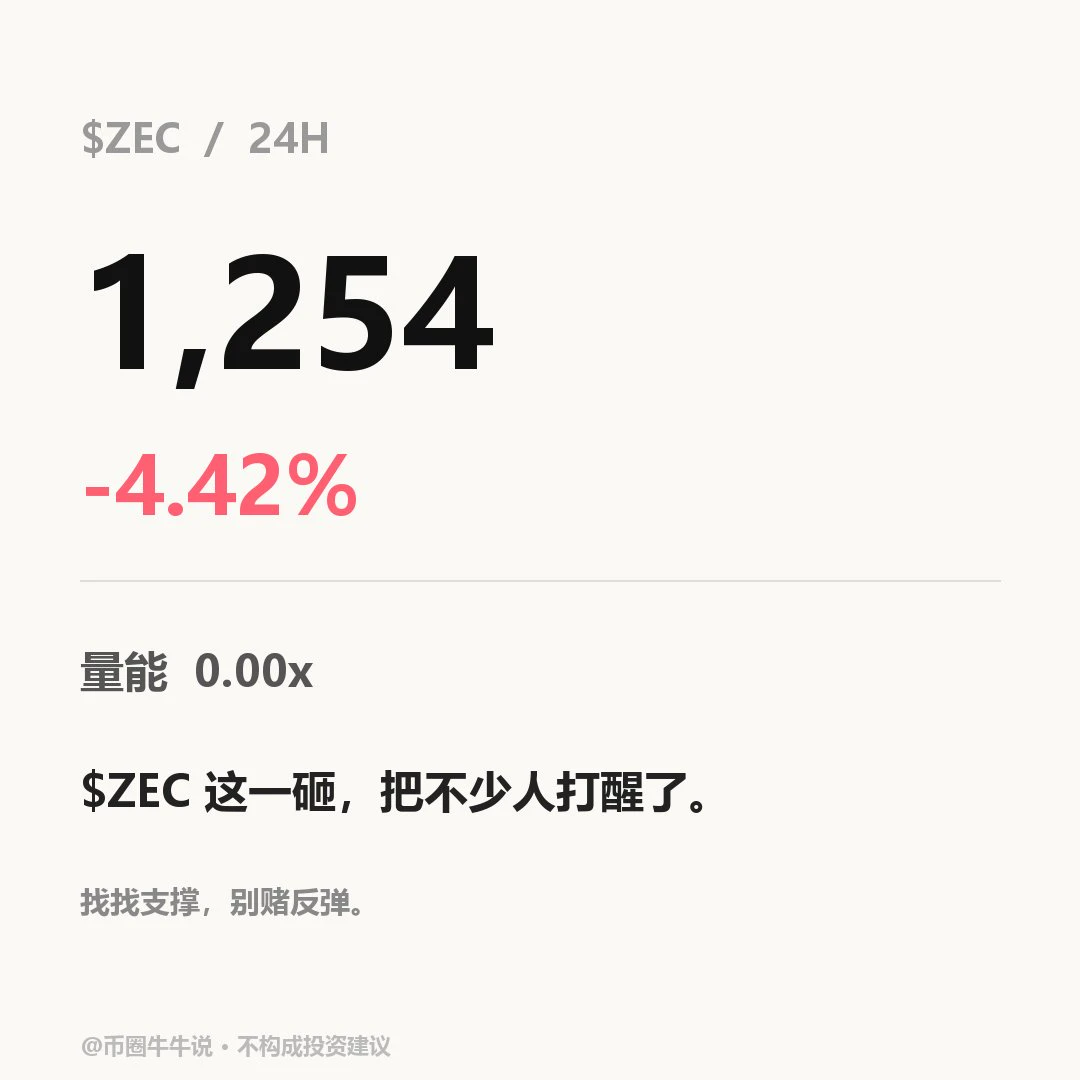
$ZEC Current price: 1254.49, 24H -4.42% (1235.00–1330.10). 1H is weak, with RSI at 47.65 and EMA20 at 1268.17; support at 1235.00 and resistance at 1330.1. 4H is weak, with RSI at 44.52 and EMA20 at 1279.93; support at 1213.56 and resistance at 1387.89. A move higher only matters if price holds above the 1330.1 resistance level; a break below the 1235.00 support level would signal further weakness. Review whether price held above 1330.1 and recovered after losing 1235; volume is only 0.00x, so the setup is invalid without confirmation of participation. Market volatility is high; for observatio
post-image
ZEC+1.16%
SanDisk, Micron, or SK Hynix? If I could buy only one AI storage stock, which would I put my money into?

If you were given a sum of money right now and could choose only one of SanDisk, Micron, and SK Hynix, which would you pick?
This question is a bit like choosing a partner: SanDisk is passionate, Micron is more well-rounded, and SK Hynix is the technical type.
First, SanDisk. It focuses mainly on NAND flash and enterprise SSDs. AI data centers need large amounts of high-speed storage, so as demand grows, the company’s earnings could show considerable upside. But the risks are clear, too: N
MU+4.71%
  • 41
Load More

Join 40 M users in our growing community

⚡️ Join 40 M users in the crypto craze discussion

💬 Engage with your favorite top creators

👍 See what interests you

Trending Topics

USCPIDataIncoming

2.71k Views1.5k Discussing

The U.S. October CPI report will be released on November 10 at 8:30 a.m. ET. September CPI came in at 3.7% year over year, and markets will be watching closely for signs that inflation is cooling, especially in core CPI. A softer-than-expected reading could strengthen rate-cut expectations, while hotter inflation may pressure risk assets through higher Treasury yields and a stronger dollar. How do you think this CPI print will move $BTC, U.S. stocks and gold?

USAIStocksHitHard

24.25k Views3.7k Discussing

USNonfarmPayrolls

42.24k Views4.41k Discussing

View More