






Square
Following
Hot
News
Notifications
Profile
Share your thoughts
placeholder
Article
Can't you meet it?😂
Friday, how should we respond to continued market pressure?
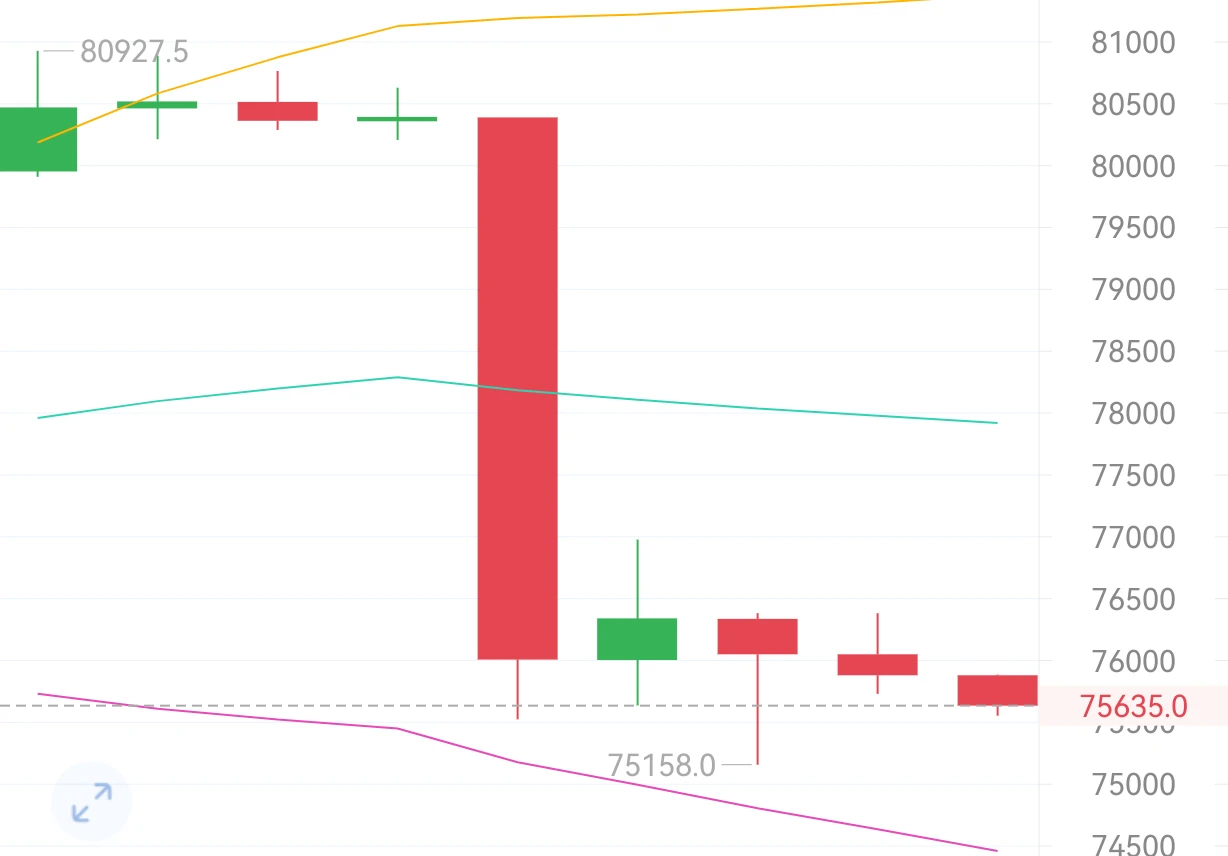
On the 4-hour chart, after consecutive corrections, the overall trend remains weak, but the decline has failed to extend further. Bollinger Bands are moving sideways; MACD has formed a bullish crossover and is moving up, while the three KDJ lines are diverging downward in a bearish formation, showing clear disagreement between bullish and bearish indicators. The current price is in a low range, with no signs of further downside for now. After a short-term wick rebound, we are temporarily not bearish and expect a slight continued rebo
post-image
BTC-0.67%
Trenches
fxUSD
f
bade
b
fxUSD
0x08...d8f6
Market Cap
$.
Change
.
24h Vol
$.
Holders
.
ZIG
Z
bade
b
ZIG
0x8c...1145
Market Cap
$.
Change
.
24h Vol
$.
Holders
.
BTC
B
bade
b
BTC
C5xp...pump
Market Cap
$.
Change
.
24h Vol
$.
Holders
.
STONK
S
bade
b
STONK
6GmA...UNgx
Market Cap
$.
Change
.
24h Vol
$.
Holders
.
CORLA
C
bade
b
CORLA
0xba...7777
Market Cap
$.
Change
.
24h Vol
$.
Holders
.
Lent my best friend several hundred thousand.
Went to ask for the money back and was beaten badly enough to end up in the hospital.
Lending money to others is a very foolish thing to do.
post-image
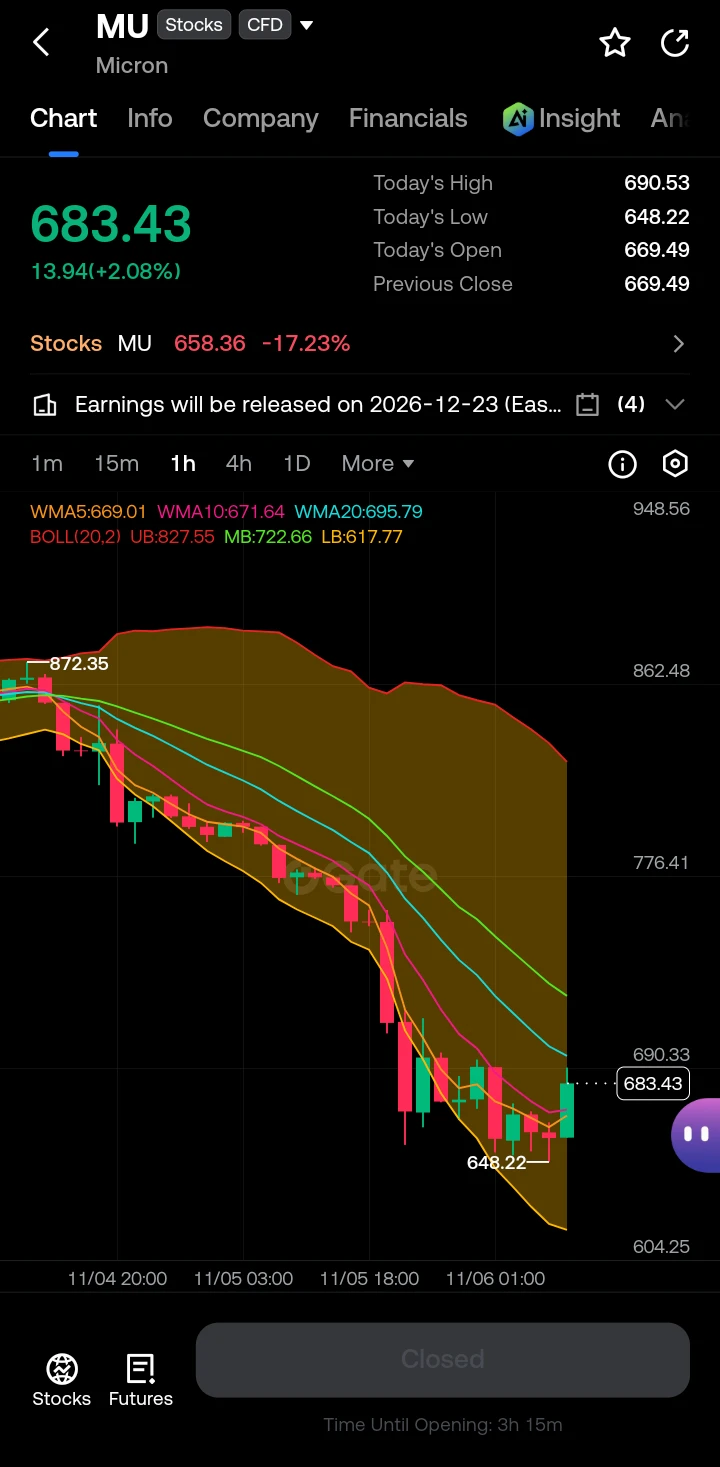
$MU ‌

Technical Breakdown: Analyzing Micron’s (MU) Sharp Correction

The chart for Micron Technology (MU) currently displays a textbook example of a powerful downtrend and subsequent consolidation. For technical traders, this price action offers several clear signals regarding market momentum and potential support levels.

Let’s break down the current chart structure, examining the moving averages, Bollinger Bands, and recent candlestick formations.

1. The Initial Breakdown and Downtrend

The most prominent feature of this chart is the steep, multi-day decline originating from the highs nea
post-image
MU-17.23%
  • 3
  • 1
$AKE Selling signals are gradually weakening. This rally is probably squeezing FOMO shorts chasing the downside—let’s make enough for a bowl of pho, brothers!🤩$UAI $ARIA
post-image
AKE+6.07%
UAI-7.58%
ARIA+22.03%
  • 1
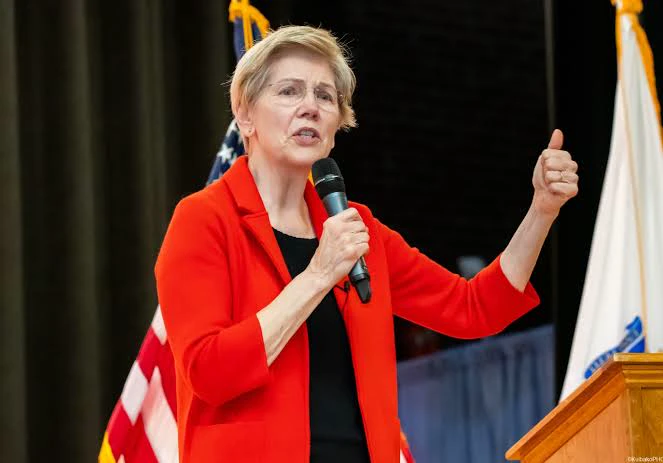
🚨 JUST IN: 🇺🇸 Elizabeth Warren is expected to lead the powerful Senate Banking Committee after Democrats retake control of Congress.
The longtime crypto critic could have major influence over US crypto regulations, Wall Street oversight, and Trump’s crypto ventures.
A potential major headwind for the US crypto industry.
#Crypto #Bitcoin #ElizabethWarren
post-image
BTC-0.67%
  • 1
#USStocksFaceHistoricSelloff

The US stock market is facing a historic selloff, creating uncertainty and concern among investors. Major stocks are under pressure, and market volatility is becoming an important topic for traders around the world.

A major market selloff can happen when investors become worried about economic conditions, company earnings, interest rates, or future market growth. When confidence becomes weak, many investors choose to reduce their positions, which can increase selling pressure across the market.

This situation reminds us that financi
330U Copy Trading Experiment | Day 30

I smart-copied a top trader's trades!
Come take a look (^v^)
Starting capital: 330U; current funds: 435.76U; return: 153.26%. (400U has been withdrawn during this period)

Just a quick update today:

Currently flat, waiting for Aoying's next trade.
My hands are idle, but my eyes are on the market, waiting for a signal.

Keep it up, guys!
Believe in the power of belief! 🦅
post-image
  • 2
November 6 $BTC Analysis
Everyone who followed along and traded yesterday’s door-shaped move must have been thrilled, right? A pump with no reason behind it is just a bubble. The bottom of this bear market will most likely arrive in November 2026. We’re currently at the end of the time window, not the beginning. More importantly, there’s the rate path: the market has never stopped betting on the Fed pivoting to rate cuts. Once dovish signals are confirmed, the historical pattern of liquidity flowing back into crypto assets still holds. In other words, the macro factors weighing on prices are
post-image
BTC-0.67%
💰 Your stock insights deserve rewards—and to be seen
What signals do you look for when you’re bullish on a company? What concerns make you decide to keep waiting?

Join Gate Square’s stock discussion season to share your views and the reasoning behind them.
🌟 Each day, 3 quality creators will be selected to receive 5 USDT each, plus official featured placement to help more people see their valuable content.

Selection isn’t based on correctly predicting price movements or the number of posts. Well-supported opinions, valuable observations, and thoughtful reviews all have a chance to be selec
GateSquare
💰 Your stock insights deserve rewards—and to be seen
What signals do you look for when you’re bullish on a company? What concerns make you decide to keep waiting?

Join Gate Square’s stock discussion season to share your views and the reasoning behind them.
🌟 Each day, 3 quality creators will be selected to receive 5 USDT each, plus official featured placement to help more people see their valuable content.

Selection isn’t based on correctly predicting price movements or the number of posts. Well-supported opinions, valuable observations, and thoughtful reviews all have a chance to be selected.

Sign up first, then #Gate股票畅聊季 publish original content👇
👉 Sign up now:
https://www.gate.com/campaigns/6898
📄 Event details:
https://www.gate.com/announcements/article/102611

repost-content-media
  • 3
  • 2
btc next move
live-cover
LIVE1,624
Alright, now we know the economic environment is bad 😓
$SOXL It's nearly matching Ethereum's transaction volume—just how many people are buying the dip
post-image
SOXL-1.16%
#USTechSelloff 👀

Is artificial intelligence shifting from infrastructure to application?

Are the markets experiencing the growing pains of a transition from the infrastructure phase of the AI revolution to the application and profitability phase? The Nasdaq’s historic 5.52% single-day drop is not merely a panic sell-off; it also signals a rotation of capital away from the "chips and data centers" narrative toward software giants that generate actual revenue and profit. During this transitional period, defining a clear strategy ahead of critical macroeconomic data releases is more important
Gate_Square
🤖 AI Stocks Sell Off — Could AI Applications Lead the Next Rally?

AI chip, server, and data center stocks are under pressure as investors question massive AI spending and stretched valuations.

But the AI story is far from over.

The focus is shifting from AI infrastructure spending to real revenue and profits.

🔍 Google: AI Search & advertising revenue

☁️ Microsoft & Amazon: Cloud and AI monetization

🚀 Meta, Palantir & Oracle: Enterprise AI growth

If capital rotates from AI infrastructure to applications, which company could lead the rebound?

Share your stock picks, market outlook, or trading strategy on Gate Square with #USTechSelloff.

🎁 Gate's AI Applications Trading Event is live. Trade eligible AI and cloud stocks for chances to win rewards, including up to 1,888 USDT in Google stock trial funds.

👉 Event link: https://www.gate.com/campaigns/6916
repost-content-media
MU-17.23%
NVDA-9.33%
AMD-17.64%
SNDK-22.24%
NAS100+1.17%
  • 13
  • 1
If everyone opens short positions at market, the bearish trend will take shape in about an hour or two
post-image
  • 2
⚠️ U.S. nonfarm payrolls data will be released tonight at 21:30!
post-image
Damn, trading really is brutal.
Even with a win rate above 80%, after dozens or hundreds of consecutive wins and all the profits you've built up, one moment of getting carried away, one decision to hold a losing position, one emotional trade can wipe it all out.
I just saw the data for this strategy: over 7 days, the blogger's own account appeared profitable, while copy traders collectively lost 270k U.
Behind the illusion of a high win rate are lopsided risk-reward ratios, holding losing positions, and oversized bets—one big loss wipes out countless small wins. How many people have endured co
post-image
Long-term market outlook reference

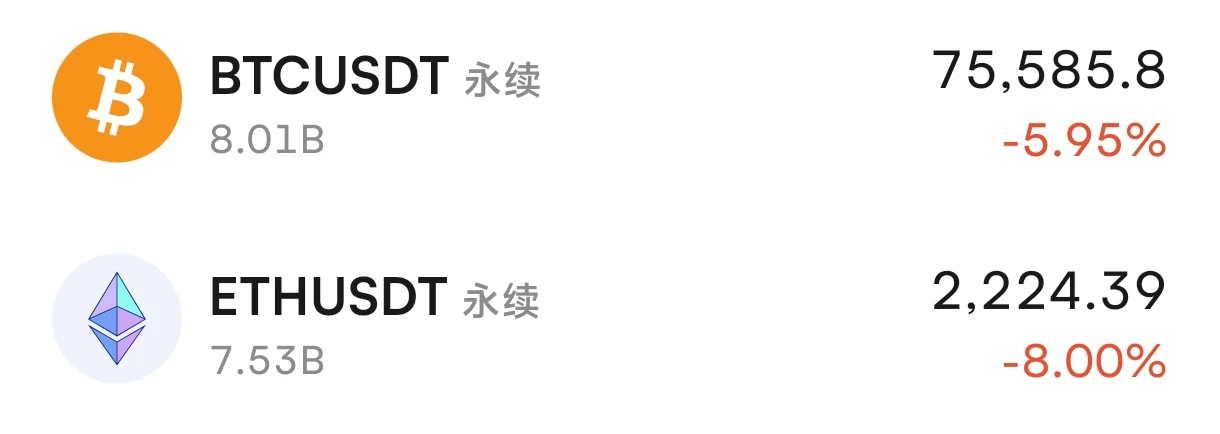
BTC currently at 75585.1, ETH currently at 2221.00
Both major assets have completed a pullback after a rally over the larger time frame. This is a cyclical consolidation following an upswing; the long-term bottom structure remains intact, and downside room is gradually narrowing, making it unsuitable to chase shorts. Wait for a retest of the long-term support zone and, once signs of stabilization emerge, build a core position in batches to position for a new upward trend.

Long-term strategy: scale in on pullbacks
BTC: wait for a pullback to 73000‑74500; fir
BTC-0.67%
ETH-1.26%
Load More

Join 40 M users in our growing community

⚡️ Join 40 M users in the crypto craze discussion

💬 Engage with your favorite top creators

👍 See what interests you

Trending Topics

USStocksFaceHistoricSelloff

1.63k Views3.56k Discussing

U.S. stocks suffered a sharp selloff on Thursday, with the Nasdaq closing down more than 5% and the Philadelphia Semiconductor Index falling over 12%. AI and chip stocks including $NVDA and $AMD were hit especially hard. Markets are reassessing AI valuations, data-center spending and future returns. Is this just short-term deleveraging, or the start of a deeper correction in the AI trade? Which sectors are you watching next?

GateLaunchesPoSECProofOfSecurity

12.56k Views577 Discussing

USNonfarmPayrolls

9.83k Views4.01k Discussing

View More