Share your thoughts
placeholder
Article
Everyone is watching BNB, but the real move hides below 730.

$BNB /USDT - SHORT

Trade Plan:
Entry: 738.8 – 741.0
SL: 750.6
TP1: 731.9
TP2: 726.5
TP3: 718.5

Why this setup?
Why now? The daily trend is range-bound, which means BNB lacks a clear directional trend and is coiling for a breakout. The 15m RSI sits at 43.16, showing that short-term momentum is neither overbought nor oversold but leaning bearish. The 1h ATR of 4.450903 tells us the asset is expanding its hourly range, giving enough room for a decisive push. The entry zone is 738.8 to 741.0, anchored at 739.9, which is the 1h pric
post-image
BNB-1.00%
Master Ye Breaks Down This Week’s Market|PPI, CPI, and Geopolitics All in Play
9.7-9.13, this week is bound to be anything but quiet.
U.S. stocks are closed on Monday, so liquidity will thin out. Crypto may instead make an early sentiment-driven move, so don’t underestimate this kind of market.
🔴 Tuesday 23:00|New York Fed 1-Year Inflation Expectations
First, watch whether market inflation expectations are picking up again. Once expectations heat up, policy pressure will naturally follow.
🔴 Wednesday 20:15|ADP Employment
The private payrolls report takes the lead. A strong reading will boost
post-image
BTC-0.88%
Nobody is shorting the range, but SYMBOL just gave a 55% confidence setup.

$BTC /USDT - SHORT

Trade Plan:
Entry: 78712.10 – 78871.96
SL: 79559.35
TP1: 78216.54
TP2: 77832.88
TP3: 77257.39

Why this setup?
Why now? The daily trend is range, meaning the market has no clear direction, so a mean reversion short makes sense. The 1h ATR of 319.716833 shows enough volatility to reach the first target from the entry zone at 78792.03. The 15m RSI at 35.32 signals room for further downside before oversold exhaustion sets in. The invalidation level at 79370.11 is the line in the sand that separates
BTC-0.89%
🚀 CRYPTO MARKET LIVE | Real-Time Signals + BTC/ETH Trading Setups
live-cover
LIVE1,169
With this price action, I don’t even have to think—the account is partying on its own. 🤣
The last thing I saw before bed a few days ago, $ZORA was still moving sideways around 0.00793, unable to fall further or break higher. It was forming a base without breaking down—clearly a prelude to a launch. I set a long position and went to sleep, without a trace of anxiety.
When I woke up this morning, it had jumped straight to 0.0085, and +176.39% was safely locked in. Losing sleep wasn’t for nothing—I caught the rhythm, and now I feel at ease. 😏
I first banked the +176.39% profit, then set a brea
post-image
ZORA0.00%
ADA+0.91%
XRP-1.30%
-$117k—that’s the tuition I paid on Lobster at the beginning of the month. I chased in at 0.063, thinking it would surge to 0.08, but a single wick plunged to 0.049 and triggered my stop-loss. It hurt so much that I didn’t dare look at the charts for three days. But looking at today’s price action, I actually feel the opportunity is back—and this time I’m coming with data, not relying on gut feeling.
First, the market: Lobster is currently at 0.0581, down 22% in 24 hours. It moved from a high of 0.0765 to a low of 0.055, with a swing of nearly 40% and a trading volume of $51.3 million. What do
龙虾-19.78%
Nobody is talking about the hidden trap forming inside SYLX right now.

$SLX /USDT - SHORT

Trade Plan:
Entry: 0.06870 – 0.06908
SL: 0.07067
TP1: 0.06755
TP2: 0.06666
TP3: 0.06532

Why this setup?
Why now? The 1h price sits at 0.06889, perfectly inside the entry zone of 0.06870 to 0.06908, which signals a precise trigger for the SHORT bias. The 15m RSI at 40.58 confirms bearish momentum is still alive without being overextended, giving the setup room to breathe. Meanwhile, the 1h ATR of 0.000743 shows volatility is compressed enough to expect a decisive move toward TP1 at 0.06755 and eventu
SLX-0.47%
$$DOT A single huge bullish candle shot straight through 12.76%, but BTC is still playing dead, and the Fed hasn't made a damn sound tonight—is this DOT showing strength on its own, or is someone quietly accumulating? Over 24 hours, it went from 0.9512 to 1.0893, with a 14% swing and $120 million in trading volume, more than triple the usual level. I took a quick look at the on-chain data: whale addresses moved 800,000 DOT in the past two hours—not to exchanges, but into cold wallets. Seen this script before? The last similar move was ahead of the Polkadot 2.0 proposal, followed by a 40% rall
DOT+13.86%

9.8 Morning/Evening Market View (recommended 3%, 100x, total position not exceeding 5%):


🔥ETH short: Short on a wick near 2712, stop loss 32 points

ETH long: Long on a wick near 2428, stop loss 19 points


Reminder: After sweeping liquidity on Friday, the market has made a second attempt at the top, but the pullback has not yet broken below it. The market remains range-bound, so watch whether it can break upward,

and whether it breaks above 2580 or below the support level at 2428; both are key levels to watch.
post-image
ETH-0.08%
🚨 BREAKING: Hunter Biden is reportedly planning to launch his own memecoin, $LAPTOP, with the stated goal of reimbursing people who lost money on $TRUMP .
post-image
MEME+0.61%
TRUMP-2.03%
9.7 Gold Midnight Review
The late-session strategy largely played out as expected. After dipping, the price entered a corrective rebound, confirming that the anticipated support level held. The current gold price is around 4411.
Technical analysis: The 1-hour Bollinger Bands are narrowing, with gold trading above the middle band. The 30-minute Bollinger Bands are opening upward, and the KDJ indicator is operating at a high level, showing emerging short-term rebound strength. However, the overall bearish trend on the larger time frame has not been completely reversed.
Resistance above: 4420 and
post-image
GLDX+0.83%
PAXG-0.21%
market update
live-cover
LIVE1,957
The hourly chart hit the MA60, and the 2-hour chart hit the MA200. This is a good spot to take a long position. The bearish view over the past few days was due to the news, and things should have mostly adjusted by now. This trade should be held until at least this Thursday. Now let’s talk about my entry on the lower time frame: my entry was at 78886. I saw the 5-minute chart stop falling and then show bullish divergence, so I chose to enter. That’s it, class dismissed, brothers… I just posted from the wrong account…😂😂😂
Jinman’s Position-Unwinding Guide: Gold in a Wide, Choppy Range with Frequent Stop-Loss Hits? High/Low Exit Strategies Released!
Spot gold traded in a wide range on the 15-minute intraday chart. After rising to around 4438 in the morning, it quickly pulled back, hitting a session low around 4381 before rebounding to approximately 4409. With bulls and bears rapidly taking turns, chasing rallies and selling dips can easily result in trapped positions. Exit strategies for two types of trapped positions are provided below.
Long positions opened above 4430: Reduce positions first if the price rebou
post-image
BTC-0.88%
ETH-0.06%
I did nothing—just went to the restroom, and when I came back, the candlesticks had already done the work for me. $PRL That sharp drop a few days ago took it from 0.18850 all the way to 0.1361, and +543.69% in floating profit came knocking on its own. I’m honestly a little overwhelmed by the favor 😏

I watched it until the early morning. The rebound looked convincing, but the price kept grinding around 0.18850, with volume failing to follow and the rebound losing steam. Going long in this kind of setup is just providing an exit for someone else. My thinking was simple: stay bullish, but don
post-image
PRL+8.81%
SNDK+0.84%
ZEC-1.35%
A full day draws to a close; from the early session through the evening, multiple positions paid off one after another, culminating in seven consecutive intraday wins.
Endure the wait, restrain the impulse, stick to the established strategy, and put risk control before every position entry.$XAU
XAU-0.36%
I only hit refresh, and it suddenly plunged, as if I had scared it.

When it dumped intraday, this short was entered cleanly at 0.08529, for one simple reason: insufficient bids and clear overhead pressure. Just now, $LAB quickly dipped to 0.06991, and +354.59% is already showing in the account.

Close 70% first. For the remaining 30%, be sure to protect the cost basis: let the profits run if it makes new lows, but don’t give them back if it rebounds.

Panic comes from having no plan, and losses come from overthinking. Even if you only make one point, as long as you take it with you, it’s
post-image
LAB-2.97%
XRP-1.30%
SNDK+0.84%
This trend is so obvious I don’t even need to think—the account is dancing on its own 💃
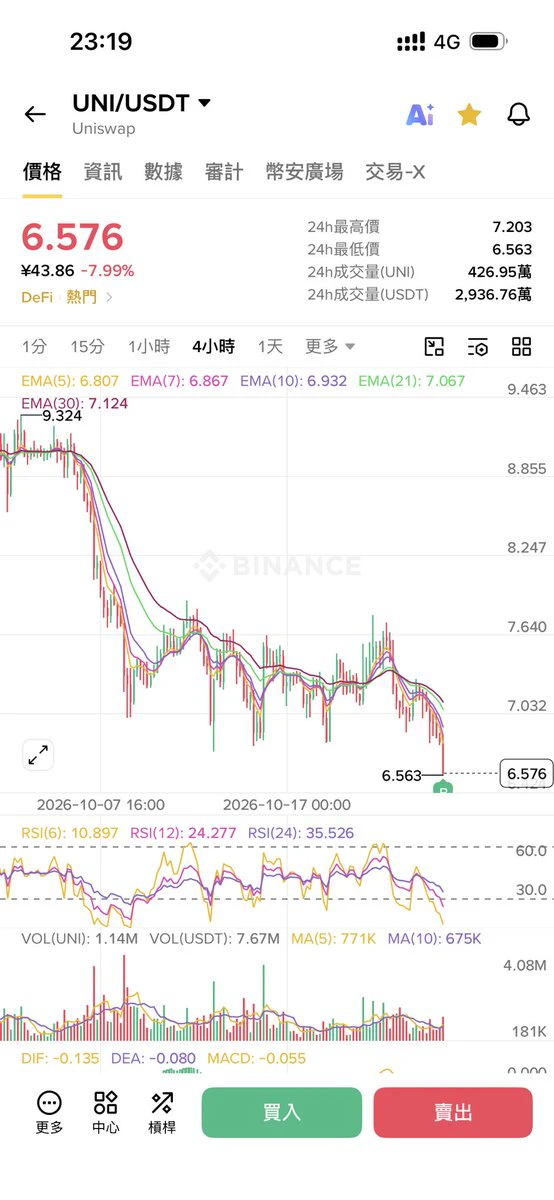
A few days ago, the last thing I saw before bed, $UNI was still bottoming out ahead, never breaking down. The candlesticks looked lifeless, but funds had actually been testing the waters in the shadows all along, and the buying pressure was already impossible to hide. Before bed, I left just one message: if there’s no volume at the bottom, just wait.
Then I opened my eyes and the market took off 🚀, surging from 4.828 to 6.848, with the position’s return jumping straight to +2970.83%. The buildup was trul
post-image
UNI-5.63%
ZEC-1.35%
DOGE+0.90%
🚨$ETH BULL FLAG IS HERE!!
ONCE THIS BREAKOUT IS DONE POST $2,600, WE CAN TARGET $3,200 STRAIGHT AWAY!!
post-image
ETH-0.06%
While I was away using the restroom, the candlestick chart had already wiped out my losses for me. A few days ago, I kept an eye on $SNDK in the early hours, watching it repeatedly bottom out around 1651.78 without breaking down. Buying support grew steadier with each defense, so I directly opened a long and signaled entry. Now the price has reached 1784.07, with the floating profit at +568.68%. This big gain was finally worth the wait.

I’ve taken 80% off the table and moved the stop-loss on the remaining 20% to the entry price for protection. If it keeps surging, I’ll hold; even if it pulls
post-image
SNDK+0.84%
ADA+0.91%
BNB-1.00%
Load More

Join 40 M users in our growing community

⚡️ Join 40 M users in the crypto craze discussion

💬 Engage with your favorite top creators

👍 See what interests you

View More