Square
Following
Hot
News
Profile
Share your thoughts
placeholder
Article
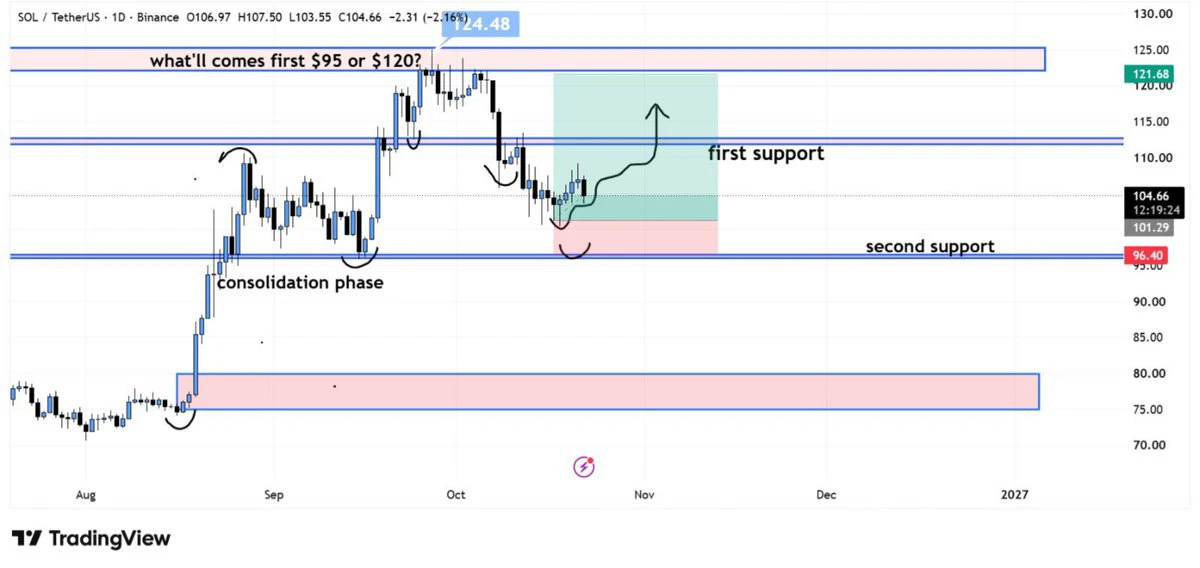
Going with the trend is the right move: long at 4163, exit at 4170, capturing a $7 range and $674!
$ETH $XAU #黄金 #Solana大升级定档
post-image
ETH+2.48%
XAU+0.75%
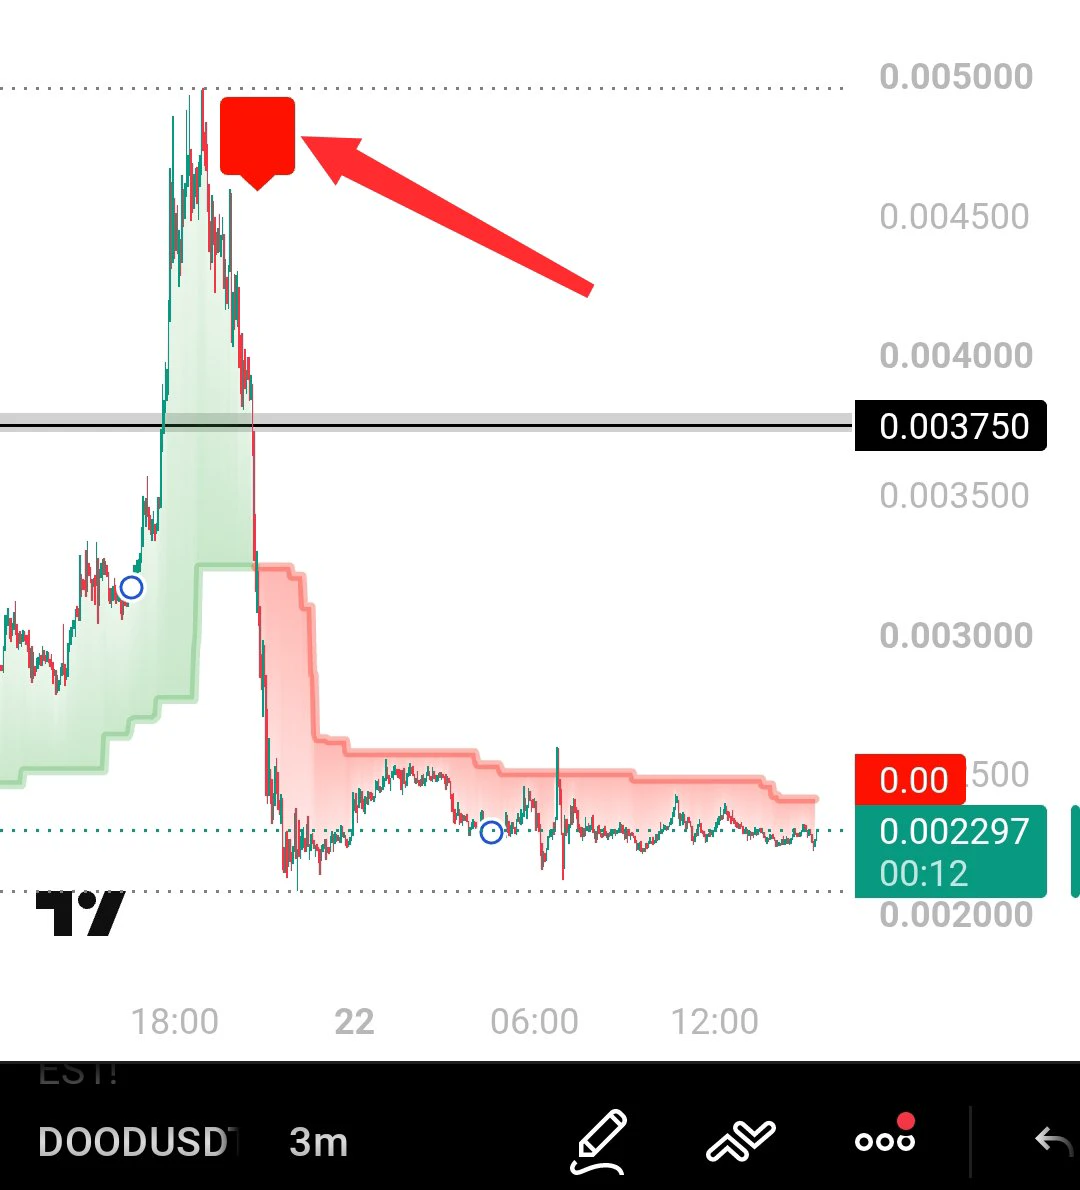
$BTW Do you understand?
post-image
BTW-13.30%
  • 1
#美股 #Gate股票 #AnthropicTurnsProfitablebutGrowthSlows Semiconductors, and I lean bullish, but only with one eye on inflation. Here are my reasons, theme by theme, using the actual results that have come out this week.
1. SEMICONDUCTORS: THE STRONGEST THEME
$TSM delivered a very big quarter. Net income rose 68.7% from a year earlier to NT$763.06 billion, a record for the sixth straight quarter, and revenue rose 50.9%. In US dollars, revenue was $46.72 billion, up 41.2% year over year. The operating margin topped the 56% to 58% range the company guided for. The outlook also looks solid: fourth-qua
post-image
TSM-1.82%
ASML+0.52%
WFC+2.27%
  • 3
  • 1
🚀 BTC REBOUNDS, NEAR SURGES NEARLY 10%! IS IT TIME TO BUY THE DIP?
Bitcoin is bouncing back from its lows, while NEAR has surged nearly 10% and altcoins are showing signs of recovery. Is this the beginning of a broader market rebound, or just a temporary bounce?
🔥 Today's Gate Livestream Discussion:
🔹 What is driving Bitcoin's recovery?
🔹 Why is NEAR Protocol gaining momentum?
🔹 Are altcoins recovering across the board?
🔹 How can traders distinguish a genuine reversal from a short-term bounce?
🔹 Which support, resistance, and volume signals should traders watch?
📊 Buy the Dip or Wait f
post-image
BTC+0.76%
  • 4
  • 1
Strive raised the proposed issuance size of SATS from $500 million two days ago to $700 million, while cutting the issue price from $100 per share to $90; the 15% annual interest rate remains based on a $100 face value, accruing and paid daily, with liquidation and dividend priority ranking below SATA (13%). The Bitcoin treasury company founded by Vivek Ramaswamy already holds more than 15k BTC and plans to prefund SATS dividends for the first 18 months.
Each $90 subscription corresponds to $100 in face value and $15 in annual interest, with the actual cash cost higher than the face value; the
post-image
ASST+3.93%
SATA-0.14%
SATS-2.26%
BTC+0.76%
🔥Gate Social Events Overview: Multiple Benefits Gathered in One Place, Join Now to Unlock Creator Rewards!
【Newcomer Events】
🔔 New Streamer Go-Live Benefits + Referral Rewards
New streamers can claim rewards as soon as they go live, and inviting streamers to join can earn you extra bonuseshttps://www.gate.com/announcements/article/102066
🎁 Weekly Rising Streamer Selection
New streamers can win exclusive rewards every week after going live, along with dedicated official traffic supporthttps://www.gate.com/announcements/article/102230
✍️ Newcomer Posting Event
Newcomers can participate by pub
post-image
GT+1.86%
  • 7
web3 developer activity just hit a 5-year low
the builders are leaving?
post-image
BTC MARKET UPDATE
live-cover
LIVE1,241
$TRX TRX at End of Multi-Year Correction, Could go to $55+
TRX has spent months in an extremely tight range within what I’m counting as wave-e of E. My volatility-compression indicator is showing extreme, persistent readings, with the current stretch approaching its historical duration record.
I’ve labeled the potential 2018–2026 correction as a triangle, although other interpretations remain possible. The more immediate focus is the contracting structure developing from the 2024 high. If this triangle is completing, the count favors an upward thrust.
The bigger question is what that triangle
post-image
TRX+1.38%
JUST IN:
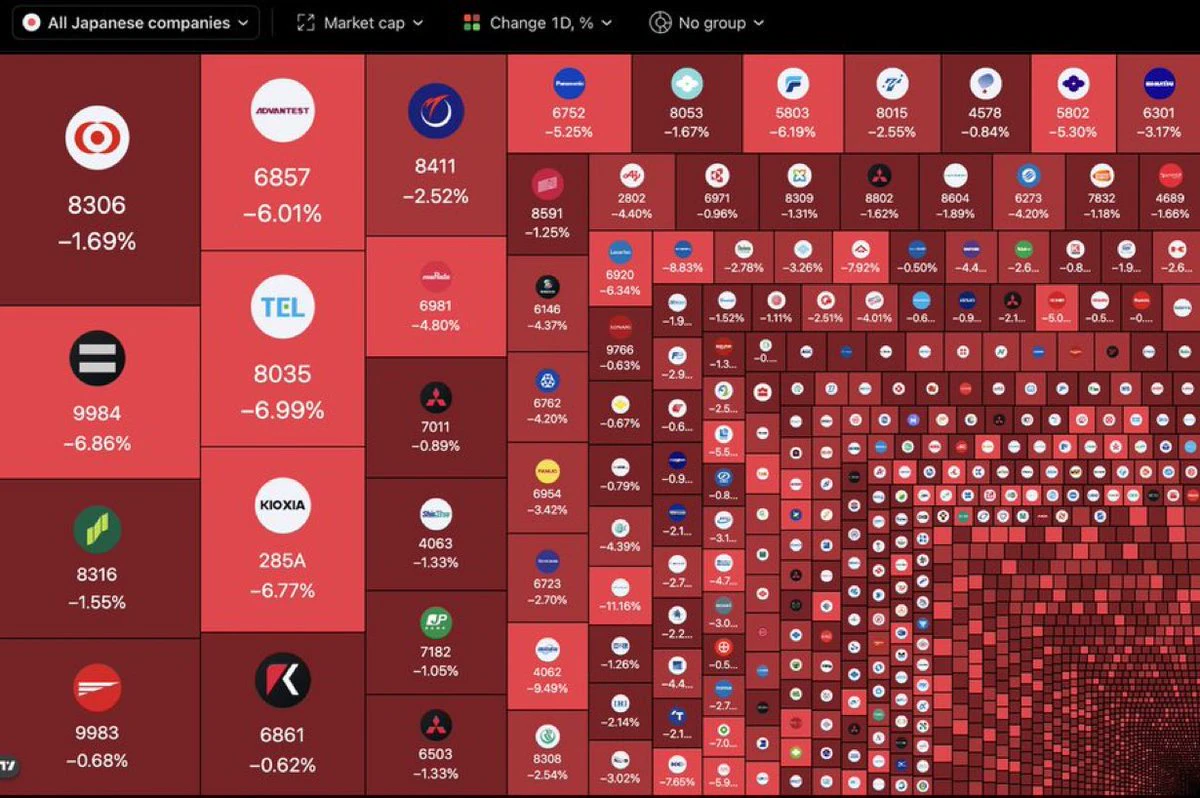
🇯🇵 6.9 magnitude earthquake in Japan.
post-image
US Initial Jobless Claims
live-cover
LIVE1,868
$PI Updates have been pretty frequent these past couple of days—four times a week. Looks like the early birds should stock up fast; a big surge is coming soon. Buy now or it'll be too late. I'm putting this on record, haha.
post-image
PI+3.05%
Many friends' relationships $intc
Currently at a potential support level
Yesterday's 4H candle closed, which is a bullish signal
If it stabilizes and consolidates here, you can buy the dip and go long
#Godiscord
post-image
INTC-2.86%
  • 1
#美国9月PPI大超预期
U.S. September PPI Comes in Much Hotter Than Expected — What Does It Mean for the Market?
Recently, I have been paying close attention to U.S. economic data because I believe inflation is one of the biggest factors influencing the direction of financial markets. The latest September Producer Price Index (PPI) report has caught my attention, as producer prices increased much more than economists expected.
According to the reported figures, U.S. PPI rose 1.3% month over month in September, while the annual increase reached 6.3%. The monthly increase was the largest since March 202
Between superintelligence, blockchain, and flying cars, there has never been a more exciting time to be alive.
  • 1
in the depth of purgatory (gigachad mode)
post-image
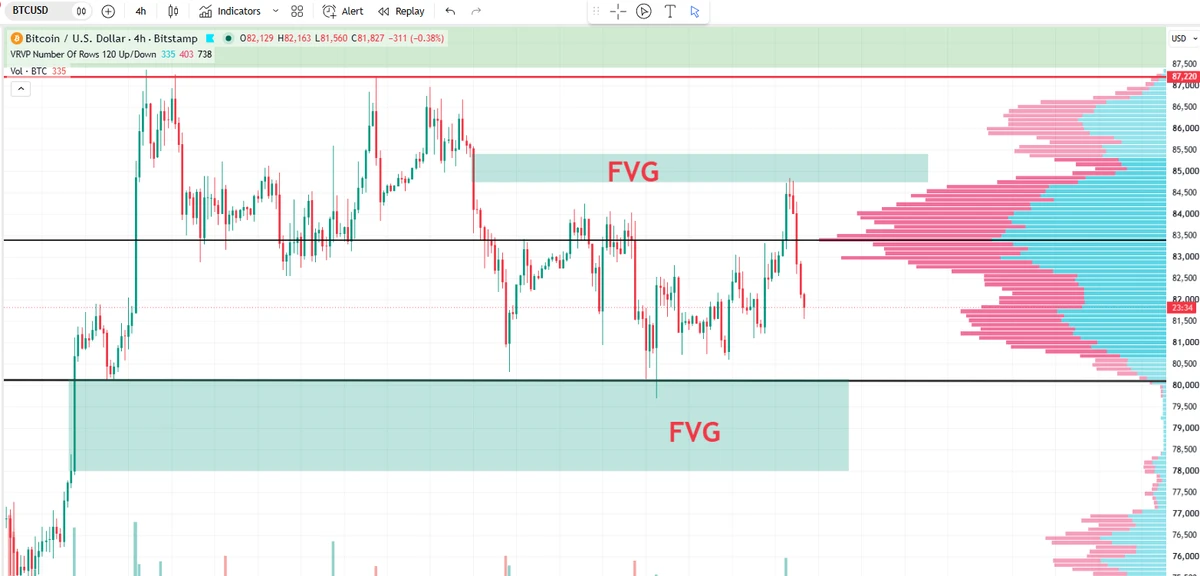
#btc On this unsettled morning, I’m still here to warn of the risks.
If 82670 breaks, the upward continuation will persist.
But! Overall, it is still heading south.
Hold firm and reinforcements will come; waiting brings the greatest rewards.
post-image
BTC+0.76%
Testing the “chase-the-pump” signals I manually put together over the past few days
Yesterday it called siren-2:native
A casual 10u chase
A true top-gainers hunter
💪🐱
SIREN+27.69%
#美国9月PPI大超预期 #每周来晒
U.S. September PPI Surprises the Market — My Take on Inflation, the Fed, and Crypto |
Whenever important U.S. economic data comes out, I like to look beyond the headline and understand what it could mean for the market. This time, the September Producer Price Index (PPI) has caught my attention because the numbers came in much higher than expected.
According to the U.S. Bureau of Labor Statistics, producer prices increased 1.3% month over month in September, while the annual increase reached 6.3%. The monthly figure was the largest increase since March 2022. Energy prices
post-image
BTC+0.76%
ETH+2.57%
#USSeptemberPPIBeatsExpectations
#USSeptemberCPIBeatsExpectations
WHY BOTH PPI AND CPI BEAT FORECAST IN SEPTEMBER 📊
US inflation data for September showed a double beat. Producer Price Index and Consumer Price Index both came in above broad market forecast. This mix shows that price pressure did not cool as fast as many had hoped, and held firm from factory gate to final consumer.
PPI tracks cost change at wholesale and factory level. CPI tracks price paid by end user. When both rise above forecast, it means cost pressure has not been fully absorbed and has partly passed to consumer side.
D
  • 6
  • 1
Load More

Join 40 M users in our growing community

⚡️ Join 40 M users in the crypto craze discussion

💬 Engage with your favorite top creators

👍 See what interests you

Trending Topics

USSeptemberPPIBeatsExpectations

91.35k Views1.9k Discussing

US September PPI came in at 6.3% YoY, well above the 5.3% market expectation, pointing to renewed producer-side inflation pressure. Weekly jobless claims were 199K, broadly in line with forecasts. Could hotter inflation further reduce room for rate cuts, and what does it mean for $BTC, US stocks, and gold?

GateWCTCS9GlobalTradingCompetition

37.87k Views6.42k Discussing

WarshIMFSpeech

62.4k Views752 Discussing

View More