Share your thoughts
placeholder
Article
SUI’s 4H map just flipped—but nobody’s watching the 0.7645 kill line.

$SUI /USDT - SHORT

Trade Plan:
Entry: 0.7940 – 0.7990
SL: 0.8205
TP1: 0.7785
TP2: 0.7666
TP3: 0.7486

Why this setup?
Range-bound 1D, yet the SHORT bias is real:
- RSI 15m at 59.22—momentum stalling, not breaking.
- Entry zone 0.7940–0.7990 is a magnet, but TP1 at 0.7785 is only 2.3% away.
- ATR 1h at 0.00998 means volatility is thin—traps are cheap to set.
Why now? The 4H structure is rejecting 0.7965 twice, and the waiting status is the tell.

Debate:
Do you trust the 55% confidence SHORT, or is that 0.8205 s
SUI+6.64%
A few days ago, I was still calculating whether I had enough money for instant noodles this month. This morning, I was already wondering whether to add sausage. All I can say is, $PENDLE really knows how to treat people. A few days ago, I took a look before bed. It had been moving sideways at the bottom for so long, with volume continuously shrinking and going nowhere. Based on experience, a setup like this is building strength; only a breakdown counts as admitting defeat, and staying flat without moving before a breakdown is the best move. And what happened? It really got back up on its own.
post-image
PENDLE+1.21%
ZEC+2.53%
ETH+0.04%
BITCOIN: LIQUIDITY SWEEP OR BREAKOUT?
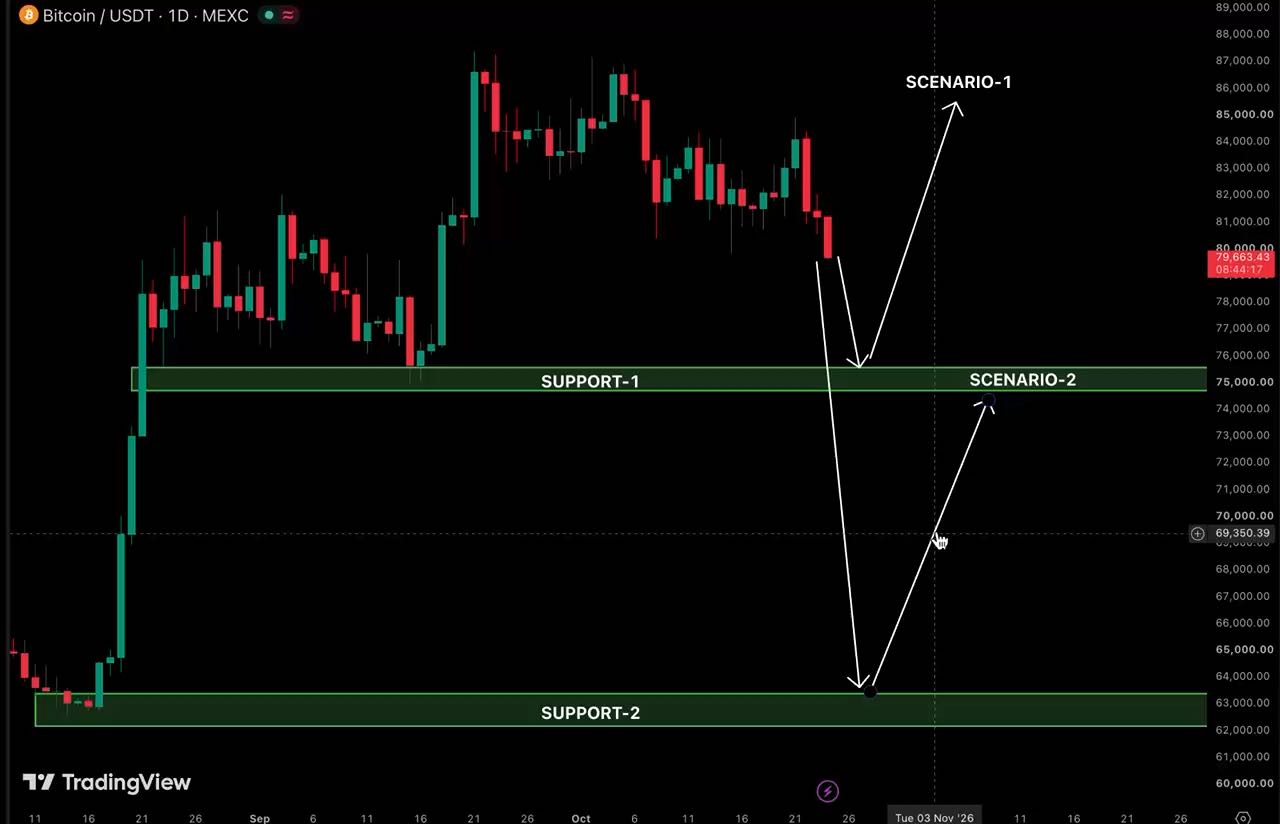
BTC is testing the $82K area, and this is where things get interesting.
The push above the previous highs could be a classic liquidity sweep.
Bitcoin takes the highs → late buyers enter → liquidity builds → price potentially reverses.
I’m not trying to catch the exact top or bottom. I’m already heavily positioned and have taken significant profits from this move.
Now I’m watching the reaction.
📉 IF BTC PULLS BACK
First level: $76K
Deeper demand: $70K–$73K
A correction into these zones would still be compatible with the larger bullish trend.
The market cou
post-image
BTC+0.54%
#GateEventContractTradeSharingChallenge #ETH
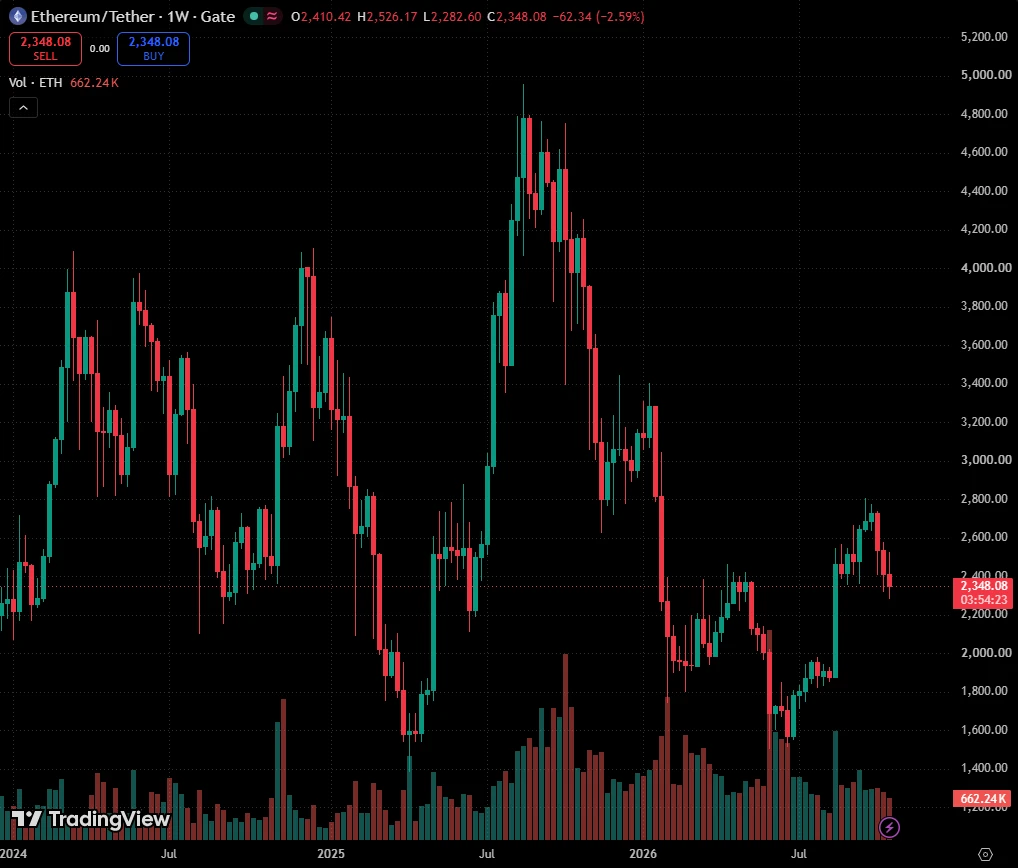
ETH is currently around $2,452, and this is becoming a very important decision zone for ETH traders. After recovering from the lower levels of the recent seven-day range, ETH is now approaching the psychological $2,500 level and the much more important $2,550–$2,560 resistance zone. From $2,452, a move to $2,500 would give roughly +2.0%, while a breakout toward $2,560 would mean around +4.4%. The real question now is whether ETH can finally break this ceiling and start another powerful upside leg.
The seven-day chart is showing a recovery and cons
post-image
ETH+0.04%
JUST IN: deploys its HIP-4 DEX on Hyperliquid, with on-chain data confirming completion at 21:15 Beijing time on Sep 5. Could signal tighter liquidity paths as users migrate to HIP-4 on Hyperliquid. $TRADEX (if applicable)
post-image
HYPE+0.75%
run it back on @base
post-image
8.31-9.4 Weekly Live Trading Record
$BTC gained 11,704 points this week, while $ETH gained 445 points
The Fed's dovish speech on Thursday and developments surrounding the GENIUS Act, among other events, caused a spike to highs of 82282.8 and 2547. However, on Friday, the nonfarm payrolls data came in above expectations, weighing on stablecoins, and prices fell back at 20:30 Beijing time, once dropping to 78618.1 and 2430.67. The market moved significantly on Thursday and Friday, providing more trading opportunities and making profits easy to come by.
#美国8月非农超预期
The good news is that BTC bro
post-image
BTC+0.42%
ETH+0.04%
$MARSCOIN short got closed by stop-loss over night.
Building new one between 0.23 and 0.25.
Structure still very bullish, but looking at L/S ratio nobody believes it's real. Longs taking profits, shorts being opened.
Still token is highly manipulated and can easily go for another pump, so put stop loss tight.
Entry 0.23-0.25 zone
SL 0.2643
#MARSCOIN
post-image
MARSCOIN+31.45%
gm☕️happy wknd
post-image
#NVDA
NVDA AFTER THE NFP SHOCK: AI MOMENTUM VS FED PRESSURE 👀
The August U.S. Nonfarm Payrolls report has changed the short-term market narrative. U.S. payrolls increased by 162,000, far above expectations, and the stronger-than-expected labor market immediately forced traders to rethink the Federal Reserve’s next move. Treasury yields moved higher, rate expectations became more hawkish, and U.S. equities initially came under pressure.
But NVIDIA is a different story.
The big question for NVDA now is not simply whether the Fed is becoming more hawkish. The real question is whether macro pres
post-image
🚨 $DASH /USDT PARABOLIC IMPULSE & CONSOLIDATION
📊 TRADE SETUP OVERVIEW
Pair: $DASH /USDT
Direction: LONG / BUY
Leverage (Futures): 3x – 5x
🎯 KEY LEVELS & SIGNAL PARAMS
Entry Zone: $65.00 – $68.00
Take-Profit Targets:
🎯 TP1: $73.90
🎯 TP2: $78.30
🎯 TP3: $85.00
Stop-Loss (SL): $56.50
$DASH ‌#Gate60MillionUsers
post-image
DASH+36.36%
  • 8
Name a #memecoin that you think can do #100x in just one year: ⁉️
post-image
MEME+6.57%
#Gate60MillionUsers
I joined Gate in 2022, and honestly, I had no idea how much that first trade would become a part of my crypto journey.
My first trade was on DOGE. 🐕 At the time, I was still trying to understand how everything worked. Charts looked complicated, candles seemed to move for no reason, and I was constantly asking myself whether I was making the right decision.
I remember opening the chart again and again after entering the trade. 😂 A small price movement felt like a major event. If DOGE went up, I felt like I had made the perfect decision. If it went down, suddenly I became
post-image
DOGE+3.35%
$AIXBT LONG TRADE
ENTRY: 0.02192
TARGET: 0.02745
STOPLOSS: 0.02118
post-image
AIXBT+14.00%
If your principal only doubles in a year but does so every year, which do you think is better: that or going all-in with a heavy position?
post-image
#MU
MU Market Analysis — Can Micron Push Beyond $1,000 Again?
Micron Technology (MU) has delivered a powerful recovery and is once again trading around the psychologically important $1,000 level. Your reference price is $1,011, while the latest market data shows MU closing around $1,016.59 after a strong 6.03% daily move. The stock reached an intraday high near $1,018.06 after opening around $973.80, showing that buyers were willing to aggressively defend the lower levels and chase momentum higher.
The most important point right now is that MU has reclaimed the $1,000 psychological zone. Frid
post-image
Everyone's staring at XLM's 4h chart, but the real signal is hiding in a range that's about to break.

$XLM /USDT - SHORT

Trade Plan:
Entry: 0.18328 – 0.18402
SL: 0.18719
TP1: 0.18100
TP2: 0.17923
TP3: 0.17657

Why this setup?
The 1D trend is *range*, not trend—so this isn't a momentum play. RSI 15m at 54.15 shows zero urgency, while ATR 1h (0.001474) is thin. Why now? Price is pinned at 0.18365, with a SHORT bias at 55% confidence. The invalidation line at 0.18175 is the trapdoor—if we lose that, the short thesis dies. But if we hold, TP1 (0.18100) is just 1.4% away, and TP3 (0.17657) off
XLM+1.88%
$BULLA Signal】Long + support amid elevated funding rates
$BULLA Funding rate 0.1186%, 4H Bollinger Band spread 0.0040~0.0635, 1H price fell from 0.0819 to 0.0603. The current price is entering the 0.06015~0.06030 support zone.
🎯Direction: Long
⚡Entry/limit order: 0.06011511 - 0.06029600
🛑Stop loss: 0.05728120
🚀Target 1: 0.06481820
🚀Target 2: 0.06707930
🛡️Trade management:
- Reduce the position by 50% at Target 1 and raise the stop loss to breakeven. Continue holding if the pullback does not break the entry zone; exit if it falls below 0.0601.
The 1H MACD histogram is narrowing, while the
post-image
BULLA+58.49%
BTC+0.54%
ETH+0.04%
SOL+1.50%
BTC Remains Range-Bound! Glassnode Flags $83K–$86K as Key Resistance. How Much Upside Is Left After
live-cover
LIVE1,485
Load More

Join 40 M users in our growing community

⚡️ Join 40 M users in the crypto craze discussion

💬 Engage with your favorite top creators

👍 See what interests you

View More