Square
Following
Hot
News
Profile
Share your thoughts
placeholder
Article
📊 Two P2P Strategies for Moving Bolivars with a Plan (and No Promises)
Trading USDT/VES requires a plan and risk management. A recent summary outlines two strategies for moving bolivars in Venezuela’s P2P market, and it’s worth reading them in the local context: they’re frameworks, not profit formulas.
The first strategy is about discipline before you trade: define your minimum spread and calculate fees before posting an order. The estimated result depends on the spread, fees, and the current exchange rate, so measuring beforehand is what separates an orderly trade from an improvised one.
The
post-image
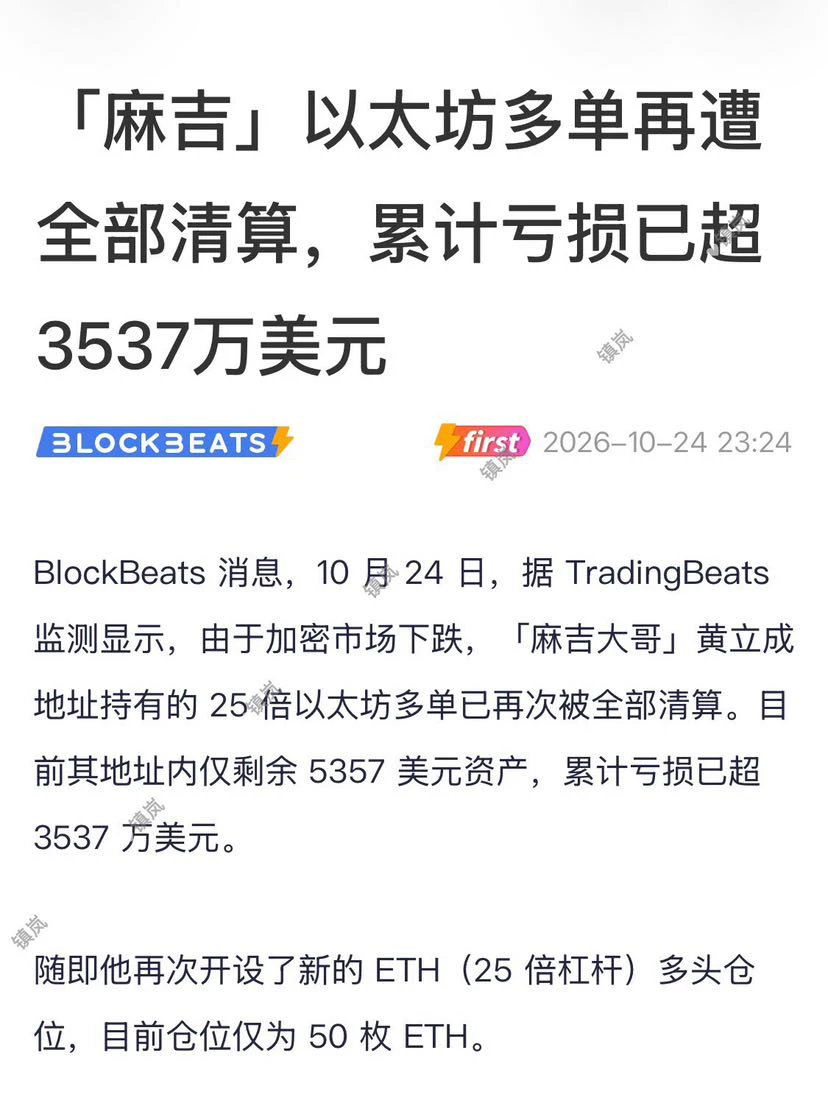
Machi Big Brother’s latest move gives me chills. His 25x $ETH long position was completely liquidated, leaving just over $5,000 in his account, with cumulative losses topping $30 million. Yet he didn’t even pause for breath before opening another 25x position. He’s now holding 50 ETH, moving so fast you’d think he’d never been liquidated.
This isn’t trading anymore—it’s a full-blown gambler’s mindset. Either he’s almost out of bullets and is betting his last scraps on a comeback, or he’s falling for the gambler’s fallacy, thinking that after losing so many times, this time has to be the rebou
post-image
ETH+1.04%
BTC+0.40%
  • 1
Trenches
STONK
S
bade
b
STONK
6GmA...UNgx
Market Cap
$.
Change
.
24h Vol
$.
Holders
.
BTC
B
bade
b
BTC
C5xp...pump
Market Cap
$.
Change
.
24h Vol
$
Holders
.
CNPY
C
bade
b
CNPY
0xc6...ddd2
Market Cap
$.
Change
.
24h Vol
$.
Holders
.
ZIG
Z
bade
b
ZIG
0x8c...1145
Market Cap
$.
Change
.
24h Vol
$.
Holders
.
Q
Q
bade
b
Q
0xc0...0589
Market Cap
$.
Change
.
24h Vol
$.
Holders
.
Before opening a position, I always make sure my notes clearly answer three questions; if even one is missing, I don't act:
First, why am I entering, and at what point will I admit I'm wrong? Am I going long because the price has hit key support, or because it has just broken through resistance on heavy volume? Where is the invalidation point for that rationale? Once the price reaches that level, it means my judgment was wrong. Regardless of profit or loss, I don't make excuses—I exit immediately and never bargain with the market.
Second, are the odds on this trade worth it? If the stop-loss d
post-image
ETH+1.04%
SOL+0.92%
If your AI needs to hire another AI, how does it pay?
It can't swipe a credit card or sign a contract.
@termix_ai BNB Chain's answer:
1 Accept the quote; funds are locked in on-chain escrow
2 Deliver the work; the hash goes on-chain, and payment is released
3 Dispute? A random panel of 3 reviewers decides
4 Settlement complete; reputation is recorded on-chain
AI hires AI; the rules are handled by code.
➙
post-image
BNB+1.93%
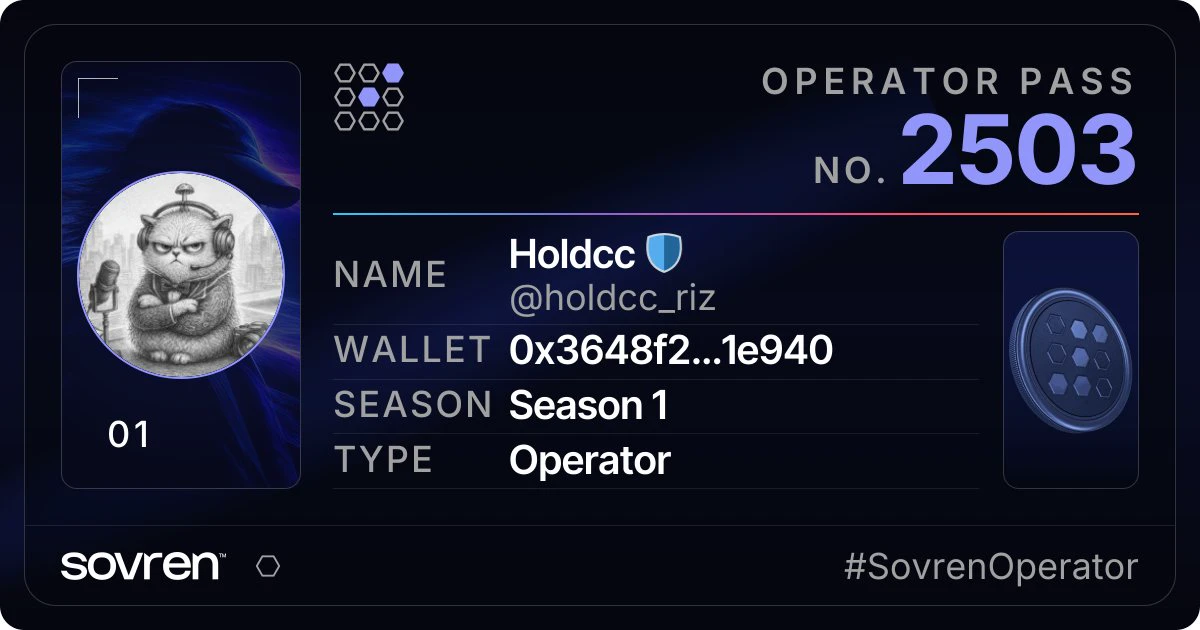
#SovrenContest Operator Pass No. 2503. Issued once, in order.
#SovrenOperator
post-image
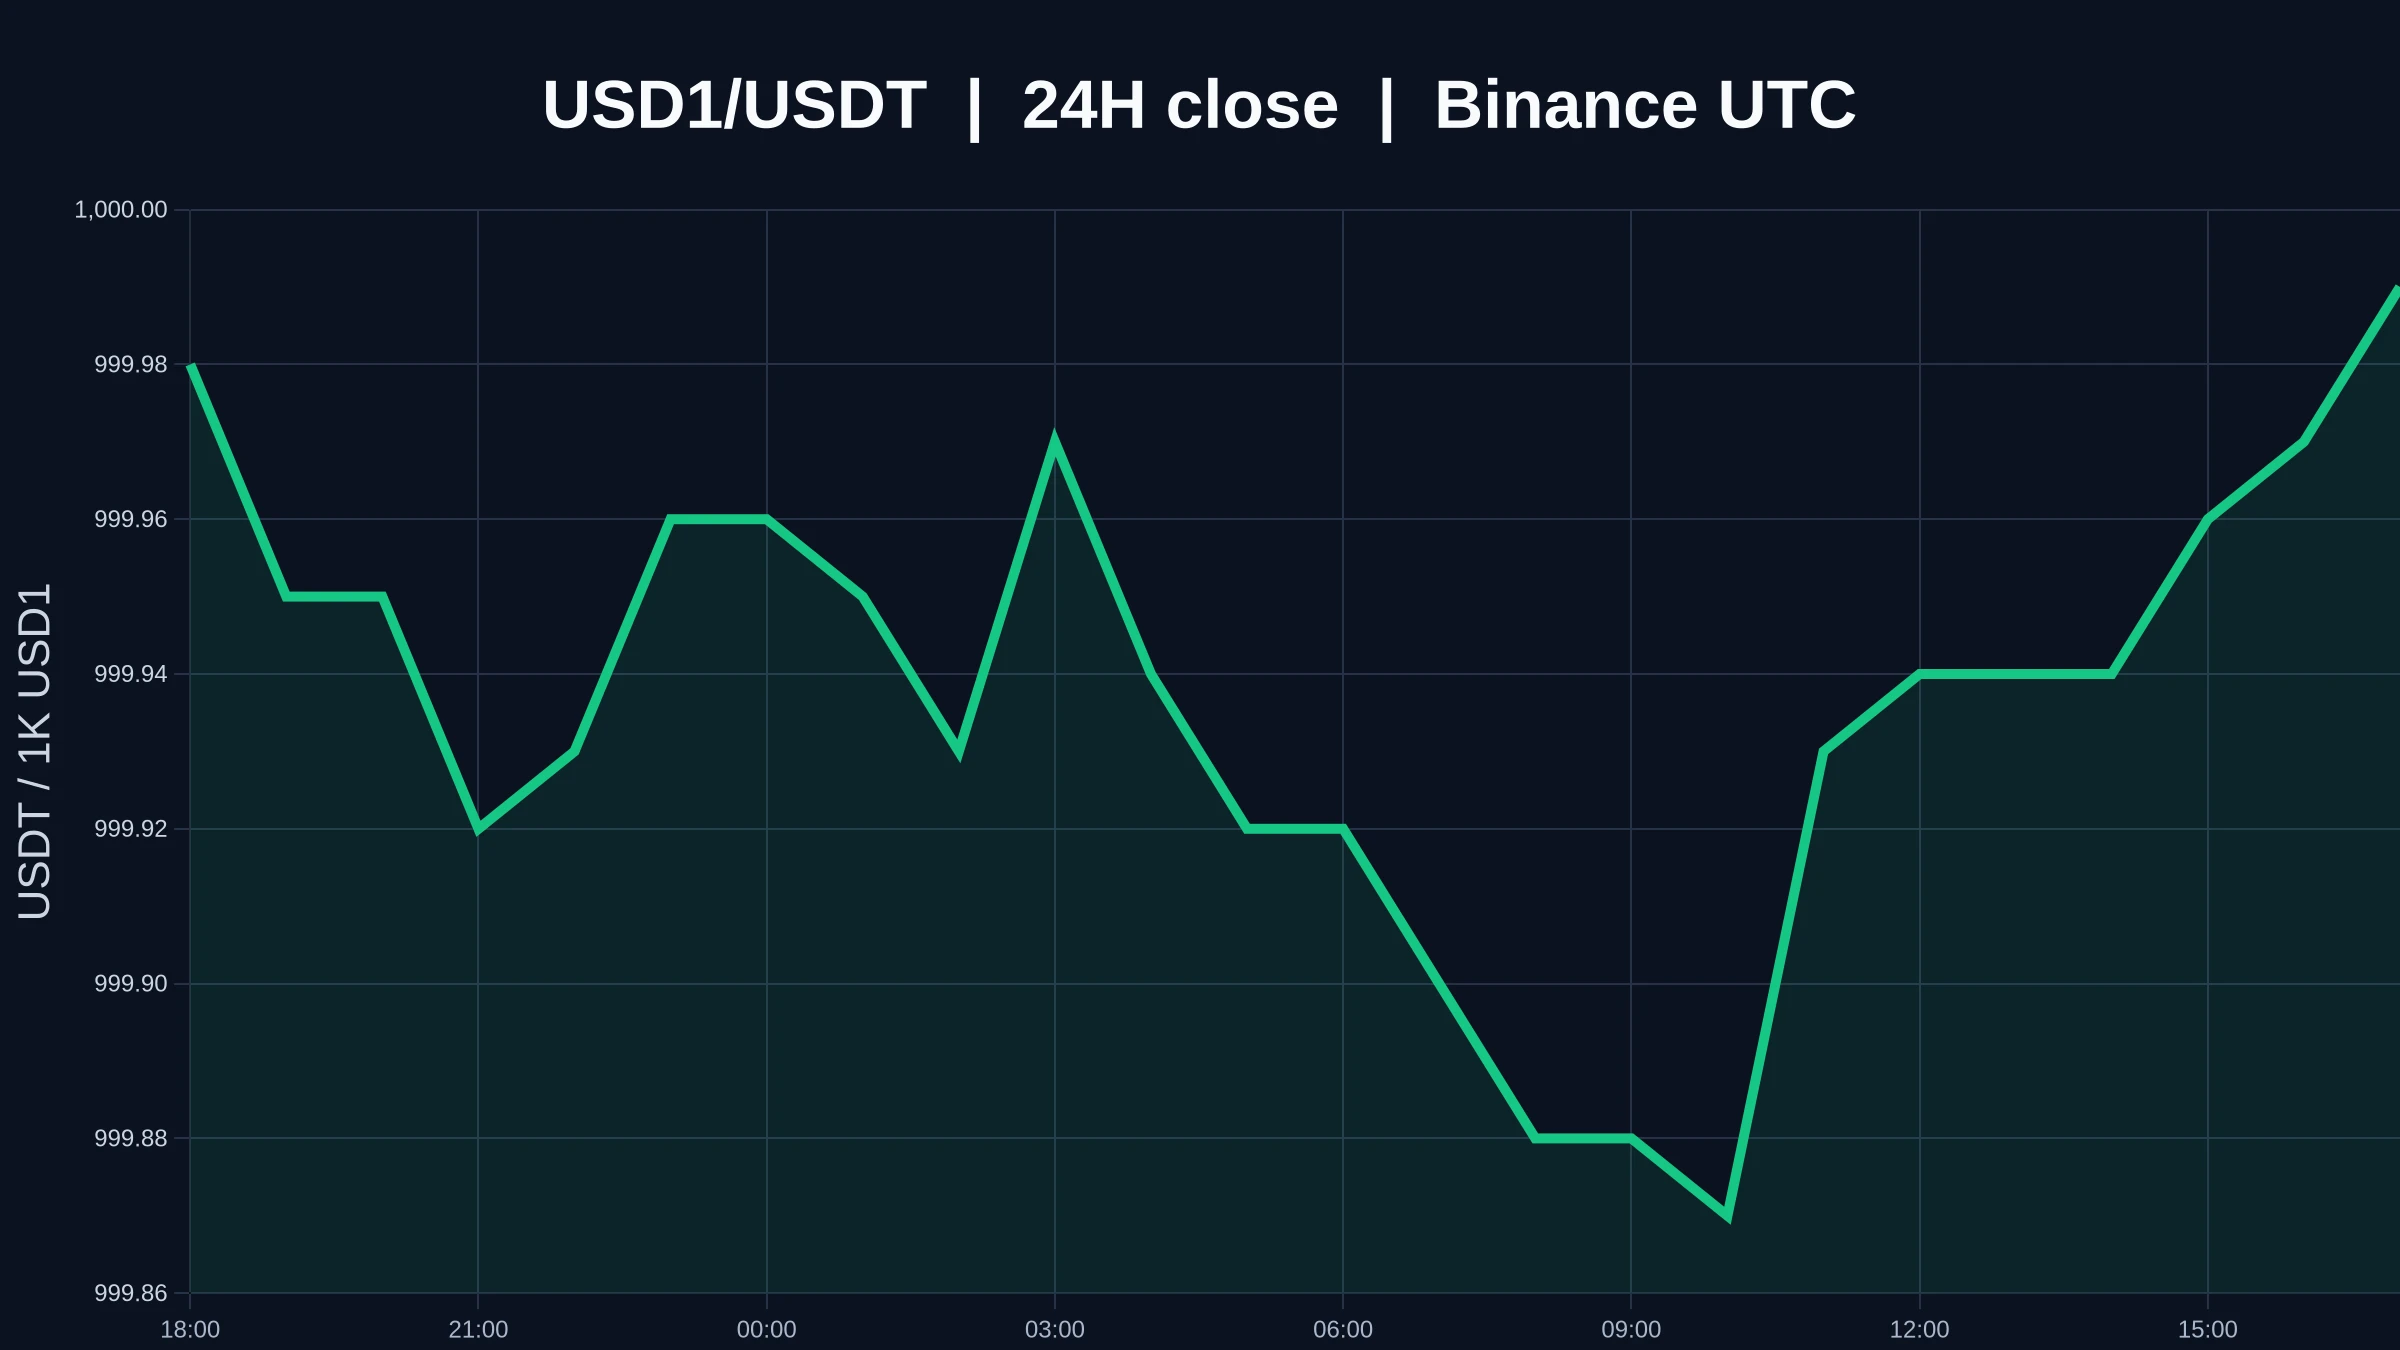
$USD1 is currently priced at 0.99998, up +0.00% over 24 hours, with volume at 0.99 times the average of the last 20 candles. Taken together, these figures show $USD1 at resistance, making it essential to clarify the three distinct steps: testing, breaking through, and holding above.
I treat the first move above resistance as a test; only holding after a retest counts as a valid breakout. Touching resistance is just a test, moving above it intraday is a breakout attempt, and only closing above it with supporting volume comes closer to a confirmed hold.
For the near-term levels, watch 0.99987 an
post-image
USD1+0.00%
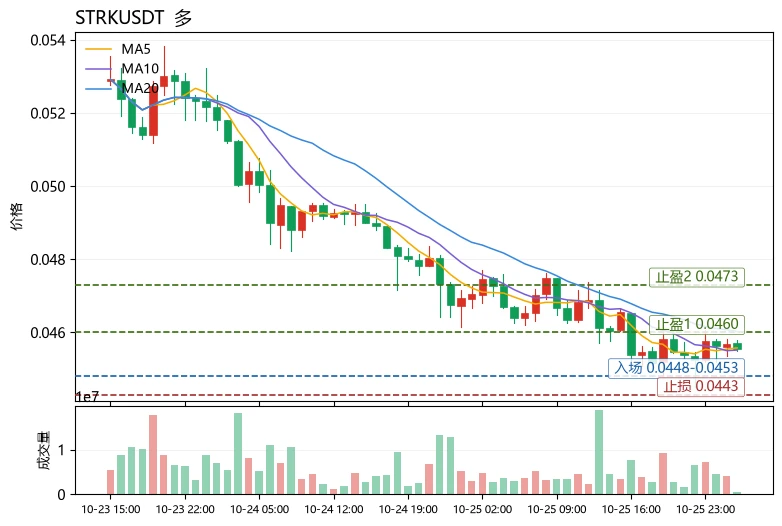
When the moving averages have not formed a bullish crossover, should you buy the pullback? The answer is yes, but only if the pullback leaves the structure intact—use moving averages to determine direction, RSI to determine position, and MACD to determine momentum; all three are essential. Take $STRK
as an example: the current price is 0.04554, and MA5 is below MA20, indicating that the short-term trend has not yet recovered. However, the price is still above the Bollinger lower band at 0.0447048, and the MACD histogram is positive, so momentum has not turned bearish. This is a “trend awaitin
post-image
HYPE+1.63%
MINH, flipped and reshaped into HNIW. 30 for Hanoi.
My first AI hackathon brought no prize. I kept building.
With I want an Agentic Wallet that helps protect lending positions, within limits I choose.
My name backwards. My next step forward.
#MyAgentID
post-image
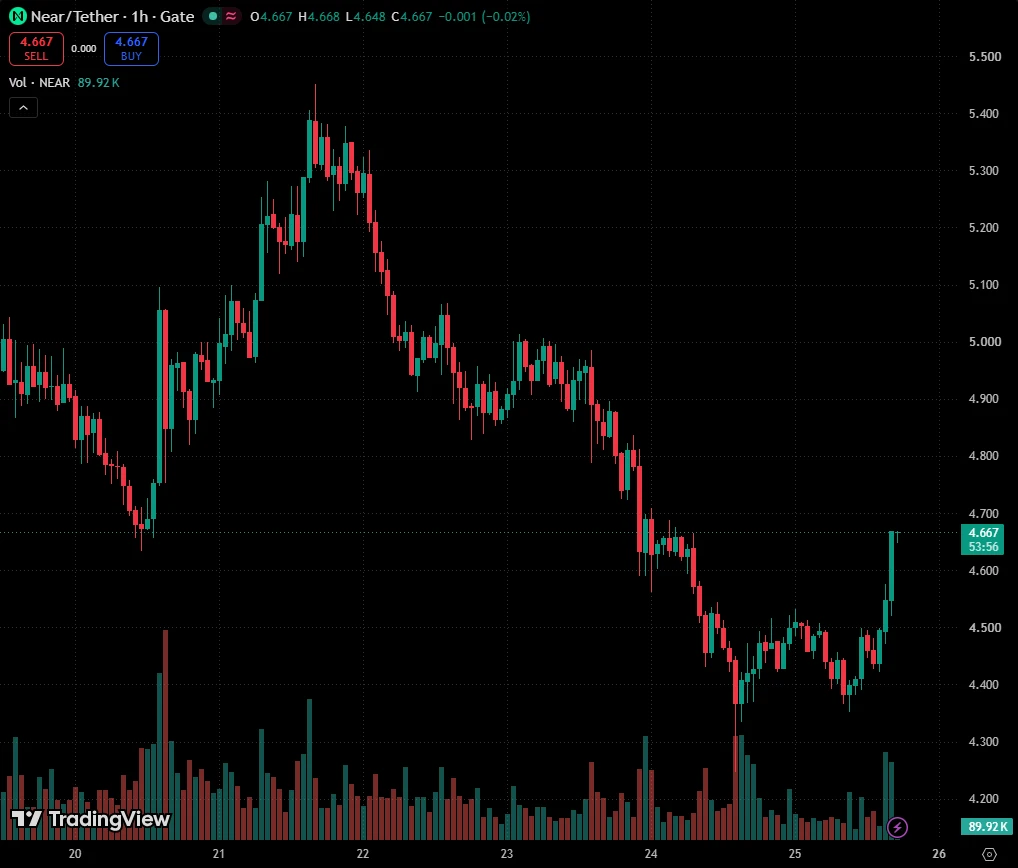
$NEAR NEARUSDT Analysis
NEARUSDT
Market Structure Analysis:
NEAR remains bearish on the 1H chart, with lower highs and lower lows. However, the recovery from support and the breakout above 4.503 indicate a short-term bullish shift against the prevailing trend.
Entry & Exit Signal:
Buy Entry: 4.554
Stop Loss: 4.465
Targets: 4.732 R/R:2 - 4.674 - 4.876 - 5.070 - 5.413
Key Support & Resistance:
Key Resistance: 4.674 / 4.876 / 5.070 / 5.413
Key Support Area: 4.503 / 4.465 / 4.251
⚠Risk Management:
Maximum 1% risk per trade.
post-image
NEAR+3.28%
Honestly, I just want to know where you bought a pillow that gives you dreams like this.
BTC UPDATES
live-cover
LIVE1,256
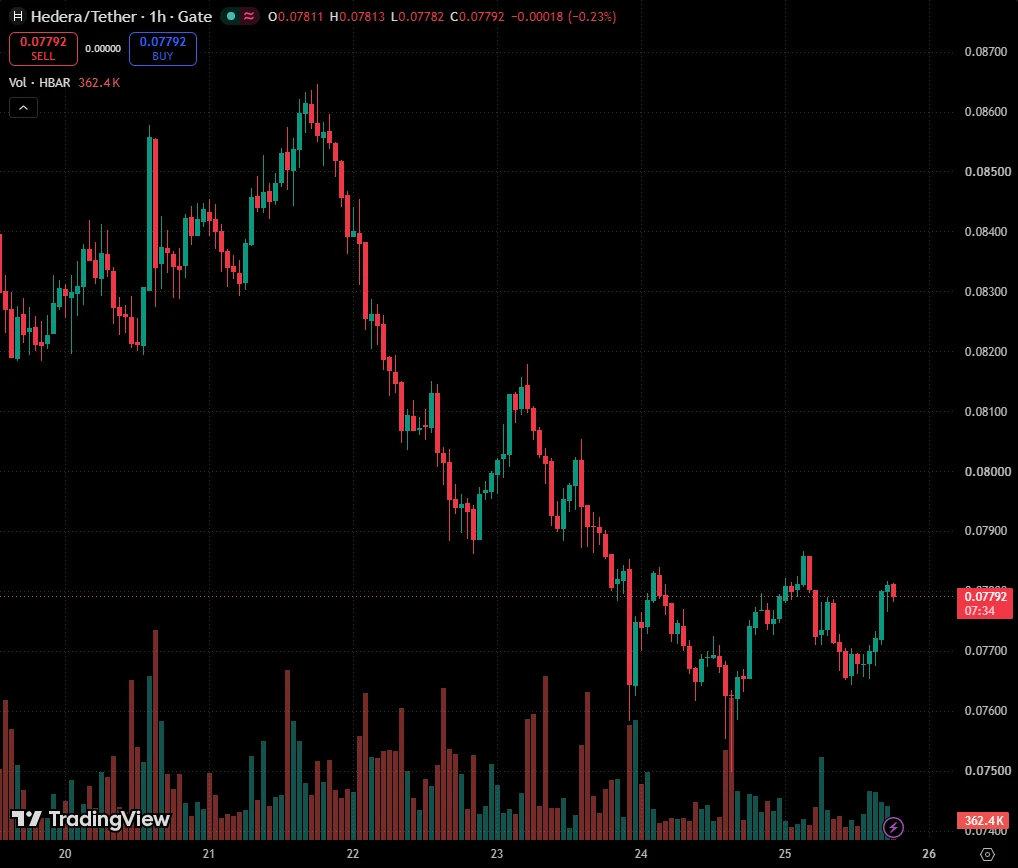
$HBAR HBARUSDT Analysis
HBARUSDT
Market Structure Analysis:
HBAR remains bearish on the 1H chart, with lower highs and lower lows. However, price is reacting from the 0.07648 support area, creating a short-term bullish setup against the prevailing trend.
Entry & Exit Signal:
Buy Entry: 0.07713
Stop Loss: 0.07648
Targets: 0.07843 R/R:2 - 0.07953 - 0.08141 - 0.08718
Key Support & Resistance:
Key Resistance: 0.07834 / 0.07953 / 0.08141 / 0.08718
Key Support Area: 0.07648
⚠Risk Management:
Maximum 1% risk per trade.
post-image
HBAR+0.83%
Major Investors Reassess Crypto Strategies as Global Bond Yields Move Higher
live-cover
LIVE999
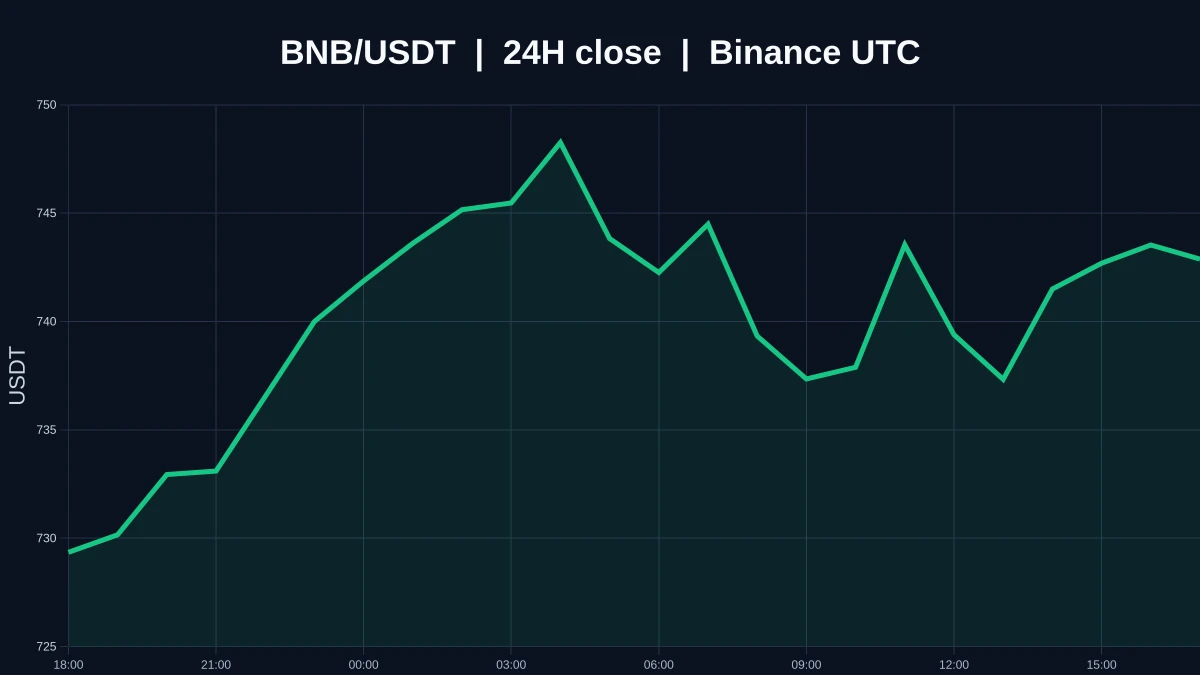
$BNB is currently at 742.66, up 2.45% over 24H. The 1H and 4H trends are both leaning strong. Watch whether it can hold above the 748.65 resistance and rebound if it loses the 725.21 support. Volume is only 0.21x the average and needs confirmation. Market volatility is high; for observation only.
post-image
BNB+1.93%
Mid-Term Intel Bro
Fund flow breakdown:
$BT In the short term, spot net inflows over 2 hours totaled 5.77 million and futures net inflows totaled 120 million, which on the surface looks like someone is buying the dip. But over 24 hours, spot saw net outflows of 168 million and futures net outflows of 554 million, for combined outflows exceeding 720 million. The short-term recovery cannot hide the mid-term drain.
$ET Futures net inflows over 2 hours totaled 114 million, seemingly indicating funds are flowing back in. But over 24 hours, futures saw net outflows of 712 million, with another 116 m
post-image
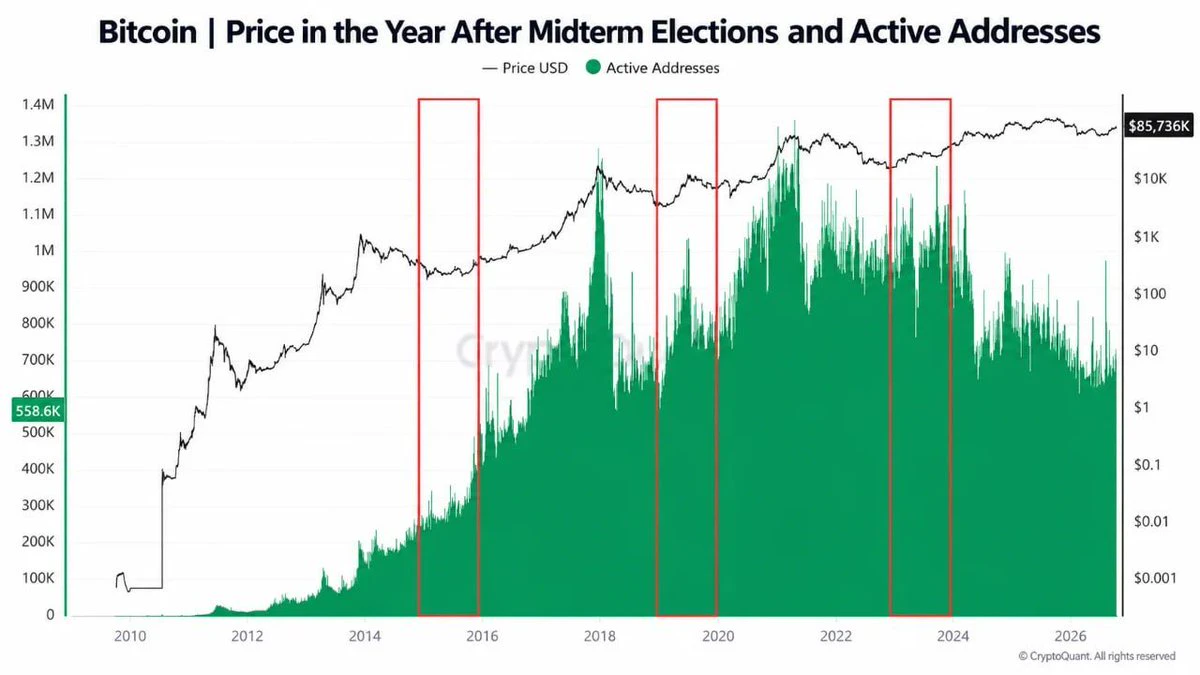
U.S. midterms are 9 days away.
The years after the last three midterms were all green, but 3 data points aren't enough to confirm a pattern.
For now, $80K is key support. Lose it and $76K comes into focus. Reclaim $85K and the squeeze higher is back in play.
post-image
$LIGHT In 24 hours, it plunged from 0.33 to 0.1841, then bounced back to 0.241. That -12.27% wick went deep, and the 86.4M in trading volume shows people were trading like crazy in this dip. I’m sitting on a half position now, wondering whether this is a shakeout or a real crash.
Reasons to be bullish: First, the long lower wick at 0.1841 shows real buyers stepped in. It plunged and recovered nearly 30%, which means panic sellers got absorbed. Second, 86.4M in trading volume isn’t small relative to the circulating supply. A high-volume sell-off followed by a recovery is often a change of hands
LIGHT-17.17%
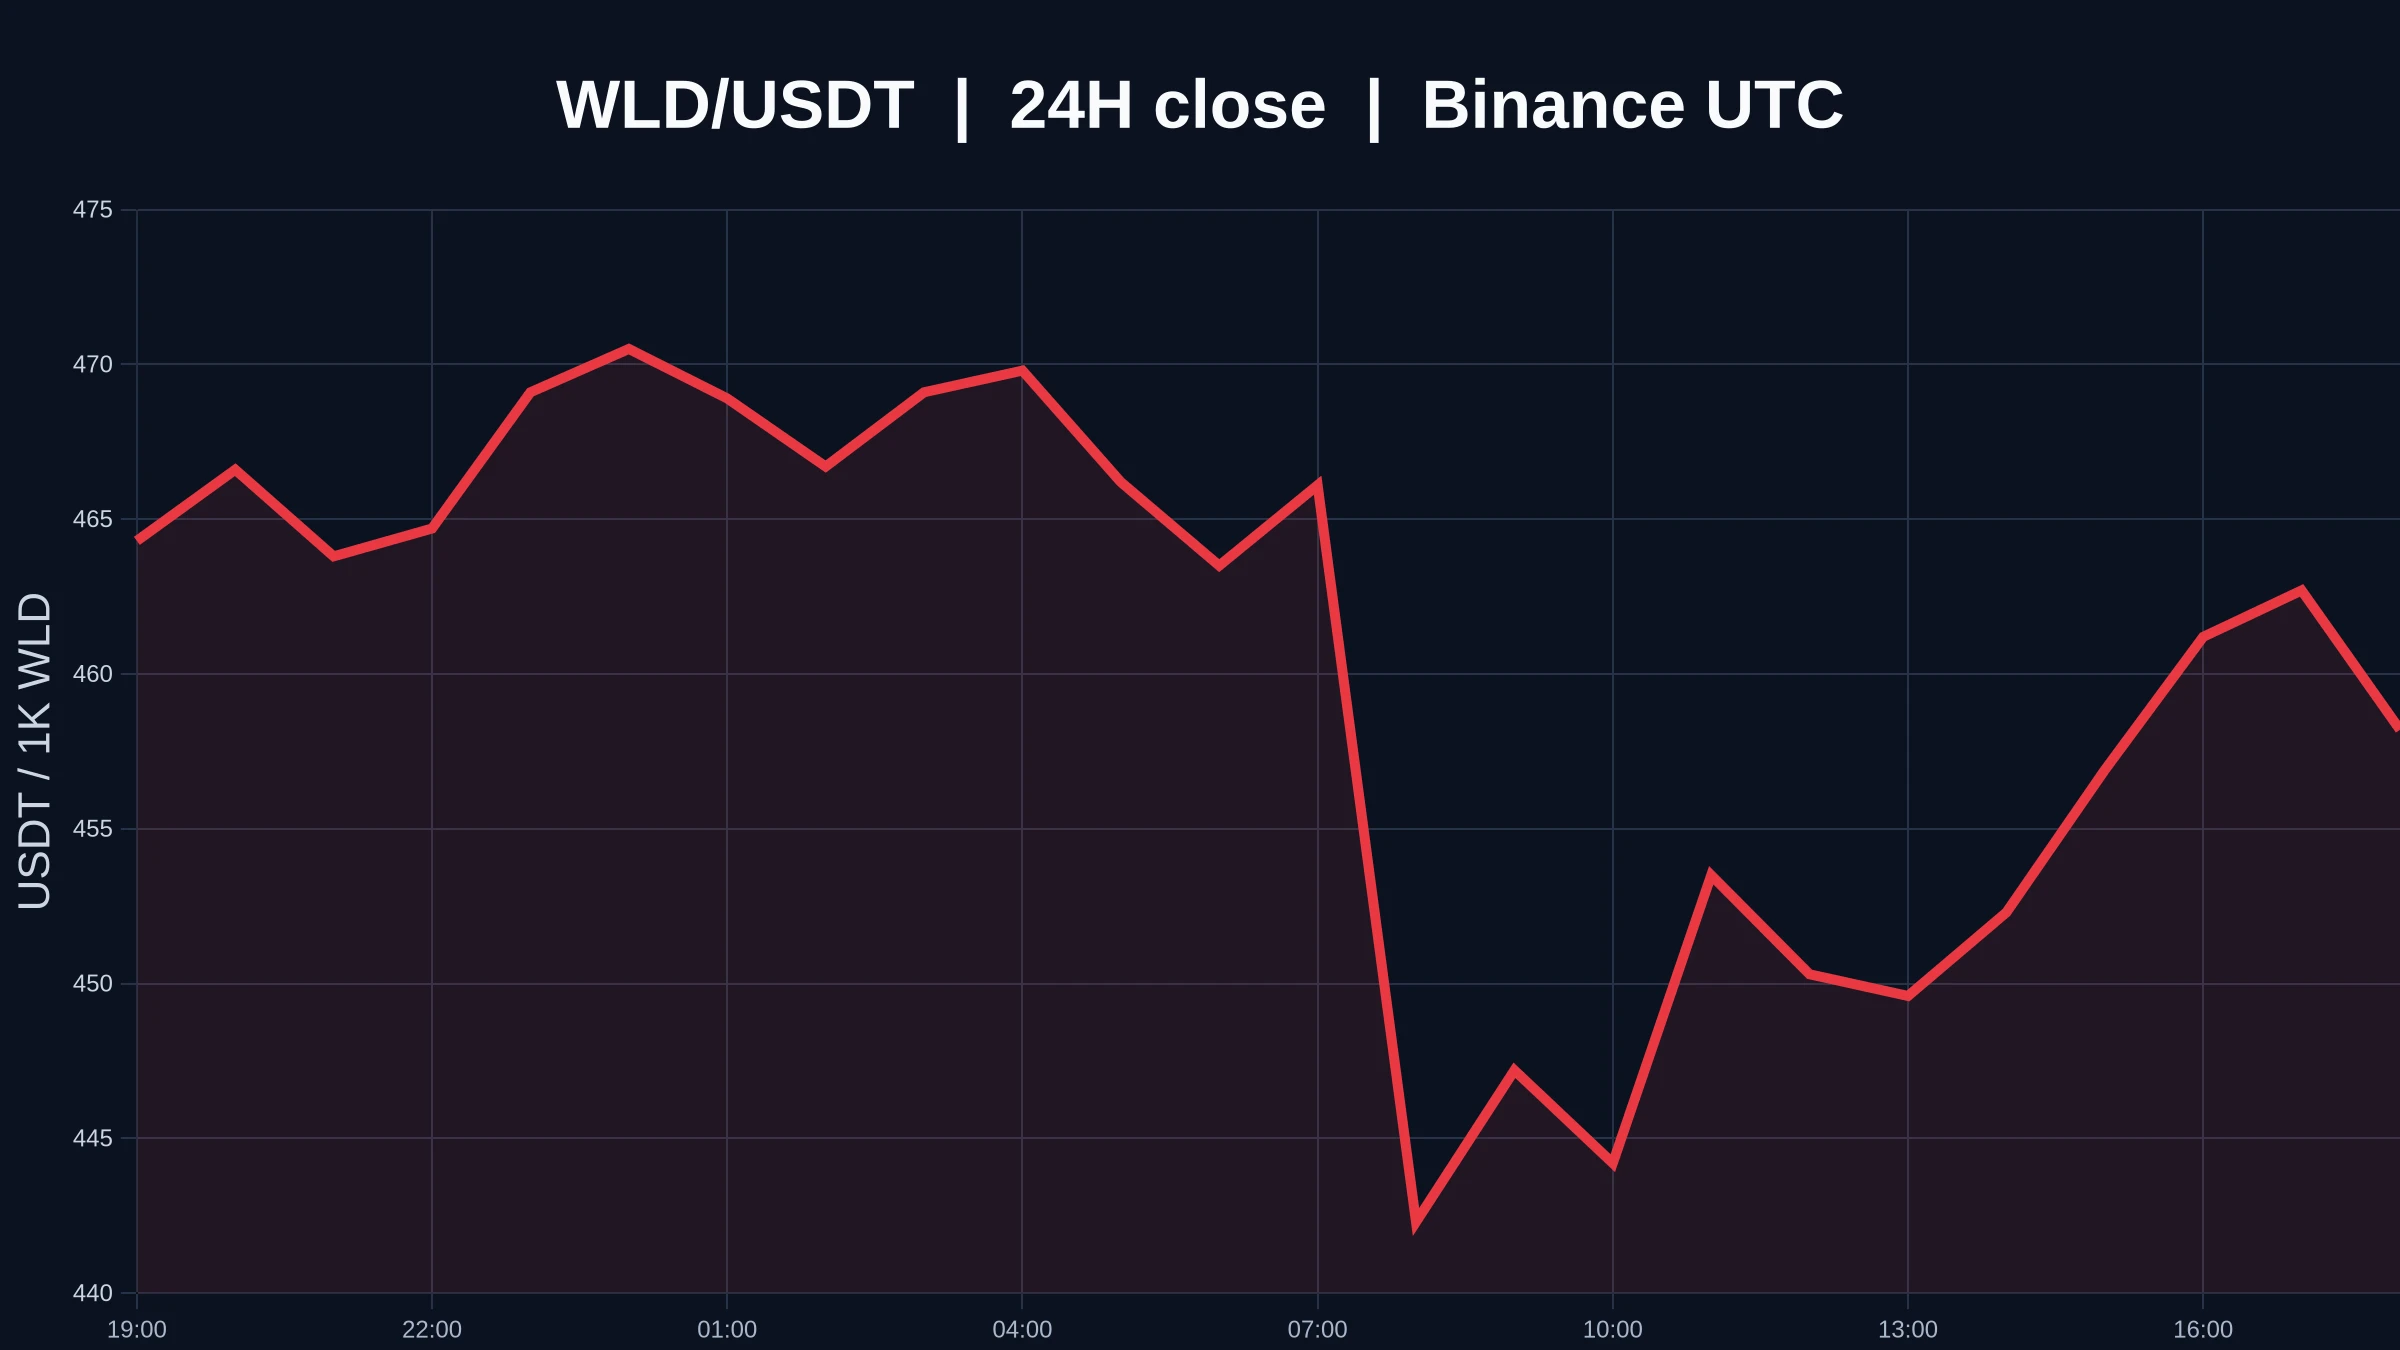
$WLD is currently at 0.458, down 1.21% over 24 hours, with volume at 0.38 times the average of the last 20 bars. Put these numbers together and $WLD is already oversold, but whether it can stop falling before we confirm a bottom is what most needs clarifying.
I treat oversold conditions only as a reason for a rebound, not proof of a bottom; only after it stops making new lows is it fair to talk about a reversal. An RSI entering low territory only means selling pressure has been released in a concentrated way, and the price may rebound; only stopping the slide to new lows and reclaiming key lev
post-image
WLD-0.90%
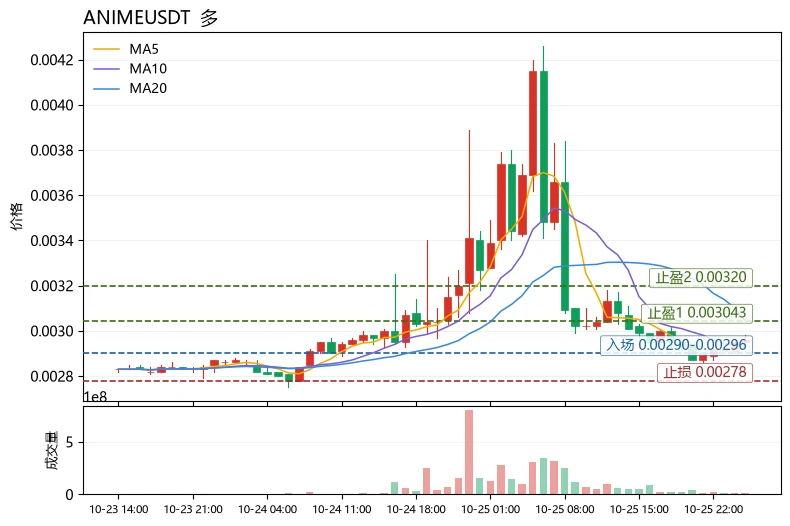
$ANIME The most unusual detail today isn’t the 12.68% drop, but that the funding rate was pushed down to -0.1049%—shorts are paying to hold their positions, yet the price remains below MA5=0.002928 and MA20=0.003043, while the MACD histogram at -1.505e-05 remains bearish. This is a classic “crowded shorts, but no trend reversal yet” setup. Negative funding means short costs are accumulating; if 0.002928 is reclaimed, the force of short covering will intensify. But RSI is only 45.9 and not oversold, and the Bollinger lower band at 0.002664 has yet to be tested, so the risk of a wick flushing o
post-image
ANIME-17.92%
ETH+1.01%
UNI+3.64%
Load More

Join 40 M users in our growing community

⚡️ Join 40 M users in the crypto craze discussion

💬 Engage with your favorite top creators

👍 See what interests you

Trending Topics

USEarningsSeason

101.1k Views3.53k Discussing

The U.S. Q3 earnings season is in full swing, with major tech companies including Tesla and Meta reporting results. Market focus is shifting beyond revenue and profit toward AI spending, capital expenditure, margins and forward guidance. Which company’s earnings are you watching most closely?

GateWCTCS9GlobalTradingCompetition

725.41k Views8.09k Discussing

USConsumerSentimentNearRecordLow

12.39k Views299 Discussing

View More