Square
Following
Hot
News
Notifications
Profile
Share your thoughts
placeholder
Article
Some things happened today—not that it was today, exactly.

Just saying, it blew up today. Most of the U has been moved out, ready to withdraw.

The futures position is only around 60k now.
A 4,000 liquidation, one last gamble.
$BTC $ETH #美国10月PPI即将出炉
post-image
BTC-0.67%
ETH-1.26%
After dinner, I casually scrolled through a few market charts and almost thought my phone had a virus. Today’s market has gone to extremes in both directions. The market makers aren’t even bothering to hide it—they’re clearly out to liquidate traders.
First, $DOGE : the current price is around 0.065, and the 4-hour long/short ratio has surged to an absurd 4.88, while open interest is clearly shrinking. The big players have already slipped out. After falling for so long, retail traders are still hoping Dogecoin will return to its highs. With longs this crowded, the market makers won’t push it u
post-image
DOGE-0.22%
PEPE+0.97%
Trenches
mihao
m
bade
b
mihao
4Cxj...pump
Market Cap
$.
Change
.
24h Vol
$.
Holders
.
AGT
A
bade
b
AGT
0x5d...e274
Market Cap
$.
Change
.
24h Vol
$.
Holders
.
FOOD
F
bade
b
FOOD
FTu5...pump
Market Cap
$.
Change
.
24h Vol
$.
Holders
.
IDOL
I
bade
b
IDOL
0x3b...ab07
Market Cap
$.
Change
.
24h Vol
$.
Holders
.
AI
A
bade
b
AI
2T56...pump
Market Cap
$.
Change
.
24h Vol
$.
Holders
.
In crypto futures trading, many people spend every day analyzing whether BTC will rise or fall, but overlook a very important question: Do you really understand the different order types on trading platforms?

Sometimes, even if you correctly predict the market, an unsuitable order method can lead to an unfavorable entry price or even unnecessary losses.

First, limit orders. You can set a buy or sell price in advance and wait for the market to reach that price before the order is filled. They are suitable for looking for buying opportunities near support or planning to sell near resistance. T
post-image
BTC-0.65%
BTC market less and less like safe haven?
live-cover
LIVE2,245
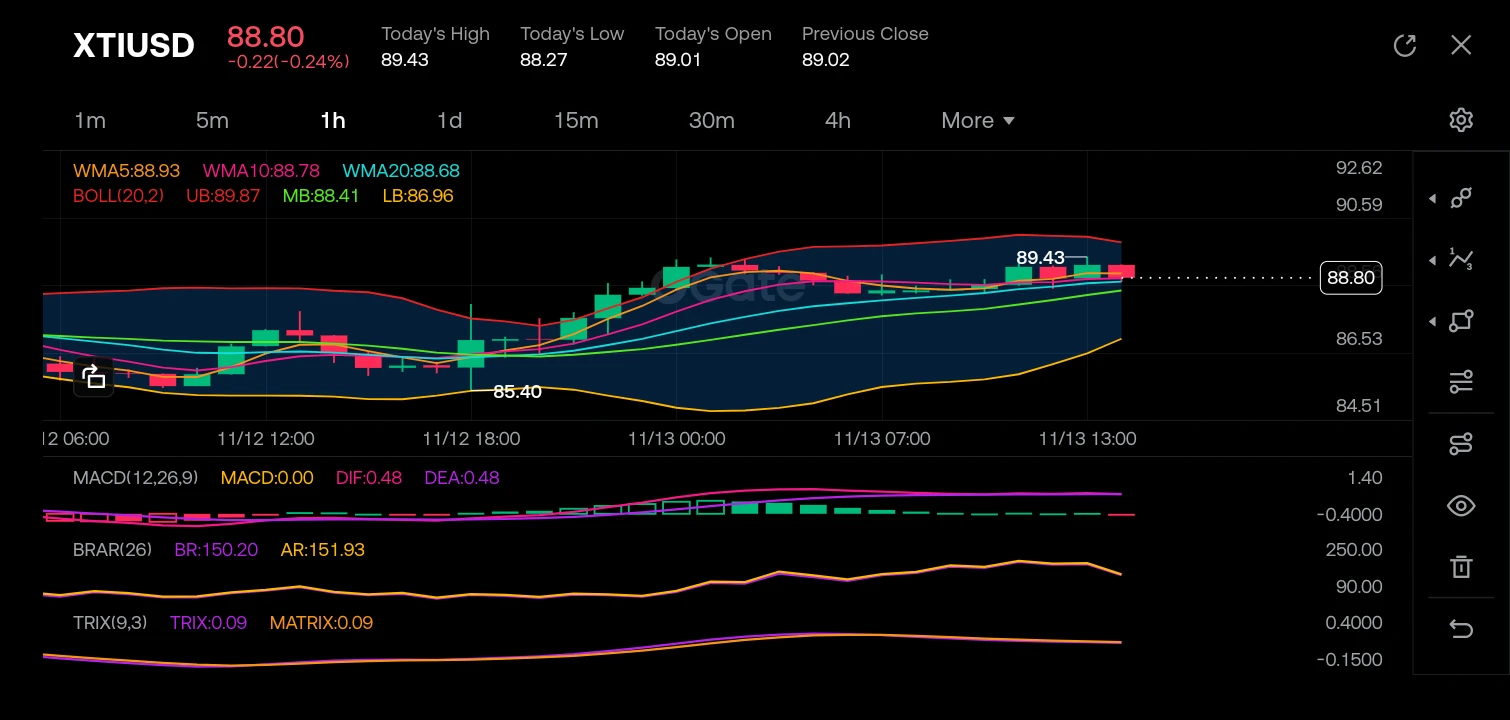
$XTIUSD ‌
The market structure has recently shifted from a bearish retracement to a bullish recovery, as price bounced firmly off the 85.40 support level and established a higher low. Price is currently trading at 88.80, consolidating just below the upper Bollinger Band (UB: 89.87) and above the key moving averages (WMA5: 88.93, WMA10: 88.78), indicating strong short-term momentum. The K-line analysis shows a series of bullish candles with shallow pullbacks, and the MACD (0.48) remains in positive territory above the zero line, confirming the buyers are in control despite the slight intraday
post-image
XTIUSD+0.00%
  • 4
#eth If ETH’s daily candle gets back to 2000 today and holds, the downtrend is over and a choppy shakeout begins. If it stays below 1980, there’s still another leg down.😭😭😭
post-image
ETH-1.26%
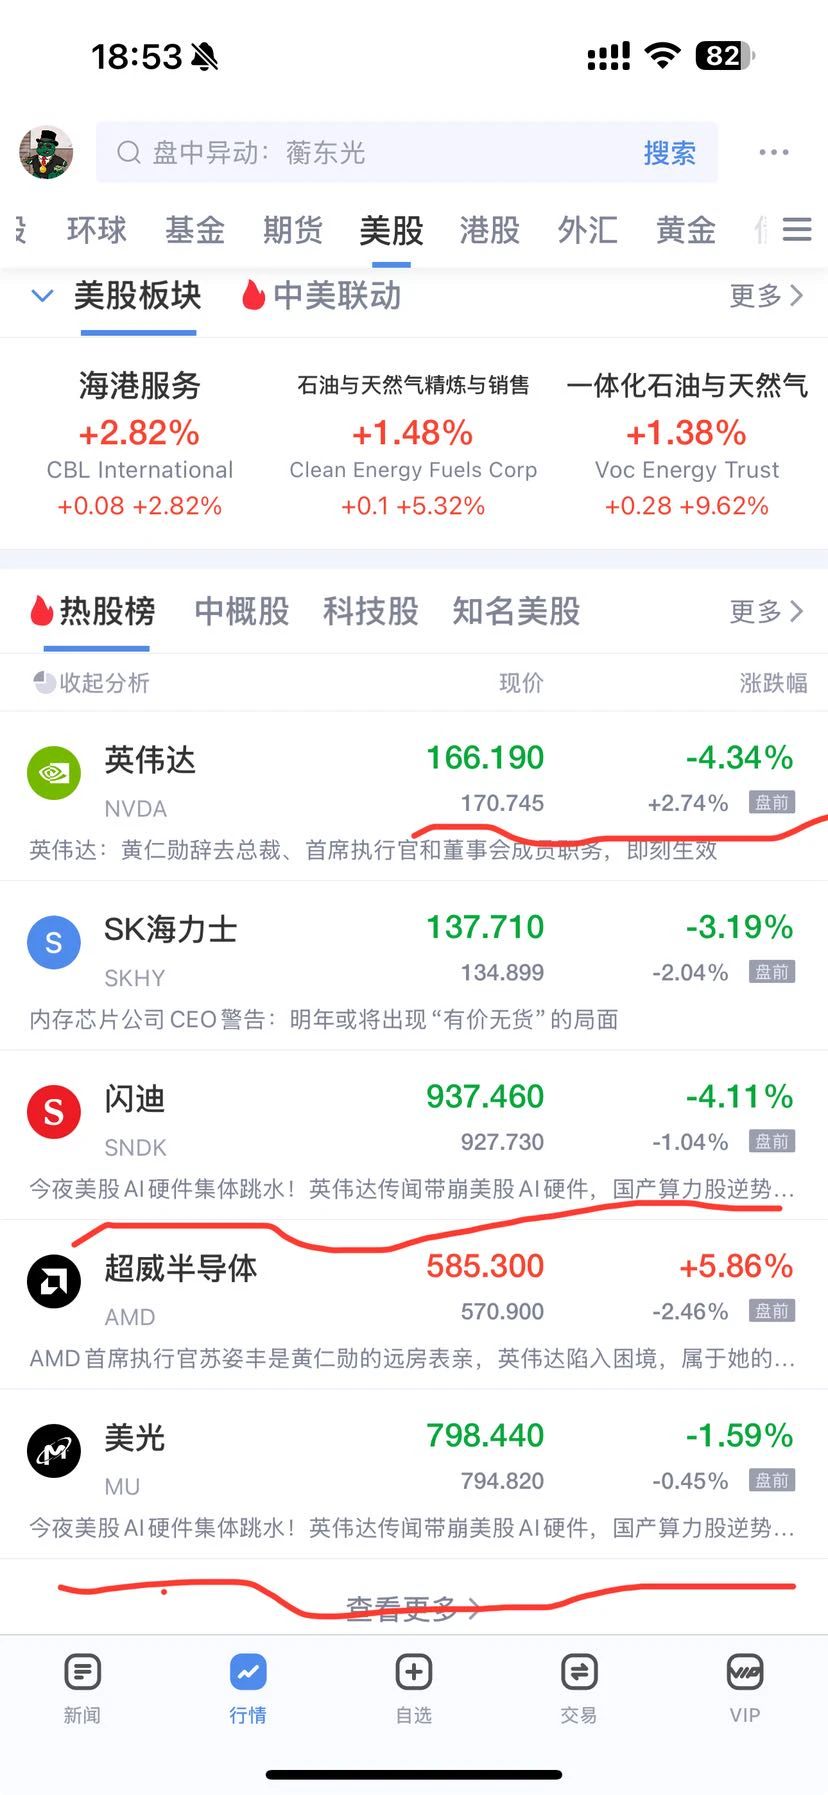
#英伟达# reached 150.44, with a low of 148.8. The period of wealth growth from October 6 to November 12 has ended. Figure 2 shows rebound targets and resistance levels. Nvidia has affected stock markets in various countries, including the US, Japan, South Korea, and China. ​​​$NVDA ‌
NVDA-0.35%
In BTC trading, many traders have had this experience: the price suddenly breaks through a key resistance level, and they think the rally has finally begun, so they immediately chase the move. Before long, the price quickly falls back into its previous range, or even triggers their stop-loss. This is commonly known as a false breakout.

So, how can you identify a false breakout?

First, watch trading volume. A genuine breakout usually needs to be supported by sufficient volume. If the price breaks through a key level but volume does not increase noticeably, market participation may be insuffic
post-image
BTC-0.67%
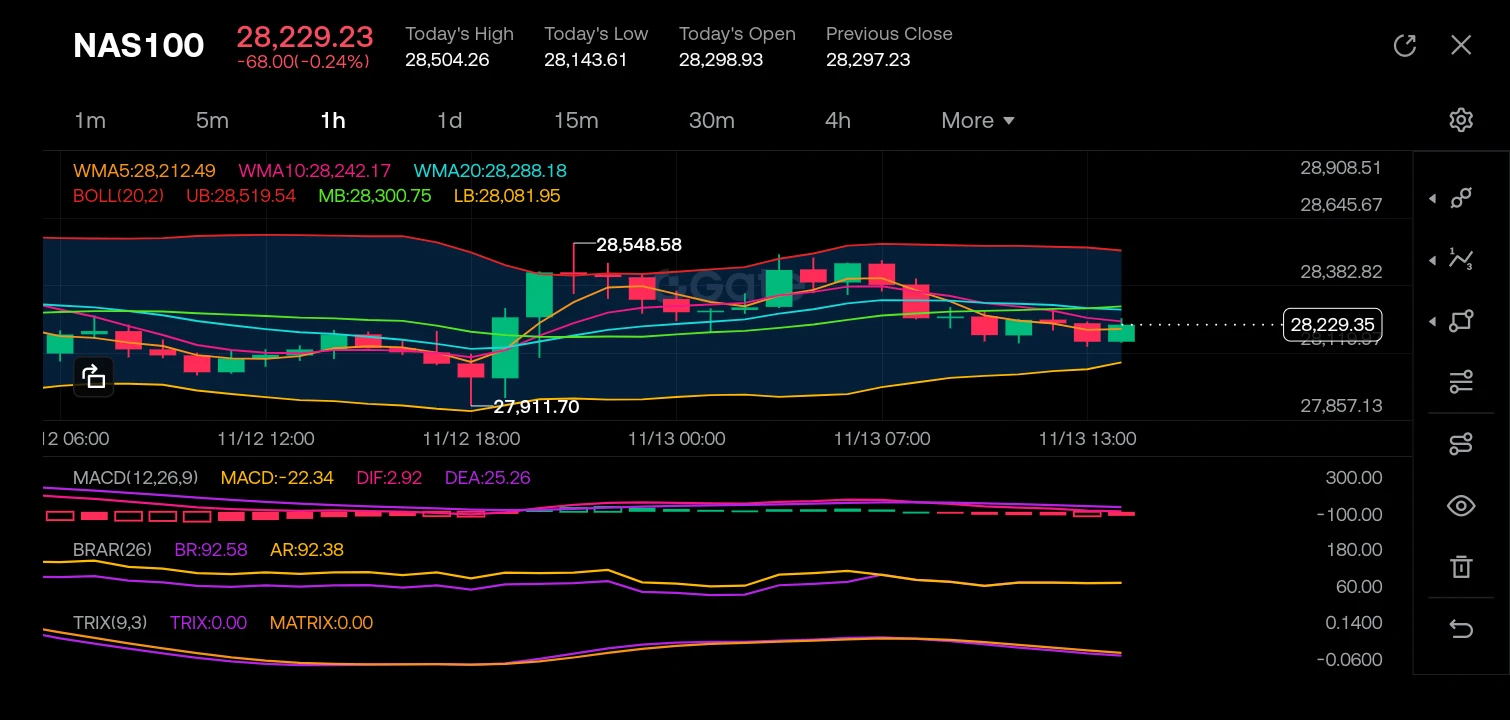
$NAS100 ‌
Looking at the 1-hour chart, the market structure has shifted from a bearish downtrend into a consolidation phase, having established a solid support base around the 27,911.70 level and a local resistance peak at 28,548.58, though the current price action is struggling to maintain the highs near the 28,300 level where the midline of the Bollinger Bands is acting as dynamic resistance.

The recent K-lines are showing indecision with alternating red and green candles hugging the middle Bollinger Band (MB: 28,300.75), and we are currently seeing small-bodied candles forming a potential
post-image
NAS100+0.00%
  • 3
  • 2
More and more traders are starting to use AI and quantitative models to predict cryptocurrency market movements. Some models can even assign an 80% probability of prices rising. But there’s an interesting phenomenon: even when trading signals seem highly accurate, many people still end up losing money.

Why is that?

First, a probability forecast is not a guarantee of profit. An 80% probability of prices rising means the model estimates that prices are more likely to rise under certain conditions; it does not mean the next trade is guaranteed to make money.

Second, the market can change at an
post-image
$DODOX I caught this bullish candle, but only got half the move. I entered at 0.0242 yesterday, looking at a 4-hour breakout above the previous high of 0.0238 on increased volume, with a MACD golden cross above the zero line. Volume of 62.8M backed up the breakout. Today it surged to 0.0302, so I placed a sell order at 0.0298 and exited. Now it’s moving sideways at 0.0293—can’t really say I sold too early, but my mindset while holding was clearly getting impatient, afraid of giving back profits. Typical bear-market thinking I haven’t shaken off yet.
One lesson: hold breakout trades; don’t let
  • 2
Can There Be Sharp Pullbacks in a Bull Market? How to Distinguish a Normal Correction from a Trend Reversal?

In the cryptocurrency market, many traders have experienced this: BTC rises steadily for a while, then suddenly drops sharply. Some think it is a normal correction and continue holding; others believe the bull market is over and rush to sell.

But how should you tell the difference?

First, observe the market structure. In a healthy uptrend, prices typically form progressively higher highs and higher lows. Even when a pullback occurs, as long as key lows are not decisively broken, the
post-image
BTC-0.67%
Many derivatives traders have had this experience: they correctly predicted the market’s overall direction, yet a brief bout of sharp volatility suddenly forced their positions to be liquidated.

Why does this happen?

First, excessive leverage is the most common cause. The higher the leverage, the greater the impact of price fluctuations on margin. Even a brief move in the opposite direction can quickly hit the liquidation price.

Second, market liquidity affects actual execution results. When a large number of sell or buy orders suddenly hit the market, the order book can quickly thin out, m
post-image
[ NEW STREAMER] CRYPTO MARKET
live-cover
LIVE1,885
Can Nvidia hold onto its gains at the open? Only if Nvidia stabilizes and US stocks stay in the green can they drive Bitcoin higher in a rebound.

Yesterday, Nvidia dragged the entire AI sector down at the open, and Bitcoin followed. Developments during the opening session triggered concentrated selling. Bulls stayed on the sidelines, and prices quickly broke lower. By the close, the most panic-inducing bearish news had been exhausted; everyone who was going to sell had sold, and dip-buyers stepped in. Nvidia opened lower and closed higher.

AMD, which took in funds flowing out of Nvidia yeste
post-image
NVDA-4.49%
What is a long liquidation? Why can the market experience a cascading decline when prices fall?

In the cryptocurrency market, prices sometimes initially dip only slightly, then suddenly accelerate downward. In addition to selling pressure in the spot market, one possible cause is long liquidations.

Understanding the liquidation mechanism helps traders recognize leverage risks and analyze why some market moves can become unusually volatile in a short period of time.

First, what is a long liquidation?

Long traders buy assets or open bullish contract positions, expecting prices to rise. When
post-image
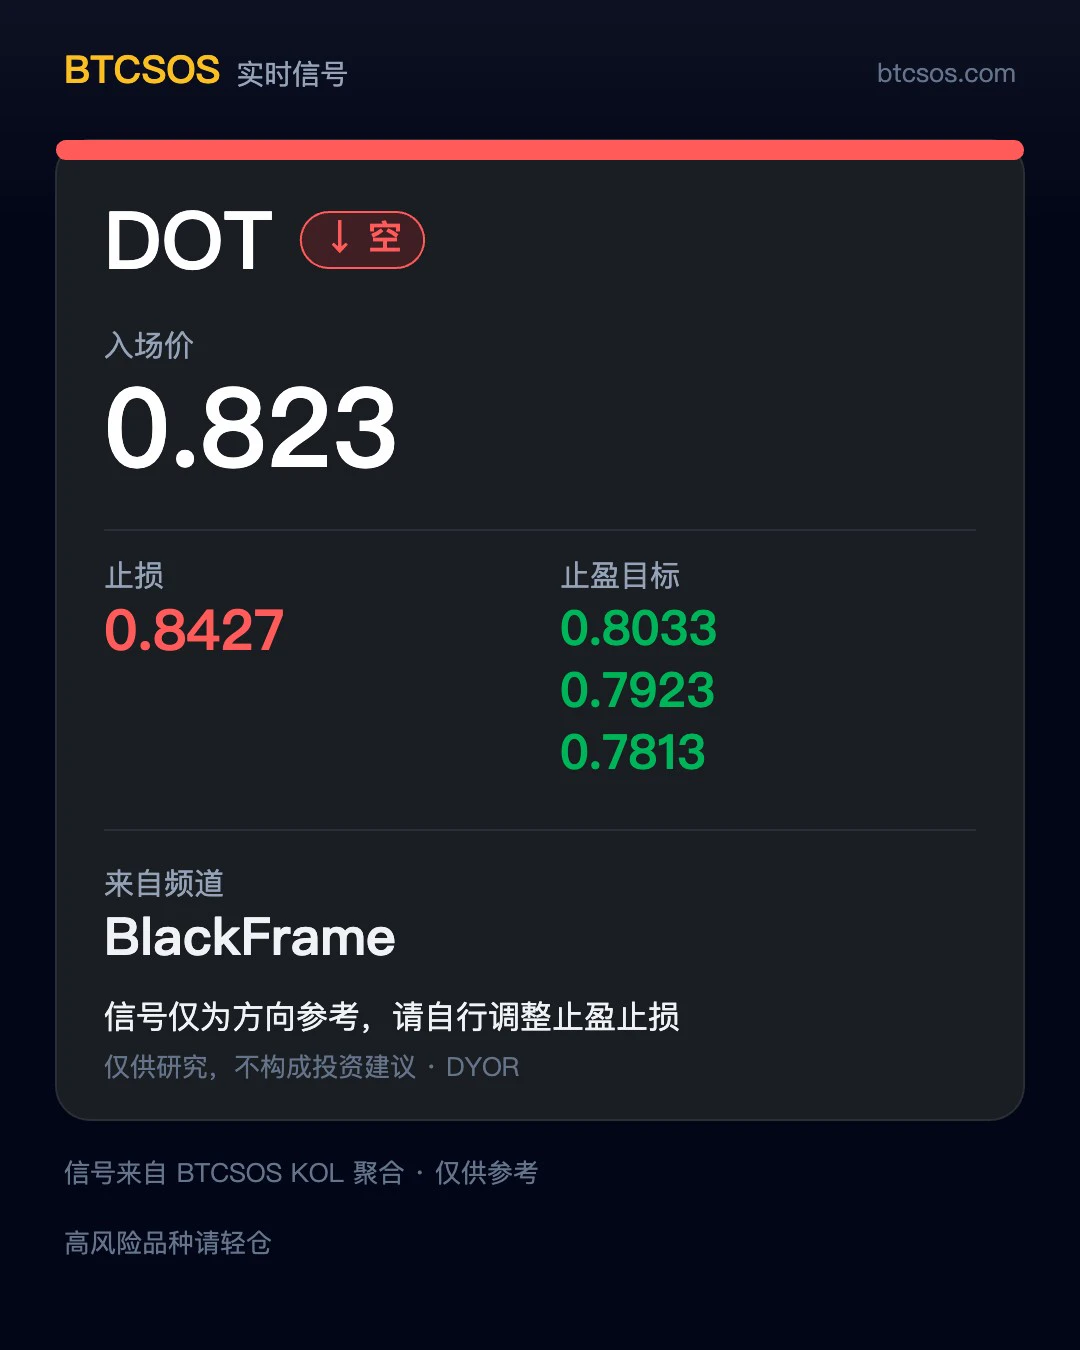
📡 Signal card · just captured
Source: BlackFrame channel Asset: $DOT Short entry: 0.823 Stop loss: 0.8427 Targets: 0.8033 / 0.7923 / 0.7813 Time: No specific time noted; refer to the channel post
Come to think of it, I just reposted his $PUMP trade this morning, and here it is again—an old familiar face 😂
As usual: I only handle reposting; the signal is from the KOL. Whether to follow and how much to risk are up to you all. The market can go crazy, but risk management shouldn’t.
Shared as a personal record, not investment advice. #TheFed adjusts its 2027 rate meeting schedule, reducing reg
post-image
DOT-1.47%
PUMP-1.06%
What is the difference between isolated and cross margin? Why can the same market conditions affect accounts in completely different ways?

In crypto futures trading, many people focus on price, leverage, and liquidation prices, but overlook another equally important question: whether they are using isolated margin or cross margin.

These two modes determine how margin is allocated and how an account’s funds may be affected when an individual position incurs a loss.

First, what is isolated margin?

Isolated margin manages the margin allocated to a particular position relatively independently.
post-image
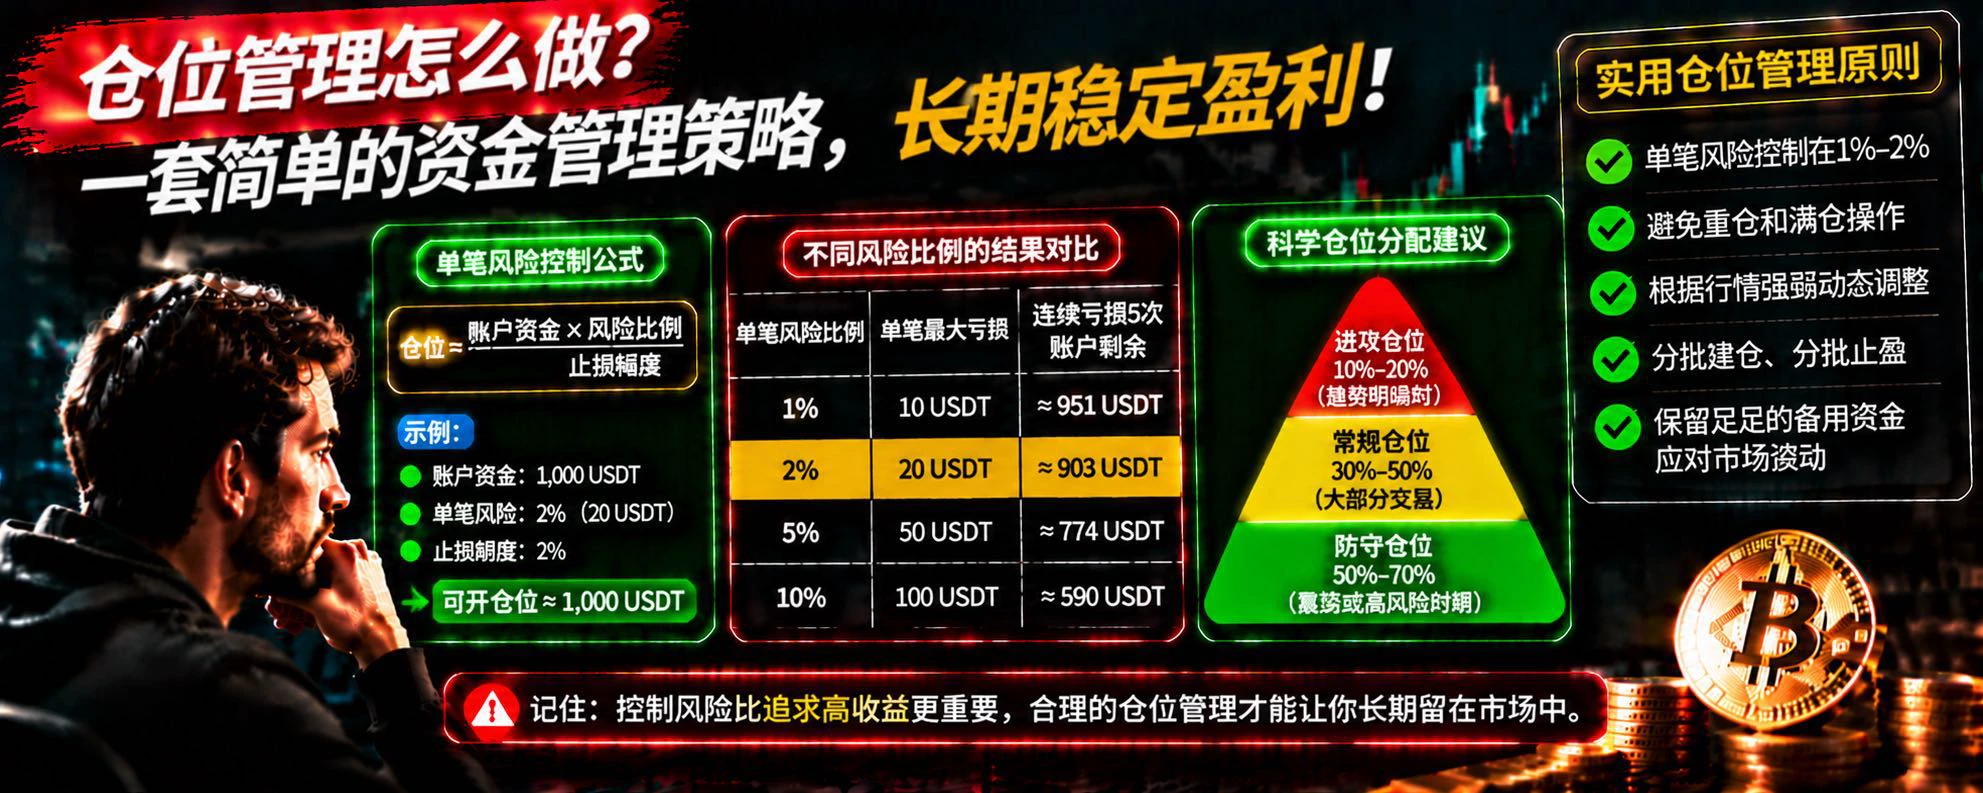
Why Do Larger Losses Make It Harder to Break Even? Understanding the True Cost of Account Drawdowns

In cryptocurrency trading, many people focus especially on how much a trade can earn, but rarely take the time to calculate how much their account needs to rise to return to its original level after a loss.

This is one of the risks most easily overlooked in trading.

Suppose your account originally has 1000 USDT. After a 10% loss, you have 900 USDT left. To get back to 1000 USDT, you need a gain of 11.1%, not 10%.

If the loss reaches 20%, your account is left with 800 USDT, and you need a 25%
post-image
Load More

Join 40 M users in our growing community

⚡️ Join 40 M users in the crypto craze discussion

💬 Engage with your favorite top creators

👍 See what interests you

Trending Topics

JensenHuangResigns

516.7K Views8.1K Discussing

Jensen Huang has resigned as NVIDIA CEO and stepped down from the board. CFO Colette Kress will serve as interim CEO while NVIDIA considers internal and external successors. $NVDA fell more than 10% in premarket trading following the announcement. With one of AI’s most influential leaders stepping aside, markets are now reassessing NVIDIA’s leadership stability, AI strategy, and long-term valuation.

GateIPOAccessAnthropic

280.8K Views2.6K Discussing

Dr.HanOxfordUnionSpeech

144.6K Views472 Discussing

View More