Square
Following
Hot
News
Notifications
Profile
Share your thoughts
placeholder
Article
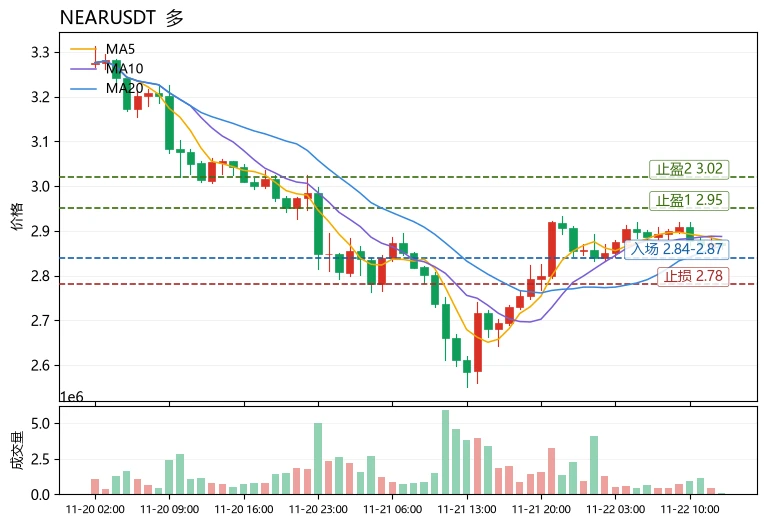
The most unusual detail in today's market is that the Fear & Greed Index has plunged to 11, in the extreme fear zone, yet $NEAR has rallied +10.22% against the trend, with its funding rate at +0.0068%—the only positive one in the market. Shorts are piling in amid the panic, while longs are paying to hold positions; funds are clearly leaning toward the long side. The price is above MA5 (2.8788) and MA20 (2.8661), the MACD histogram is holding bullish at +0.003905, and the RSI is only 50.9, showing no overbought conditions. The Bollinger upper band at 2.9495 still leaves room to run; however, t
post-image
NEAR+1.17%
SUI-1.05%
APT-1.51%
#BTCReboundFaces60KTest

CAN BITCOIN HOLD ABOVE $60,000 AFTER BOUNCING OFF $55,300 AND SLIPPING BACK NEAR $59,300?

Will Bitcoin's quick jump back above $60,000 on November 21 turn into real stability, or is the pullback toward $59,300 a sign that sellers are still waiting overhead? After touching lows around $55,300—its weakest stretch since September 2024—Bitcoin rebounded above $60,000 before easing back toward the $59,300 area. Because round numbers act like magnets for both buyers and sellers, watching how price behaves around $60,000 gives a clear window into market strength.
CEO Econom
BTC-0.67%
Trenches
IDOL
I
bade
b
IDOL
0x3b...ab07
Market Cap
$.
Change
.
24h Vol
$.
Holders
.
JAGENT
J
bade
b
JAGENT
0x8e...ae15
Market Cap
$.
Change
.
24h Vol
$.
Holders
.
PIEVERSE
P
bade
b
PIEVERSE
0x0e...25a9
Market Cap
$.
Change
.
24h Vol
$.
Holders
.
FIONA
F
bade
b
FIONA
B34n...pump
Market Cap
$.
Change
.
24h Vol
$.
Holders
.
mihao
m
bade
b
mihao
4Cxj...pump
Market Cap
$.
Change
.
24h Vol
$.
Holders
.
$PEPE Is Oversold, but That Doesn’t Mean It Has Bottomed: Rebound Demand Has Emerged, but the Downtrend Hasn’t Stopped
Currently, $PEPE is trading at 0.00000333 USDT, up 3.10% over 24 hours, with a range of 0.0000032–0.00000351. The price is deeply oversold, with 1-hour RSI at 37.5 and 4-hour RSI at 28.9, but oversold does not mean a bottom is in.
My view: rebound demand has emerged, but until the structure stops weakening, I won’t equate oversold conditions with a bottom.
RSI moving into low territory only indicates concentrated selling pressure. Rebound demand has already emerged, but for t
post-image
PEPE+0.97%
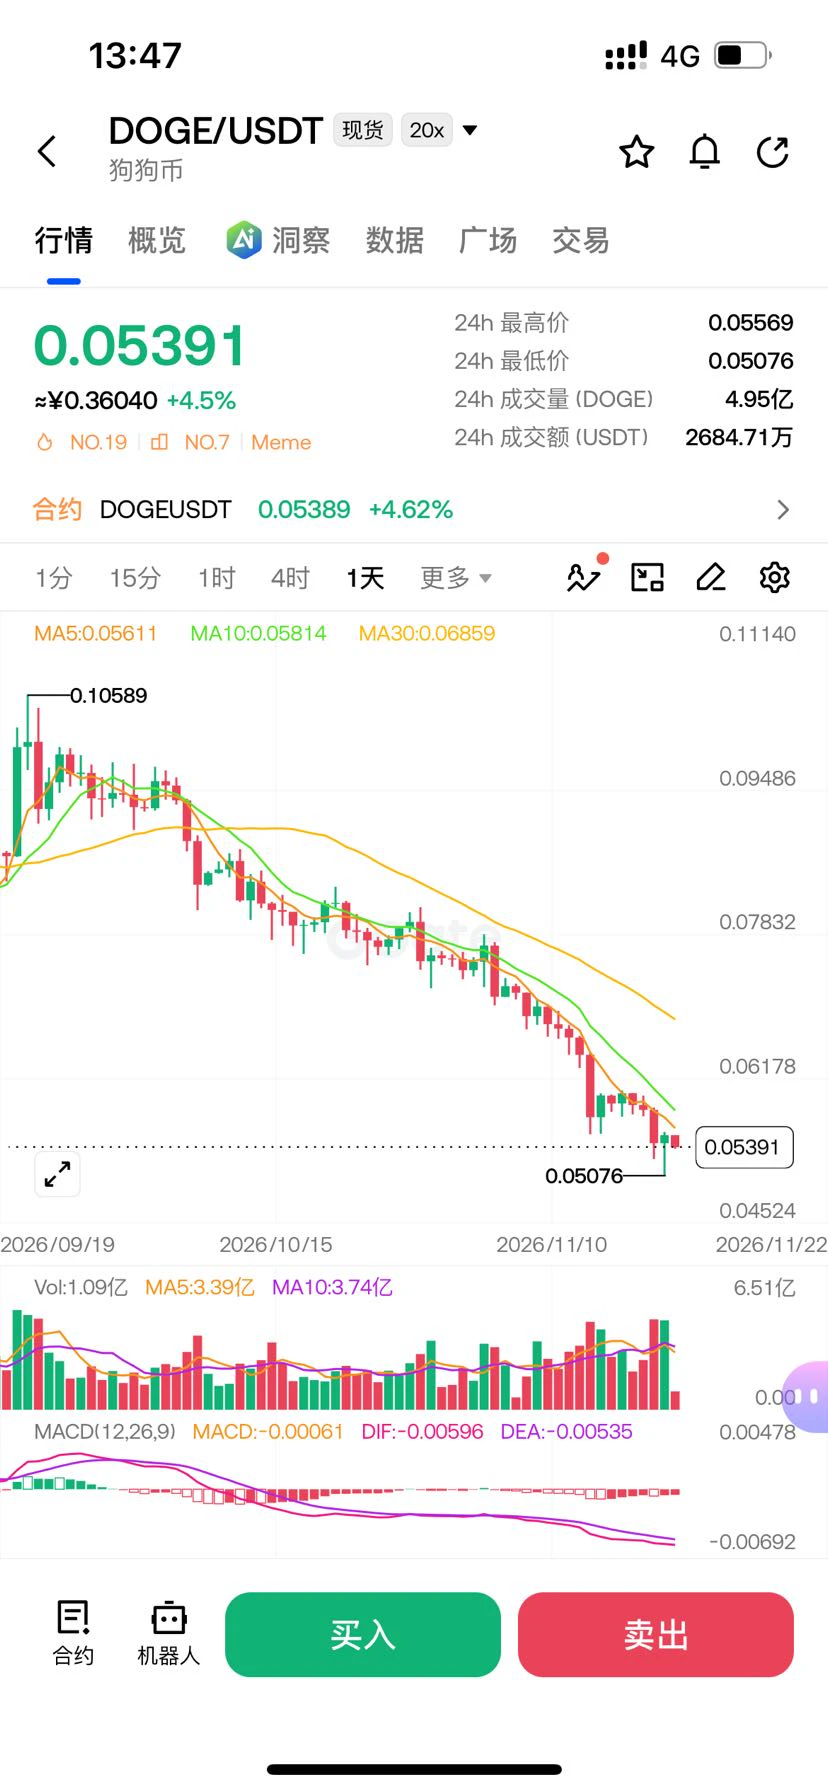
I checked the losers list at noon and got a laugh. $DOGE was listed among the “biggest losers,” but then I looked and saw it was up 4.9% over 24h. The list was ranked by gains; they just got the headline backwards. At least it’s made the list twice.

The problem is, that +4.9% doesn’t look appealing to me at all. It’s still down 6.3% over 7 days, and today’s volume is about 0.9x normal—no volume spike, just people taking a few shots at the lows, with the usual gamblers hyping each other up. This damn thing doesn’t have any real narrative anymore; the meme hype has long since faded, and now it
post-image
DOGE-0.22%
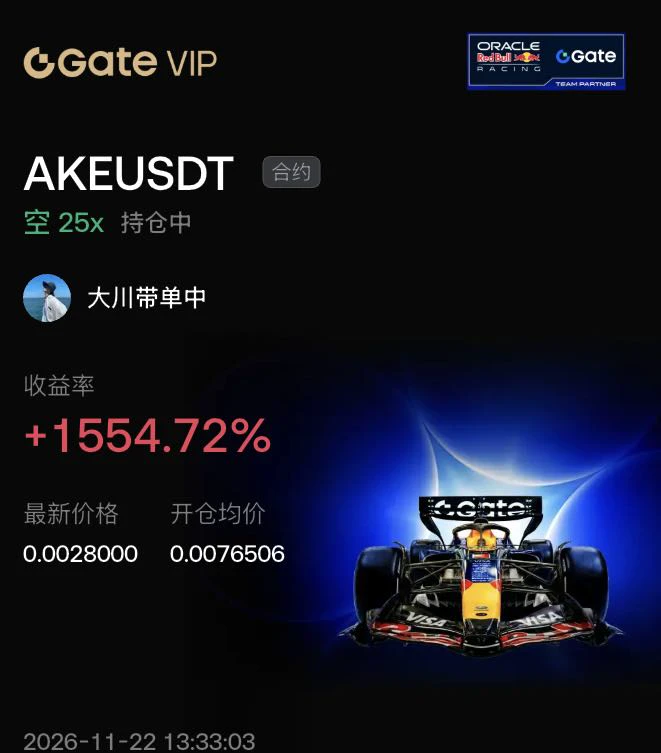
$AKE I opened a short at 0.0076506, and this wasn’t a random entry. AKE repeatedly tested above 0.007, but three attempts to push higher all failed to break the previous high, with volume weaker each time—the price moved, but volume didn’t follow, a classic price-volume divergence. On the moving-average system, MA5 had already crossed below MA10, MACD had formed a death cross below the zero line, and the histogram had turned from red to green and continued to expand. I entered on the candle where the second push ran out of steam and formed a long upper shadow.
$BTC
At the moment I entered, I
post-image
AKE+6.39%
BTC-0.65%
  • 2
  • 1
#GateAnnualGala 🎉 Gate Annual Gala Is Here!

The Gate Annual Gala is bringing the community together for a special celebration of another exciting year in crypto! 🚀

🏆 From memorable moments and achievements to creators, streamers, and community members, the Gala is a chance to celebrate everyone who has been part of the journey.

✨ Stay tuned for exciting highlights, recognition, rewards, and unforgettable moments from the event.

💙 Let’s celebrate the progress, passion, and future of the crypto community together!

#Gate #GateAnnualGala #Crypto #Web3
post-image
This kind of simp is top-tier.
post-image
BTC market Ubdates
live-cover
LIVE3,656
BTC-0.67%
ETH-1.26%
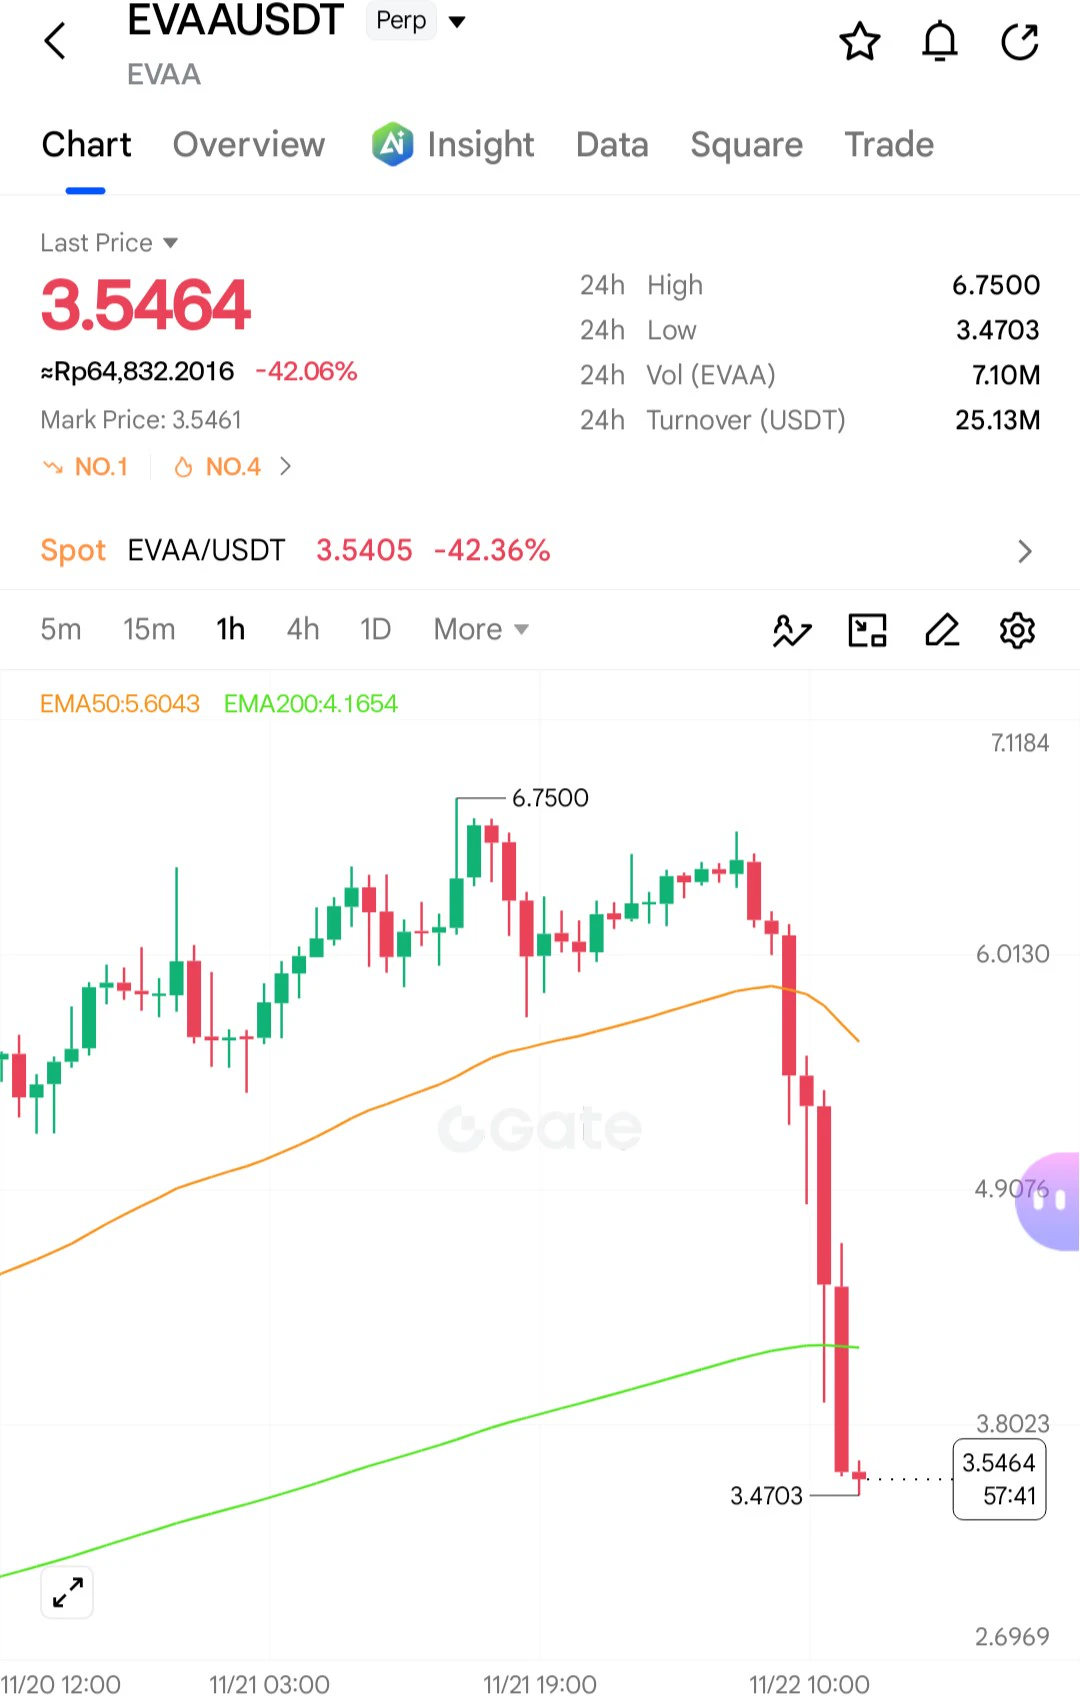
$EVAA I couldn't even take advantage of the damn market maker giving me a chance to break even. From 6.5 to 3.1—if I'd shorted 2,000 of it, I'd have gotten 6,000u back. Fuck, it dropped to 4.1 and I went long—what the hell for? Damn it
EVAA-0.49%
  • 1
EVAA immediately moved lower after touching $6.7, without bouncing back up 🤣
$EVAA ‌$AKE ‌$ZEC ‌
post-image
EVAA-0.42%
AKE+6.39%
ZEC+1.29%
  • 3
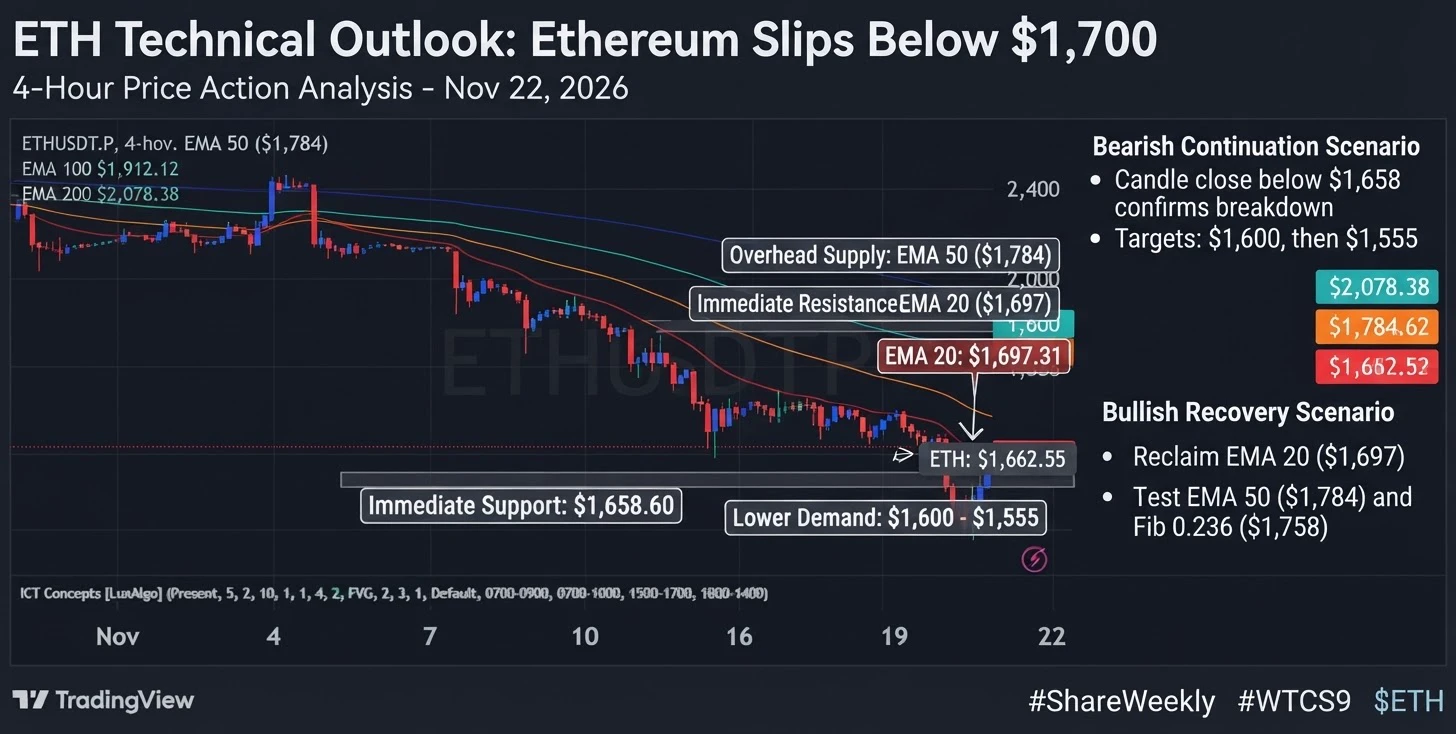
#ETHTechnicalOutlook : Ethereum Slips Toward $1,662 as Downward Momentum Continues
Ethereum is trading around $1,662.55 after extending its decline from the $2,400.00+ swing high region. The sustained breakdown on the 4-hour chart has kept market structure under heavy pressure, with ETH trading below all key short- and medium-term exponential moving averages. Price is currently hovering just above its 4-hour session low near $1,658.60, where buyers must step in quickly to prevent a deeper leg down.
Market Structure & Trend
ETH has lost several key horizontal support zones on its way down from
post-image
ETH-1.23%
  • 2
  • 1
Bitcoin’s current-price short bearish first target has been reached perfectly, capturing a 1,700-point move. Take short-term profits; the bold can keep a stop in place and continue toward the second target$BTC $ETH #BTC反弹后再争6万美元关口
BTC-0.67%
ETH-1.26%
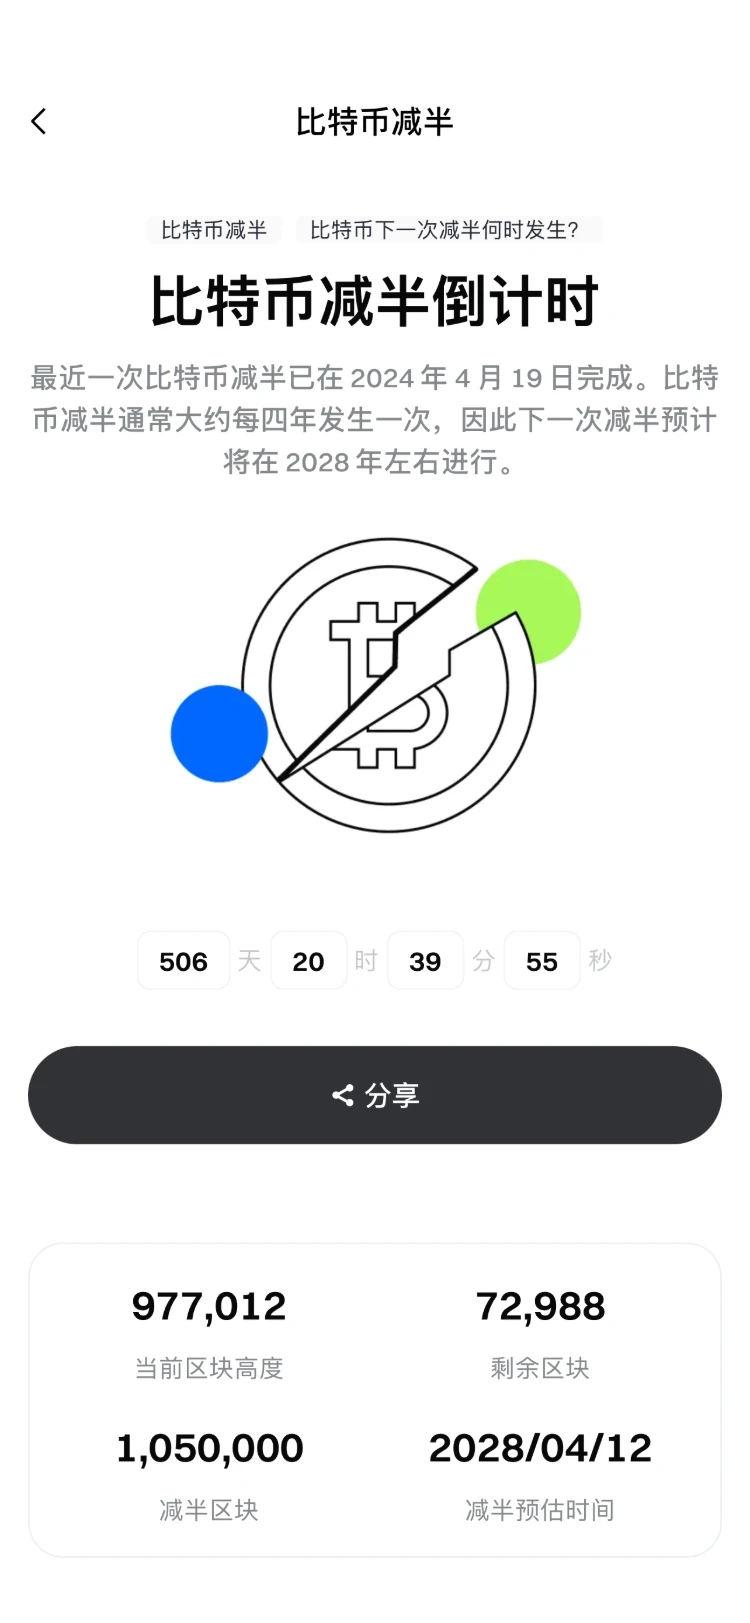
Only 6 days until the Bitcoin halving is 500 days away! Go all in! $BTC ‌
post-image
BTC-0.65%
  • 1
On the 4-hour chart, $SOL short from 68.8. Sellers must hold here. Price is approaching resistance. I want to see a rejection wick, not sideways chop within the zone. If the close is above 69.7, I’ll abandon this idea. On the 4-hour chart, price is 68.8, below the 73.3 EMA50, so sellers remain in control of the trend. The stop distance is 1.3%, and the TP3 target distance is 2.1%, for a 1.6R risk/reward ratio if reached. Short zone 68.70–68.85 | Targets 68.24, 67.88, 67.34 | Stop 69.67 Not investment advice · Do your own research
post-image
SOL-0.77%
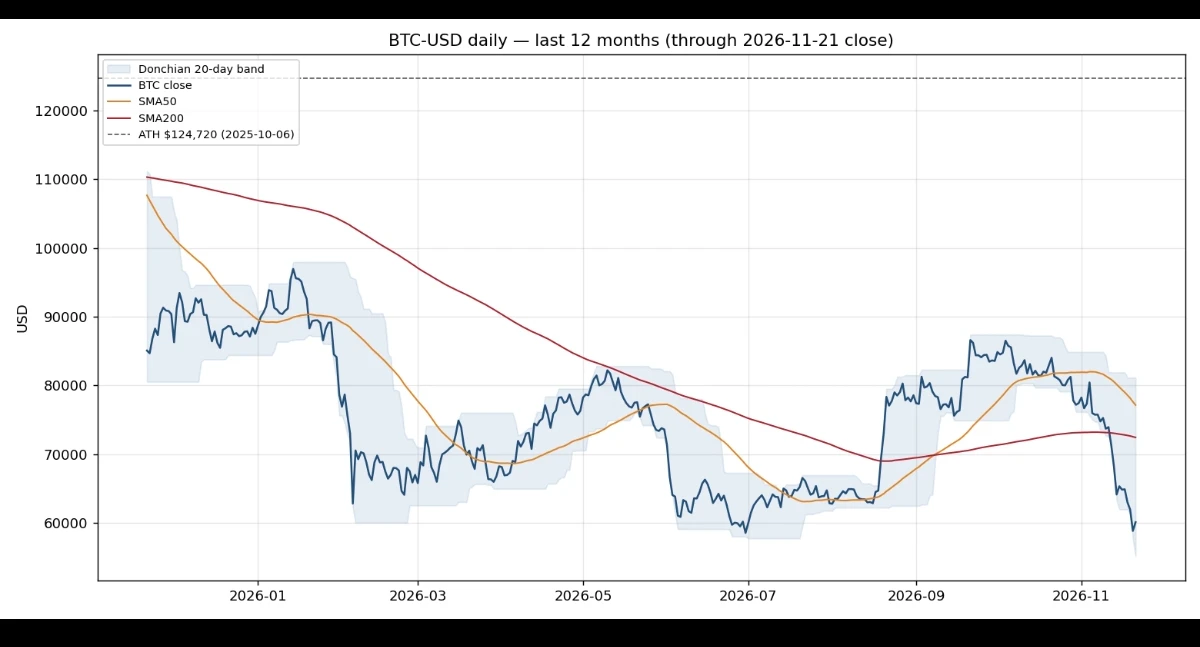
BTC daily signals, close 21 Nov $60,086, up 2.2% on the day, back above $60,000 after closing below it on Friday. 6 of 14 systems long: only 1 of 9 trend systems long, all 5 mean-reversion and sentiment systems long.

Price is 17.0% below the 200-day average of $72,426, so trend systems stay in cash.

RSI(14) 22.6, still oversold but up from 17.4, and fear and greed 12, extreme fear (latest 11 today). Donchian long trigger is a close above $81,131, far above price. 2xATR stop sits at $54,028.

No signal flips since yesterday, the split is unchanged.

$BTC ‌
post-image
BTC-0.67%
  • 3
#BTCReboundFaces60KTest
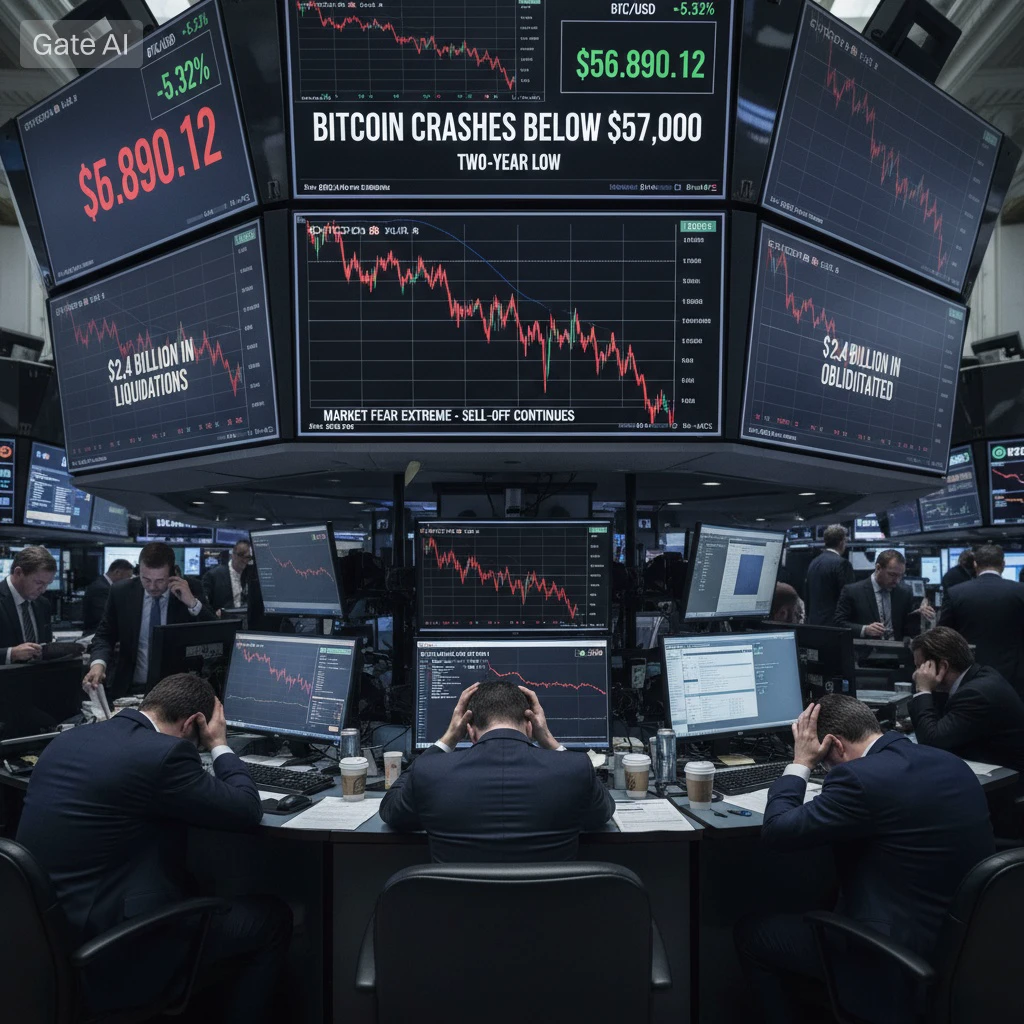
Bitcoin Crashes Below $57,000 — Hits Two-Year Low as $2.4 Billion in Liquidations Obliterate Bullish Traders$ANT

Bitcoin has just delivered one of its sharpest and most painful punches in recent years. In a brutal weekend session, the world’s largest cryptocurrency plunged below the critical $57,000 level, marking its lowest price since September 2024. The drop triggered a massive $2.4 billion liquidation cascade across crypto markets, almost entirely wiping out leveraged long positions and sending shockwaves through both retail and institutional desks.

At its worst
post-image
ANT-8.68%
BITCOIN MELTDOWN EXPLAINED: AI Stock Crash, Macro Storm & Gate.io Strategy!
live-cover
LIVE1,212
BTC-0.67%
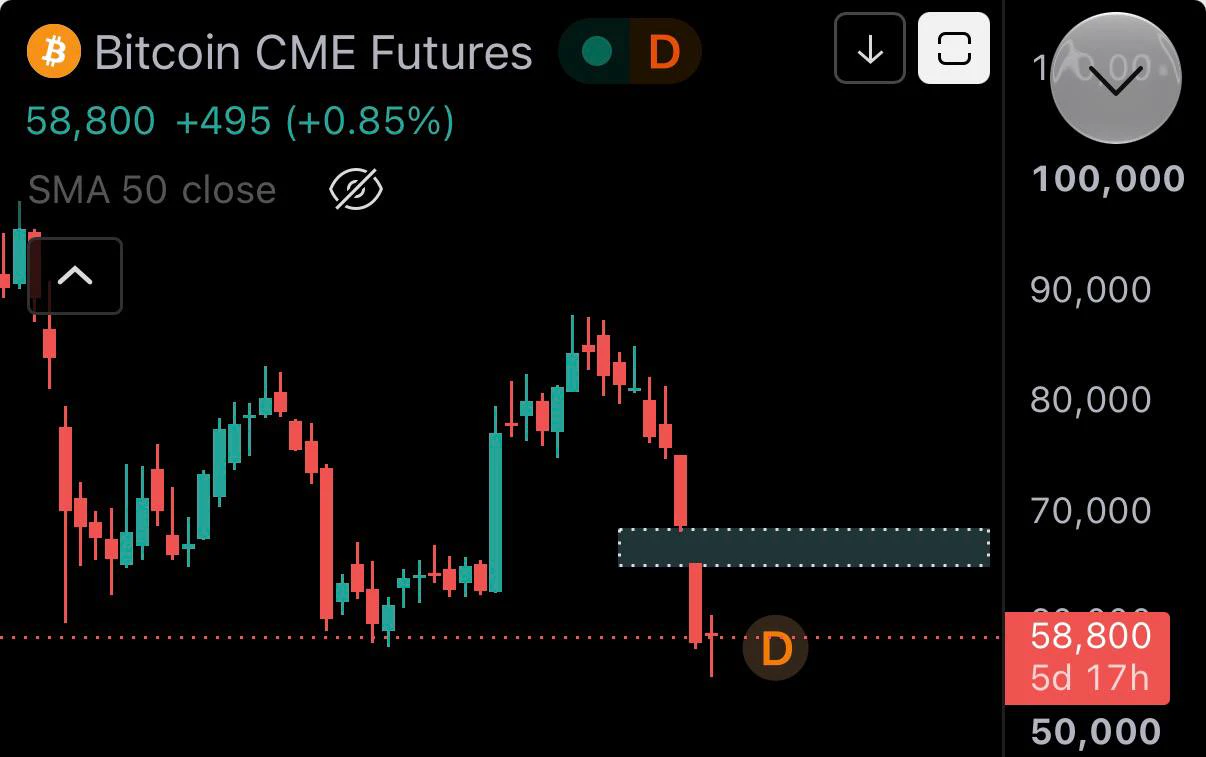
Bitcoin has created a new CME gap, and price often moves back to fill it.

BTC is already oversold after a massive drop.

If $55,000 holds without a daily close below it, we could see a recovery toward the CME gap soon.

#BTCReboundFaces60KTest
post-image
BTC-0.65%
  • 2
$BTC Yesterday’s price action offers a lot to review. Shortly after the open, a sharp sell-off hit, accompanied by a brief downside wick that flushed out a number of holders at lower levels. Near midday, the price fell back to the same support zone for a second test, essentially confirming the area once again. After two rounds of selling, buyers gradually stepped in at lower levels, and the price slowly recovered its losses, ultimately forming a candlestick with a long lower wick.
From a chart perspective, signs of a short-term pause in the decline have emerged. The 57000-58000 range is curre
post-image
BTC-0.67%
Load More

Join 40 M users in our growing community

⚡️ Join 40 M users in the crypto craze discussion

💬 Engage with your favorite top creators

👍 See what interests you

Trending Topics

BTCReboundFaces60KTest

2.1M Views30.1K Discussing

BTC rebounded from around $55,300 on November 21, briefly reclaiming $60,000 before pulling back to around $59,300. The $60K level is back in focus as traders assess whether the recovery can last. Is this rebound a sign of stabilization or a short-lived recovery? Would reclaiming and holding $60K be enough, or do you need confirmation from trading volume and fund flows?

PCEAndGDPDataNextWeek

258.2K Views2.6K Discussing

GateDirectIPOPhase3ANTAllocates92100Shares

817.6K Views5K Discussing

View More