Share your thoughts
placeholder
Article
#gStocks购买补贴最高返现1000U gStocks Purchase Subsidy Event is now live for a limited time, with a generous prize pool. First come, first served—come participate now 🔥🔥🔥
Event period: 2026-09-03 10:00 ~ 2026-09-13 10:00 (UTC), with approximately 6 days remaining until the end. Total prize pool: 100,000 USDT.
Participation requirements: Complete registration on the event page and pass identity verification; only data generated after registration will be counted.
Benefit 1: Purchase cashback (50,000 USDT prize pool)—meet both the net purchase and cumulative trading volume requirements to receive cas
post-image
  • 1
Nonfarm payrolls came in significantly stronger, sending gold sharply lower. After hitting around 4365 at the lowest point, buying support emerged, and the market has now entered a choppy recovery phase following the plunge.
After a large bearish candle formed on the four-hour chart, indicators entered oversold territory, creating short-term demand for a rebound and recovery; short-term moving averages on the daily chart have turned downward, with clear overhead selling pressure. Geopolitical risk aversion is providing bottom support and limiting a one-way decline, with the overall market trap
post-image
XAUT-0.47%
Why 55% confidence shorts on ARB still beat 90% certain longs.

$ARB /USDT - SHORT

Trade Plan:
Entry: 0.18575 – 0.18895
SL: 0.20274
TP1: 0.17581
TP2: 0.16812
TP3: 0.15658

Why this setup?
Range-bound 1D trend + 4h SHORT bias = mean reversion play.
- RSI 15m at 54.66 shows no oversold panic—room to drop.
- ATR 1h 0.0064 means tight stops, but TP1 at 0.17581 is 6% below entry.
- Entry zone 0.18575–0.18895 is the middle of the 4h channel—not a breakout, a rejection zone.
Why now? The range is compressing; the 0.20274 stop is far enough to survive noise, but TP3 at 0.15658 is the real
ARB-3.19%
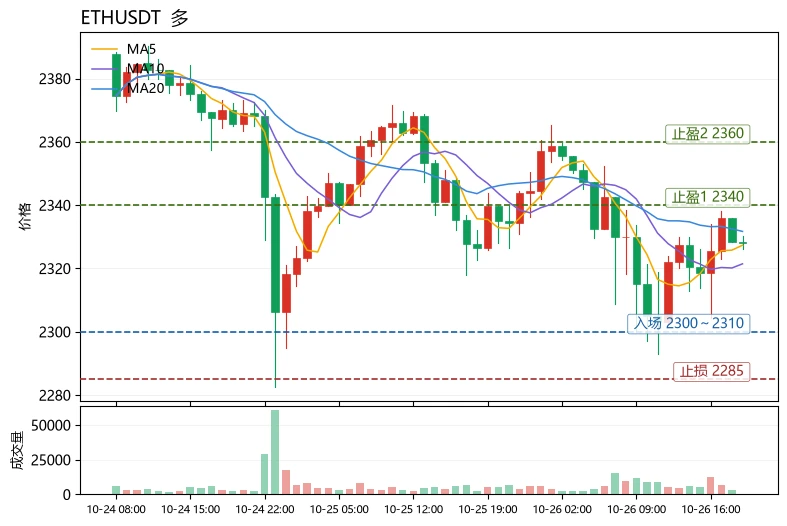
On September 7, 2026, the ETH contract market was in a high-level consolidation phase. Although the bullish structure on the daily chart remains intact, short-term upward momentum has weakened significantly. Combined with rising macro rate-hike expectations suppressing risk appetite, the current market is better approached with a range-trading strategy while patiently awaiting confirmation of the direction.
1. Market analysis: The bullish structure remains, but the short term has entered a “grinding” phase
· Bullish on the larger cycle, but under short-term pressure: The daily close held above
post-image
ETH+0.26%
Layout for Bitcoin, Ethereum, and Dogecoin
live-cover
LIVE3,883
  • 1
Go crazy using my token, otherwise it’ll go to waste....
Let me make a few crappy products first 👍
post-image
TOKEN-1.38%
Why has ZEC managed to chart an independent course? 🚨
A comprehensive breakdown of the underlying logic of the privacy sector⚠️
ZEC has charted an independent trend amid market volatility, gaining over 5x this year. Powered by zk‑SNARKs zero-knowledge proof technology, it supports both transparent and private transaction modes, with a total supply of 21 million coins. With additional tailwinds for the sector, institutional funds continue to flow in•
⛳️Anonymous or public: ZEC is smarter than you think #ZEC突破1200美元续刷新高
8 charts to help you quickly understand it #ZEC 👇👇👇$ZEC
ZEC+11.95%
  • 5
9.7 BTC analysis
Analysis: Go long on a pullback to around 2460-2480, with defense at 2440, first target at 2510, and second target at 2540
After Friday's nonfarm payroll data was released, market sentiment was rapidly released, and the price simultaneously followed BTC in falling sharply from the interim high of 2547.0, reaching an interim low of 2430.67. Short-term bearish momentum was concentrated and released during the sharp drop. After entering the weekend, market liquidity declined, and the market did not continue its downward trend, instead entering a period of range-bound recovery. Th
post-image
ETH+0.20%
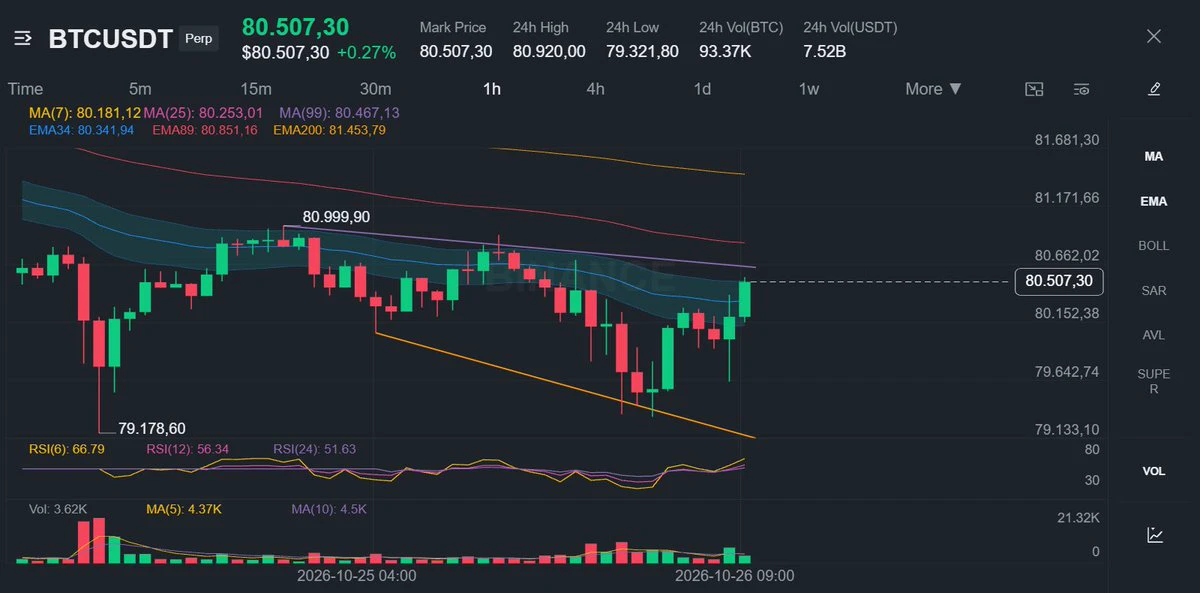
After recovering amid weekend volatility, BTC and ETH faced resistance after moving higher. Short-term bulls lack the strength to push upward, while selling pressure at elevated levels continues to be released. After the rebound, prioritizing a short strategy is advisable. Looking at the 4-hour chart, BTC dipped to a low on Friday, then moved into a volatile recovery on Saturday and Sunday. It tested the 80500‑80600 area in the morning but failed to hold above the 80k level, then came under pressure and retreated, with the candlestick closing with a clear long upper shadow. ETH’s movement was
ETH+0.26%
BTC-0.14%
9.7 Market Analysis
Bitcoin Strategy Reference Setup
Entry zone: around 79000–79500, long
Stop-loss: 78500
First target: 80500, second target: 81500
Bitcoin’s daily Bollinger Bands are narrowing, brewing a major move!
After pulling back to the lower band and briefly breaking below the middle band before recovering, bearish momentum has weakened, while buyers continue to provide support at lower levels.

The upper and lower Bollinger Bands are tightening, signaling calm before the storm.
The lower-band support has been repeatedly tested and held. With the price stabilizing above the middle ban
post-image
BTC-0.14%
ETH+0.26%
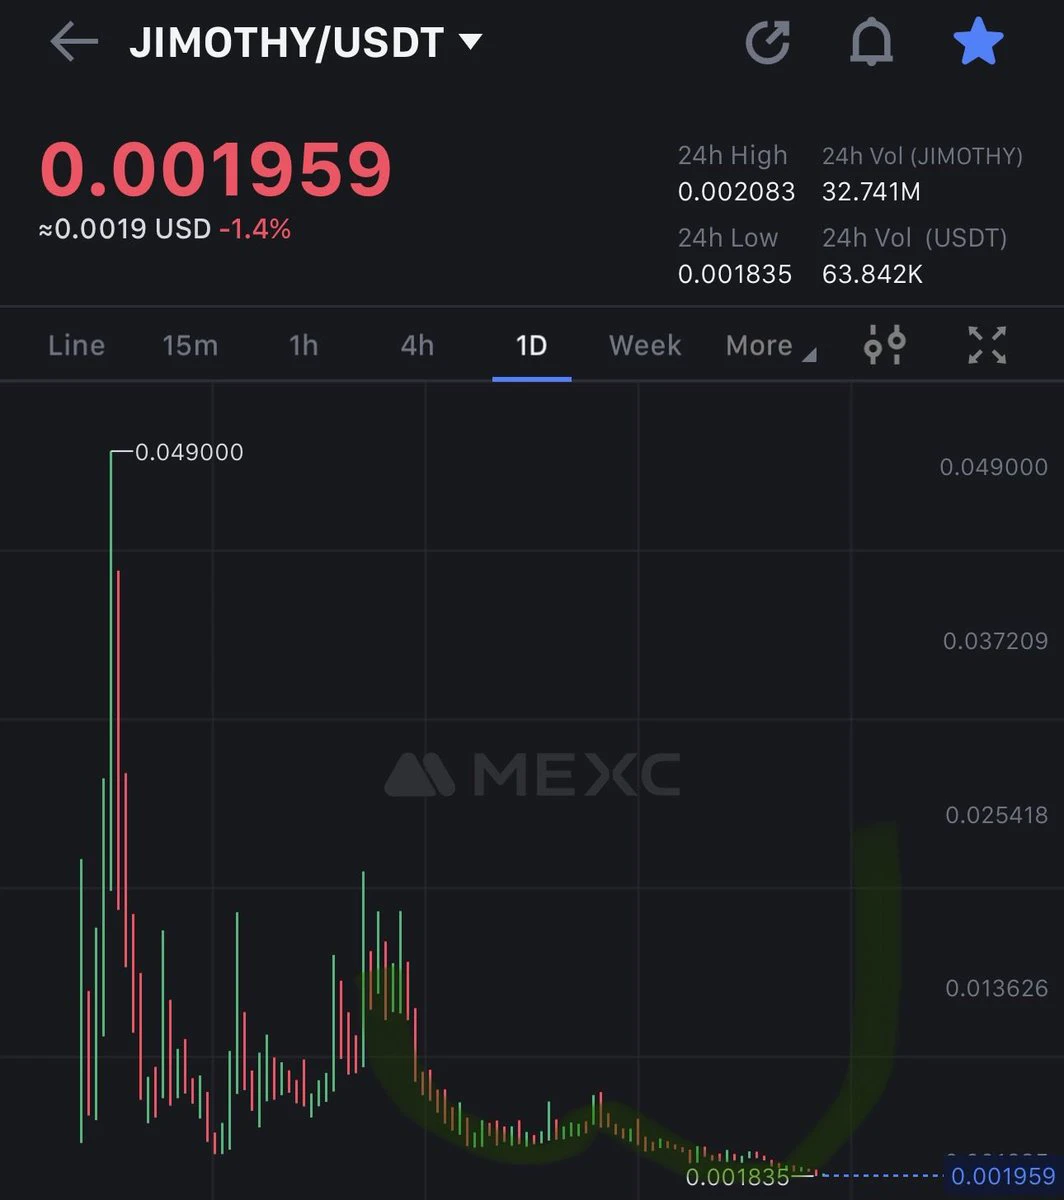
$Hajimi, come on, put some effort in!
post-image
哈基米-17.96%
Tong Ge’s 9.7 BTC strategy
$BTC 805—enter a short around 810, stop-loss at 815, first target 790, second target 780.
Current price: 79851. It surged to 80536 just now, only to be pushed back below 800 moments later.
The 805–810 range has been tested several times, but price failed to hold above it each time. Those above are eager to exit, while buyers below are not stepping in decisively. This move does not look like it is building momentum for now; it looks more like repeated confirmation of overhead resistance.
So don’t chase longs today. If volume comes in and price holds firmly above 815,
post-image
BTC-0.14%
I'm trading on Gate, a top-tier exchange with a 13-year track record. Come join me and dive into the hottest events right now! https://www.gate.com/campaigns/5961?ref=VLARBF1YAG&ref_type=132
post-image
$FLORK ’s short position has been fairly comfortable this time. After entering at 0.028294, I didn’t rush to look at the profit; I was waiting for a failed rebound followed by another sell-off. There was one minor pullback along the way, and many people thought a V-shaped reversal was coming, but volume failed to follow through. On the 4-hour chart, it couldn’t even reclaim the short-term moving averages, so there was no basis for a reversal. Instead, it looked more like buildup for a continuation of the decline. So I adjusted the stop twice and then left the position untouched.

The candles c
post-image
FLORK-7.75%
LAB-4.94%
BTC-0.14%
The bullish move may continue, and today could see a volatile upward trend. For specific trades, see you in the livestream. $BTC $ETH #BTC跌破8万美元 #Gate用户突破6000万 #Gate用户突破6000万 #红牛交易巡回赛第六期 #Hyperliquid团队提取3814万HYPE
post-image
BTC-0.14%
ETH+0.26%
Market prediction
live-cover
LIVE1,006
Spot gold:
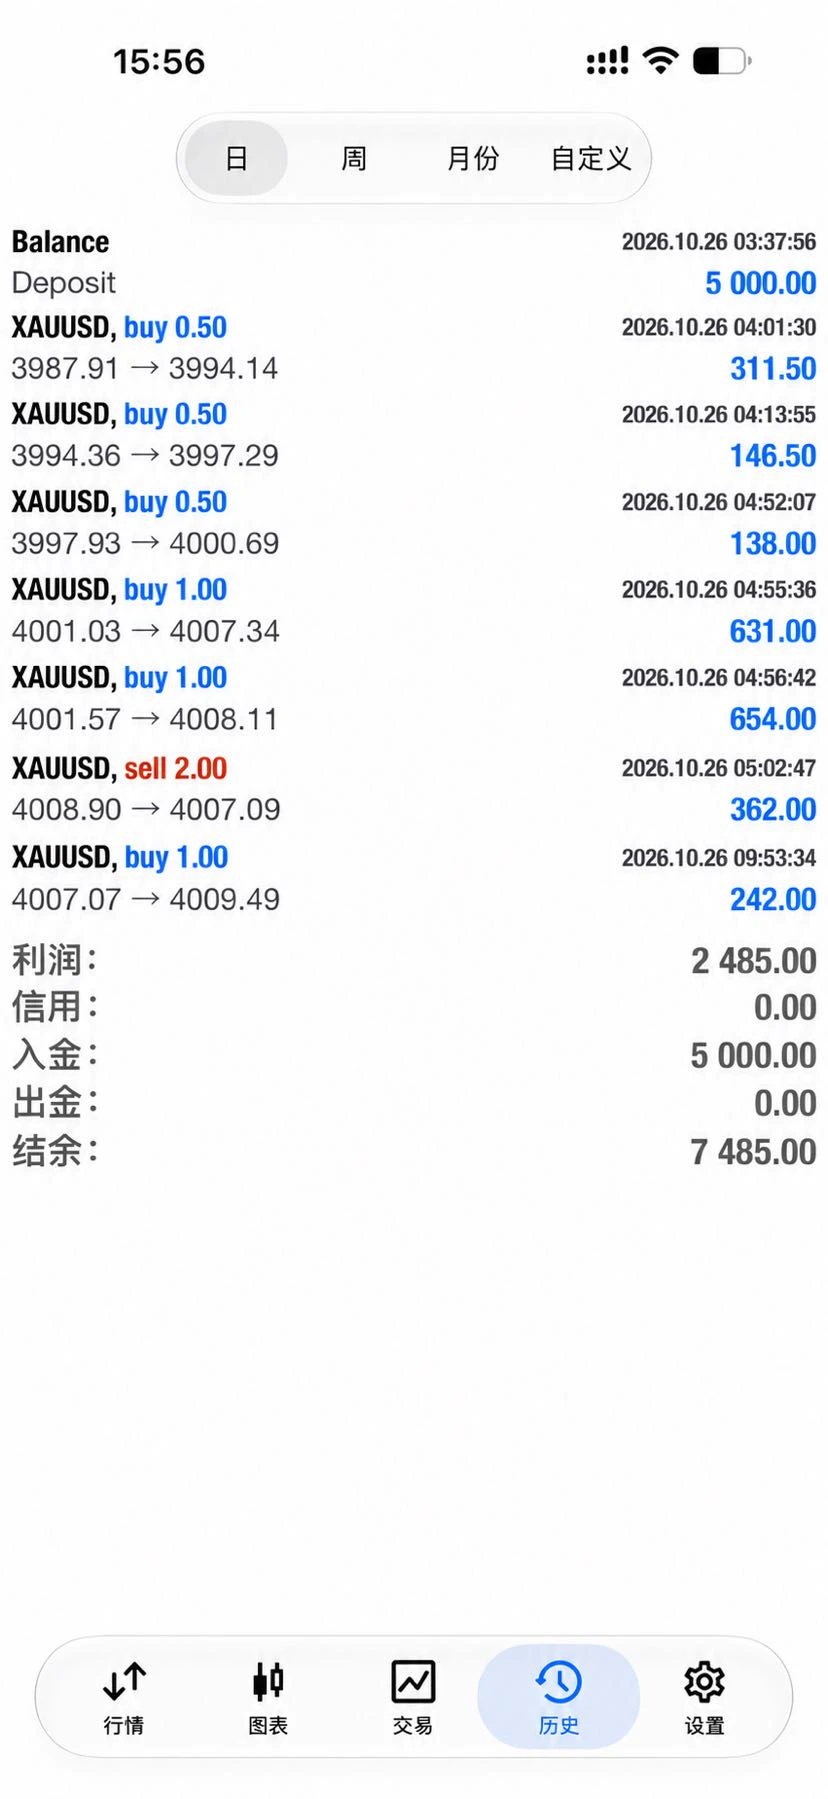
The northbound long position successfully locked in profits—congrats to everyone who got in!#黄金 #伦敦金 $XAUUSD
post-image
XAUUSD-0.52%
#AltcoinOISurpassesBitcoinforFirstTimeinOveraYear
BTC OI vs Altcoin OI — The Market Structure Is Changing
BTC OPEN INTEREST VS ALTCOIN OPEN INTEREST — THE BIGGEST DERIVATIVES SHIFT IN MORE THAN A YEAR
The crypto derivatives market is showing a major structural change. For the first time since December 2024, total Open Interest in Altcoin perpetual futures has moved above Bitcoin Open Interest. This is not simply another market statistic. It shows that derivatives exposure is shifting away from being primarily Bitcoin-focused and toward a much broader group of crypto assets.
WHAT IS BTC OPEN I
  • 1
$ZEC
ZEC is showing a strong +11.6% rebound from its 24h low of $1,062, but is stalling below the 24h high of $1,253. The shorter-term chart shows price below both MA5 and MA10, with bearish momentum indicators (MACD bearish crossover, RSI ~45). The longer-term chart shows price above MA30, suggesting the broader trend may still be recovering.
◇Overall bias: Short-term neutral-to-bearish within a larger recovery range. Expect consolidation between ~$1,140–$1,253 before next directional move.
🫟K Line (Candlestick) Observation
· Price is hovering near $1,190–$1,191, just below the MA5 ($1,1
ZEC+11.89%
DeepFlow TechFlow reports that on September 06, according to Coinglass data, ZEC broke above $1,200, with liquidations totaling $44.32 million over the past 24 hours, ranking first across the market. Short liquidations amounted to $41.86 million, while long liquidations amounted to $2.45 million.#ZEC突破1200美元续刷新高
ZEC+11.95%
  • 1
Load More

Join 40 M users in our growing community

⚡️ Join 40 M users in the crypto craze discussion

💬 Engage with your favorite top creators

👍 See what interests you