


Square
Following
Hot
News
Profile
Share your thoughts
placeholder
Article
BTC has been moving sideways for three days, with its price fluctuating back and forth within a range. Many traders are starting to feel anxious: should they go long or short?
In fact, the easiest mistake to make in a sideways market is to predict the direction of a breakout in advance.
There are three signals to watch when assessing a breakout.
First, trading volume. If volume continues to increase as the price approaches the top of the range, it indicates rising market participation. But rising volume alone does not mean the price will definitely go up; you also need to see whether it can ho
BTC-0.67%
#BTCBackAbove80K
Bitcoin’s return above $80,000 is not a speculative event; it is the logical outcome of structural market evolution and institutional validation.
The narrative surrounding digital assets has fundamentally shifted. Bitcoin’s reclamation of this valuation tier is no longer driven primarily by retail sentiment or transient hype cycles. Instead, it reflects a convergence of macroeconomic hedging, robust network fundamentals, and deepening integration into global financial infrastructure. For professional investors, this level represents a critical juncture where historical resist
post-image
BTC-0.67%
  • 3
Trenches
ZIG
Z
bade
b
ZIG
0x8c...1145
Market Cap
$.
Change
.
24h Vol
$.
Holders
.
BTC
B
bade
b
BTC
C5xp...pump
Market Cap
$.
Change
.
24h Vol
$.
Holders
.
HIGH
H
bade
b
HIGH
7ymF...high
Market Cap
$.
Change
.
24h Vol
$.
Holders
.
STONK
S
bade
b
STONK
6GmA...UNgx
Market Cap
$.
Change
.
24h Vol
$.
Holders
.
AMD
A
bade
b
AMD
DDmG...pump
Market Cap
$.
Change
.
24h Vol
$.
Holders
.
⚡ Trading opportunities move fast. How can you stay one step ahead?
Gate Live seamlessly connects livestreams with trading, letting you quickly jump to the K-line trading page & follow streamer strategies with one click for a faster, more efficient trading experience!
🔹 Interact with streamers in real time and understand their trading logic
🔹 Copy strategies with one click, simple and easy
🔹 Customize your order amount for more flexible copy trading
💰 Learn more: https://www.gate.com/announcements/article/37519

GateLive
⚡ Trading opportunities move fast. How can you stay one step ahead?
Gate Live seamlessly connects livestreams with trading, letting you quickly jump to the K-line trading page & follow streamer strategies with one click for a faster, more efficient trading experience!
🔹 Interact with streamers in real time and understand their trading logic
🔹 Copy strategies with one click, simple and easy
🔹 Customize your order amount for more flexible copy trading
💰 Learn more: https://www.gate.com/announcements/article/37519
repost-content-media
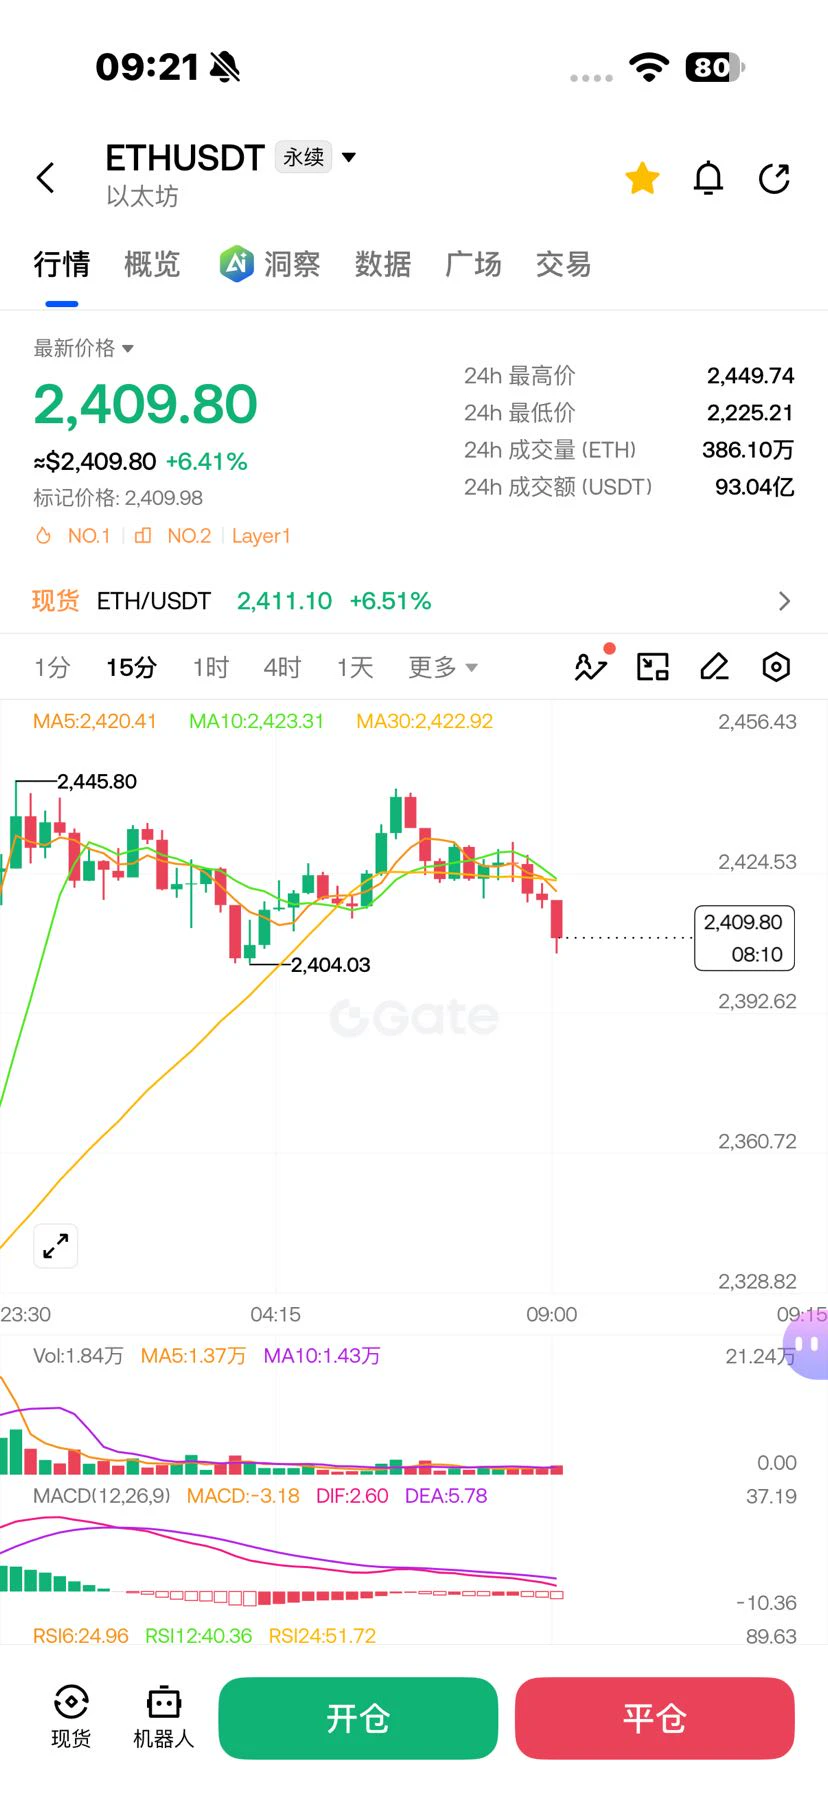
11.5 Market Analysis
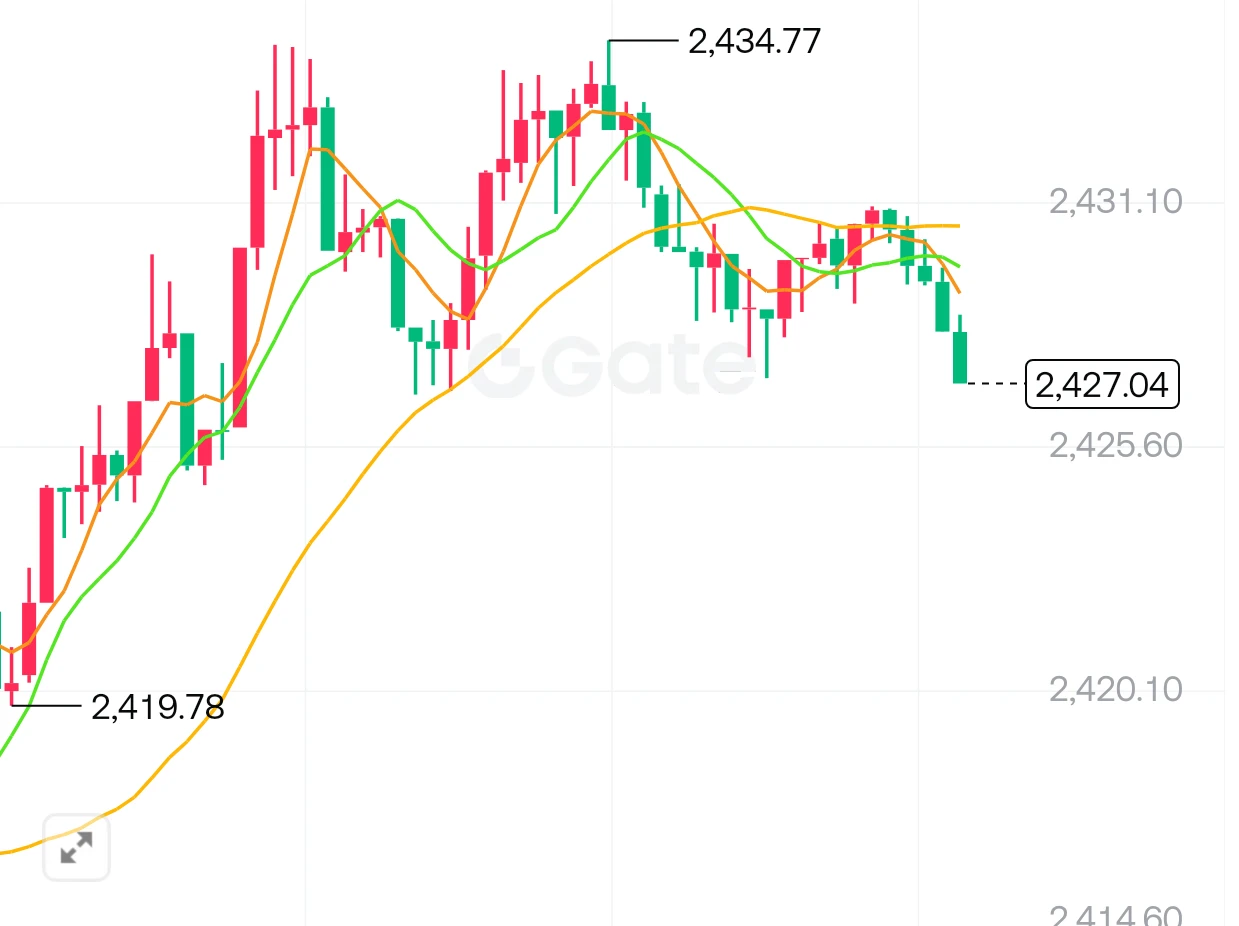
ETH Trading Strategy Reference Setup
Long entry zone: around 2400--2420
Stop loss: 2370
First target: 2450, second target: 2490
ETH has made a strong rally from 2172.85, with the candlesticks holding above the upper Bollinger Band and the MACD red bars continuing to expand, indicating a typical strong bullish trend. BTC has also rallied sharply in tandem, and bullish sentiment is strong. The current price is around 2432, in the pullback confirmation phase after the breakout. Positions can be opened if the pullback holds above the 2420 support; a slight pullback to around 2
post-image
BTC-0.65%
ETH-1.23%
Ethereum staking volume hit an all-time highwith the annualized yield falling to 2.63 in the third
live-cover
LIVE1,953
The market has started to pull back. If it breaks below 2,400 points on increased volume, it could continue lower#Gate上线台股交易
post-image
🔹Democrats Sweep Both Chambers of Congress as the Dow Surges Over 3! But AI Stocks Fall Across the
live-cover
LIVE1,863
$BTC is still locked in a tug-of-war around 80000 and attempting to recover, while $ETH has already moved into positive territory and $HYPE remains under pressure and weak. More frustratingly, despite ongoing progress in the perpetuals and decentralized trading ecosystems, prices have yet to show any meaningful response.
The most intriguing aspect of this market cycle is that sustained trading volume and protocol activity do not necessarily mean holders will see funds flow back in right away.
The latest development is that HYPE continues to advance the Hyperliquid network and ecosystem tool
post-image
ETH-1.26%
HYPE+0.24%
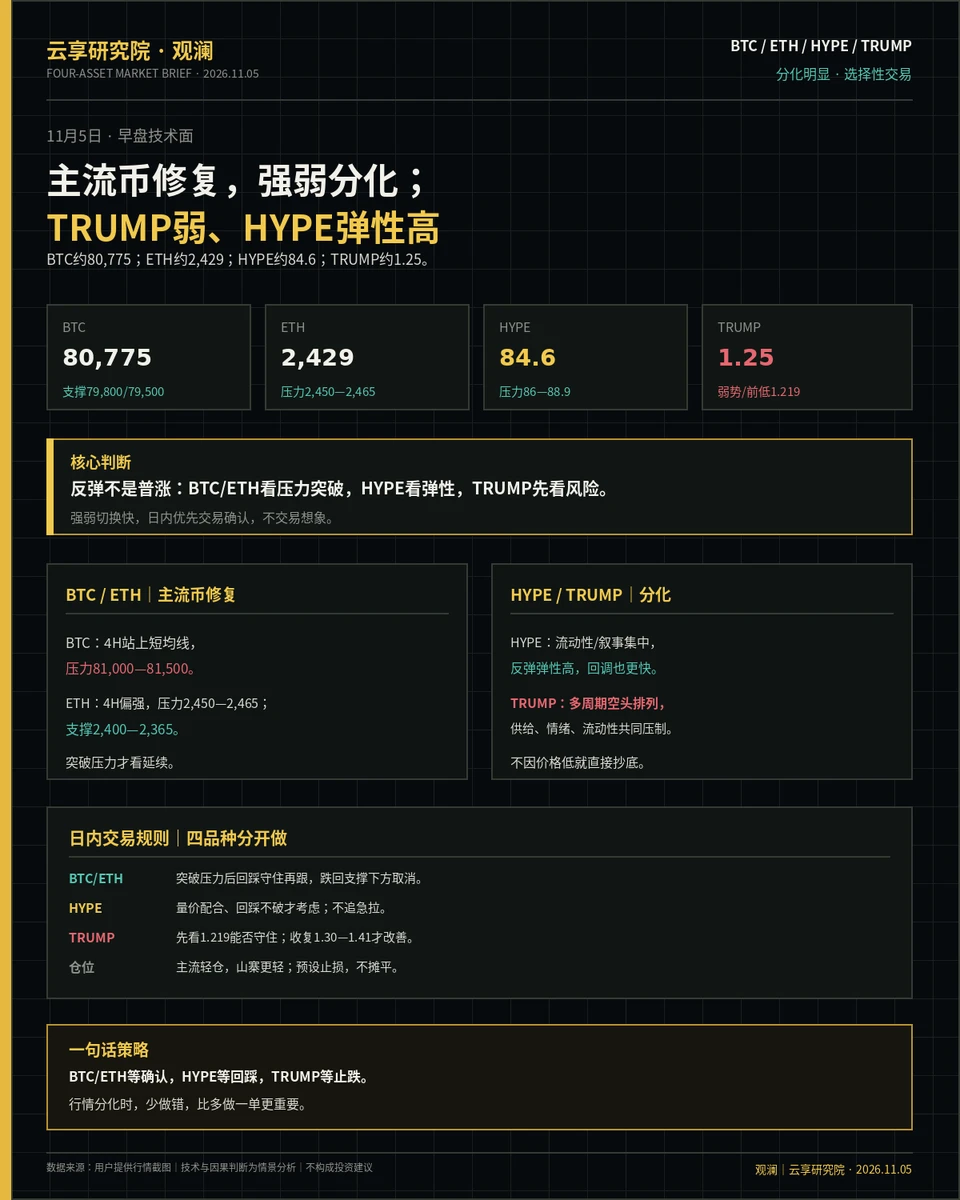
【November 5 Premarket | BTC / ETH / HYPE / TRUMP】
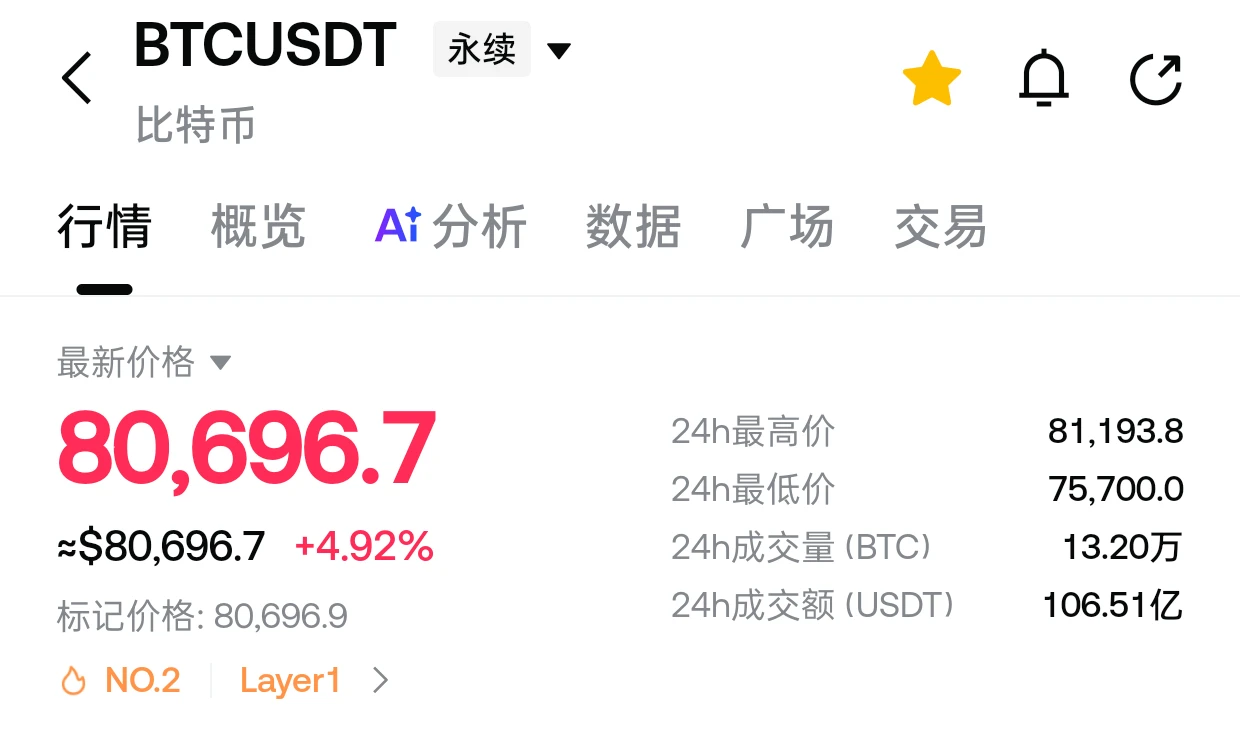
BTC is around $80,775. On the weekly chart, it has returned to near EMA5/10; on the 4-hour chart, it rebounded from a low of 75,736 and moved above the short-term moving averages. The short-term bias is bullish, but 81,000–81,500 is resistance. Support is at 79,800–79,500; a break below that points to 78,000.
ETH is around $2,429. On the weekly chart, it has recovered from a low of 2,174; on the 4-hour chart, it is above the short-term moving averages. Resistance is at 2,450–2,465, and support is at 2,400–2,365. A sustained hold above 2,465 wou
post-image
BTC-0.67%
ETH-1.26%
HYPE+0.24%
TRUMP-0.95%
#QualcommAndArmEarningsInFocus #ShareWeekly
Qualcomm vs. Arm: Two Semiconductor Giants, Two Very Different Growth Stories
The semiconductor industry is entering another important earnings moment, and I believe Qualcomm and Arm are among the most interesting companies to watch. Both are deeply connected to the future of computing, but their current business conditions reveal two completely different investment narratives. Qualcomm is navigating near-term pressure while attempting to build a stronger position in AI infrastructure, whereas Arm is benefiting from accelerating demand for data cent
QCOM+5.60%
ARM-5.13%
AMZN+6.14%
  • 2
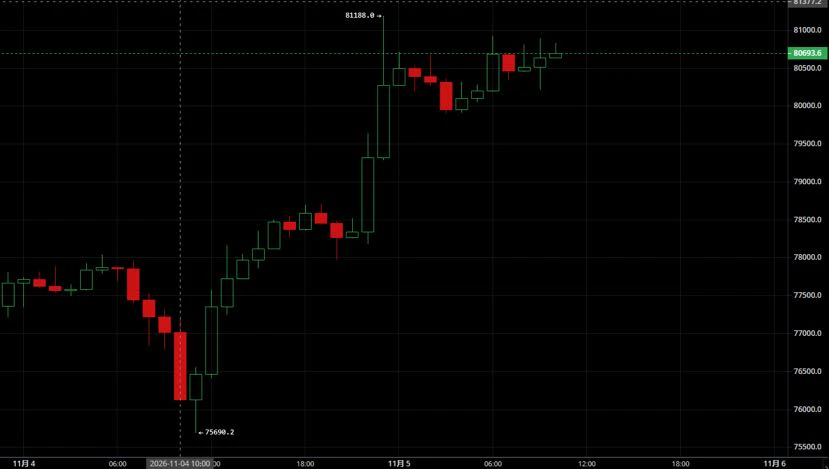
Yaoyao | 11.5 BTC Trading Outlook
Go long near 80000, with a stop loss at 79600. Watch for a breakout above the previous high of 81188.
If the rebound stabilizes near 81100, go short with a stop loss at 81400. Watch for a retest of 80000 support.
In the main upward leg from 75690 to 81188, 80000 is the consolidation midpoint and support following this rally. Previous pullbacks to around 80000 quickly recovered, with no high-volume breakdown or large bearish candle. This indicates that bullish funds are supporting the price at this level, making it the bulls’ defensive level in this rally.#BTC重
post-image
BTC-0.67%
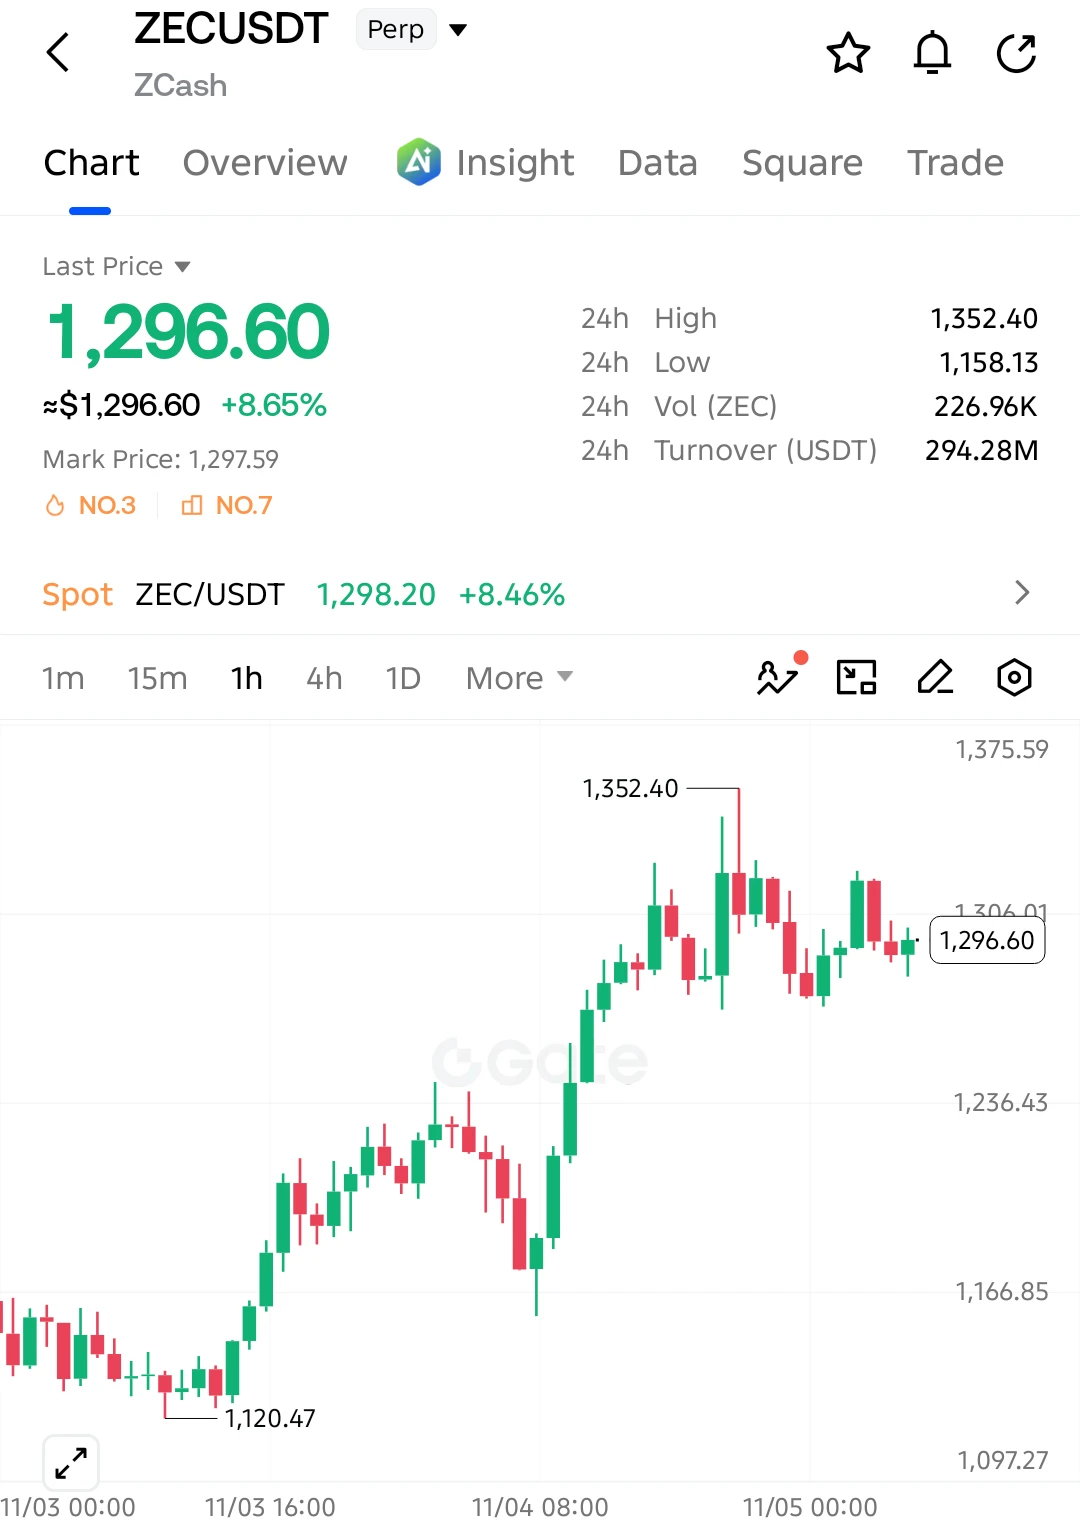
$ZEC BULLS ARE NOT DONE YET! 🚀
$ZEC is up 8.65%, and buyers are still defending the higher price levels after a strong rally!
LONG SETUP
Entry: 1296.60
SL: 1265.00
TP1: 1320.00
TP2: 1352.40
TP3: 1385.00
Final Target: 1420.00
ZEC is consolidating near 1300 after a powerful bullish move. As long as buyers defend the 1270–1280 support zone, another push toward 1352 and potentially 1400+ remains possible.
Invalidation: A sustained break below 1265 weakens the bullish setup.
post-image
ZEC+1.16%
  • 3
  • 2
SNDK, go long at the current price of 1021, add to the position at 970, stop-loss at 950, target around 1250. $SNDK
post-image
SNDK-0.18%
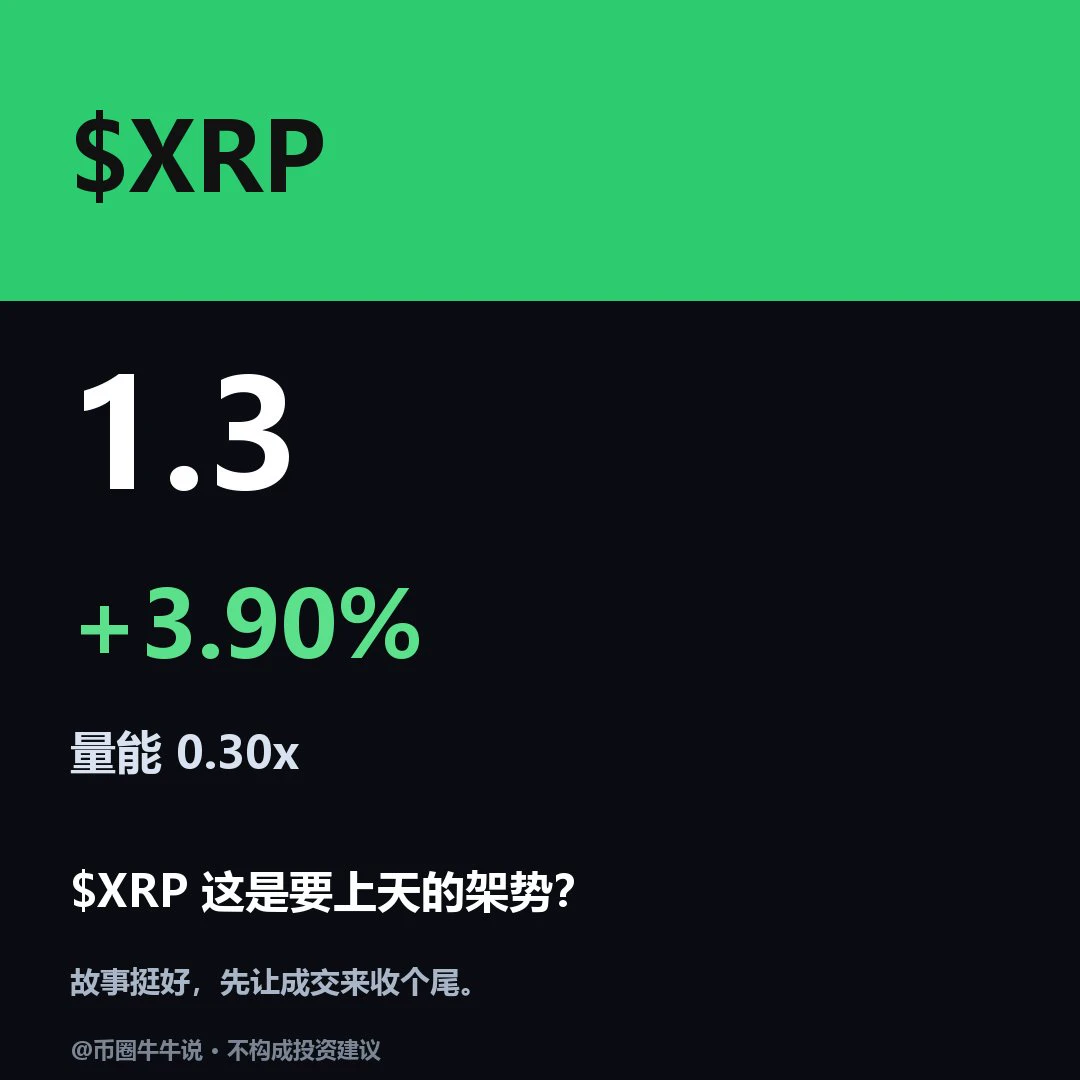
$XRP Currently at 1.3002, 24H +3.90% (1.242–1.342). The 1H and 4H charts are both tilted bullish, with RSI at 56.79 and 68.40, respectively. The current price is above the 1H EMA20 at 1.2972 and the 4H EMA20 at 1.2780. However, the 1H volume ratio is only 0.30, indicating limited appetite for chasing higher prices. If the price holds above the 1.342 resistance, watch for a continuation; if it breaks below the 1.242 support, the short-term outlook may weaken. In the follow-up review, check whether 1.342 holds and whether the price can recover after losing 1.242. With the volume ratio at 0.30x,
post-image
XRP-1.15%
11.5 Market Analysis
BTC trade setup reference
Entry zone: around 80000–80500, long
Stop loss: 79400
First target: 81500, second target: 82600
After a sharp rally, price is consolidating at highs—is this a top after a spike, or a buildup for a second push higher?
The market is currently in a high-level consolidation phase, and the bulls still have the momentum to push further upward.
The daily chart closed with a large bullish candle featuring a long lower wick. A single probe lower held the short-term bottom. As long as price successfully breaks above 82000, a daily-chart uptrend can official
post-image
BTC-0.65%
ETH-1.23%
IT Home, citing AppleInsider, reported that Apple shares closed at $349.51 on November 4 local U.S. time, up 5.31%, setting a new record closing high. The company’s market cap was $5.08 trillion, about $0.60 above the previous record set on October 29.
Apple’s Q4 revenue was $114.5 billion, iPhone revenue was $57.6 billion, and it received a second tariff refund. The results were indeed strong, but the new high was only about $0.60 above the previous record. With a market cap of $5.08 trillion, this new high looks more like a marginal pass.
$BTC
AAPL+5.39%
BTC-0.67%
#美光#'s support level of 812.85 has been reached. Let's see whether it can rebound. See Figure 2 for my take. $MU ‌
MU-0.63%
OIL IS UNDERVALUED
I AM PUTING BIG FAT LONG HERE AT $87
US IRAN DEAL DIDN'T HAPPEN AT ALL
OIL PRICES CRASH MAKES NO SENSE. PURE MANIPULATION.
BUY/LONG OIL 🛢️
EASY PROFITS
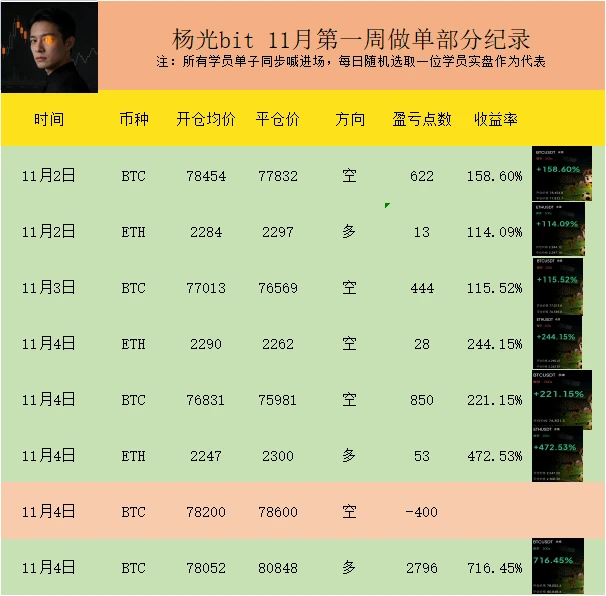
Many people share their trading results, showing only their winning trades and hiding their losses, creating the image of a god who never makes a mistake. I don’t do that. My short trade was wrong, so I accepted the 400-point loss—no adding to the position, no stubbornly holding on. Then I recognized the reversal, went long, and made 2796 points, earning back the loss and then some. Eight trades: 7 wins and 1 loss. That’s what trading really looks like.
In the end, trading isn’t about who never makes a mistake; it’s about who can admit when they’re wrong immediately and adjust right away. Stub
post-image
BTC-0.65%
ETH-1.23%
Load More

Join 40 M users in our growing community

⚡️ Join 40 M users in the crypto craze discussion

💬 Engage with your favorite top creators

👍 See what interests you

Trending Topics

BTCBackAbove80K

10.46k Views41.05k Discussing

After a sharp dip, Bitcoin climbed back above $80,000 on May 9 and is currently trading around $80,200. Over 50,000 traders were liquidated in the past 24 hours amid fierce long-short battles. The recurring Iran-U.S. tensions remain the primary short-term variable. Following U.S. airstrikes, Iran\'s Revolutionary Guard claimed to have breached the Strait of Hormuz defense line, leaving the ceasefire outlook uncertain. On the technical side, the daily SMA20 ,$77,970 serves as key support, with the RSI recovering from oversold levels to 43. The $80,000 level is both a psychological barrier and a bull-bear dividing line.Holding above it could lead to a challenge at $85,000, while a break may trigger a retest of the $77,000 area.

DemocratsWinBothChambers

15k Views402 Discussing

GateLaunchesTaiwanStockTrading

13.42k Views262 Discussing

View More