
Square
Following
Hot
News
Notifications
Profile
Share your thoughts
placeholder
Article
TODAY LIVE TECNICAL WITH SIGNALS
live-cover
LIVE2,056
ETH-1.26%
BTC-0.67%
SOL-0.77%
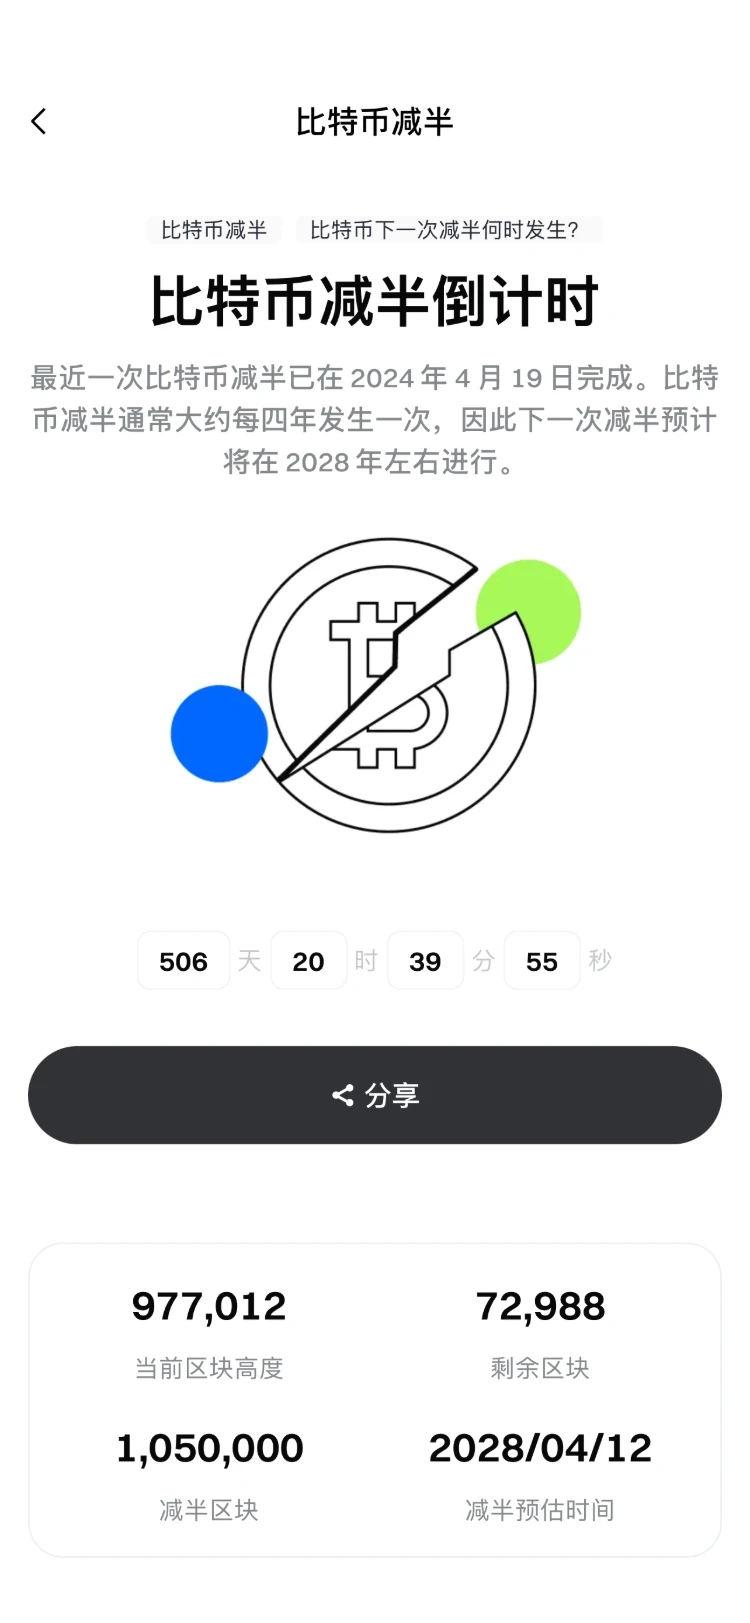
Only 6 days until the Bitcoin halving is 500 days away! Go all in! $BTC ‌
post-image
BTC-0.65%
  • 1
Trenches
IDOL
I
bade
b
IDOL
0x3b...ab07
Market Cap
$.
Change
.
24h Vol
$.
Holders
.
JAGENT
J
bade
b
JAGENT
0x8e...ae15
Market Cap
$.
Change
.
24h Vol
$.
Holders
.
PIEVERSE
P
bade
b
PIEVERSE
0x0e...25a9
Market Cap
$.
Change
.
24h Vol
$.
Holders
.
FIONA
F
bade
b
FIONA
B34n...pump
Market Cap
$.
Change
.
24h Vol
$.
Holders
.
mihao
m
bade
b
mihao
4Cxj...pump
Market Cap
$.
Change
.
24h Vol
$.
Holders
.
#PCEAndGDPDataNextWeek
#ShareWeekly
PCE and GDP Data Next Week: Will Inflation and Economic Growth Trigger the Next Global Market Move?
Global financial markets are approaching another major economic turning point as investors prepare for the upcoming US Personal Consumption Expenditures (PCE) inflation report and Gross Domestic Product (GDP) data. These two releases could significantly influence expectations surrounding Federal Reserve interest-rate decisions and determine the direction of financial markets heading into December.
From Bitcoin and Ethereum to Wall Street equities, gold, bonds
BTC-0.67%
ETH-1.26%
XAU+0.38%
XRP-1.15%
SOL-0.77%
🔹 X renowned trader mk4 closed out BTC short positions, capturing nearly $7,000 drop
live-cover
LIVE1,598
NVDA-13.84%
TSLA-7.56%
AAPL-1.83%
META-5.82%
SKHY-13.06%
Good morning, market recap
Continuing to hold my OP long position. Yesterday was the only strong rebound this week, shifting from liquidating longs to liquidating shorts and completing a round of leveraged liquidations. Personally, I don't think this is a reversal. Bitcoin at 60000 and ETH at 1650 are both key levels.
It would be good news if OP holds above 0.068 today.
Nvidia's accounting investigation has yet to be resolved. This rebound was driven by leveraged liquidations. I don't know when U.S. stocks will stabilize.
Only if it stabilizes along with Bitcoin might my OP have a chance.
Stay
post-image
OP-1.31%
NVDA-13.84%
BTC-0.67%
  • 1
  • 1
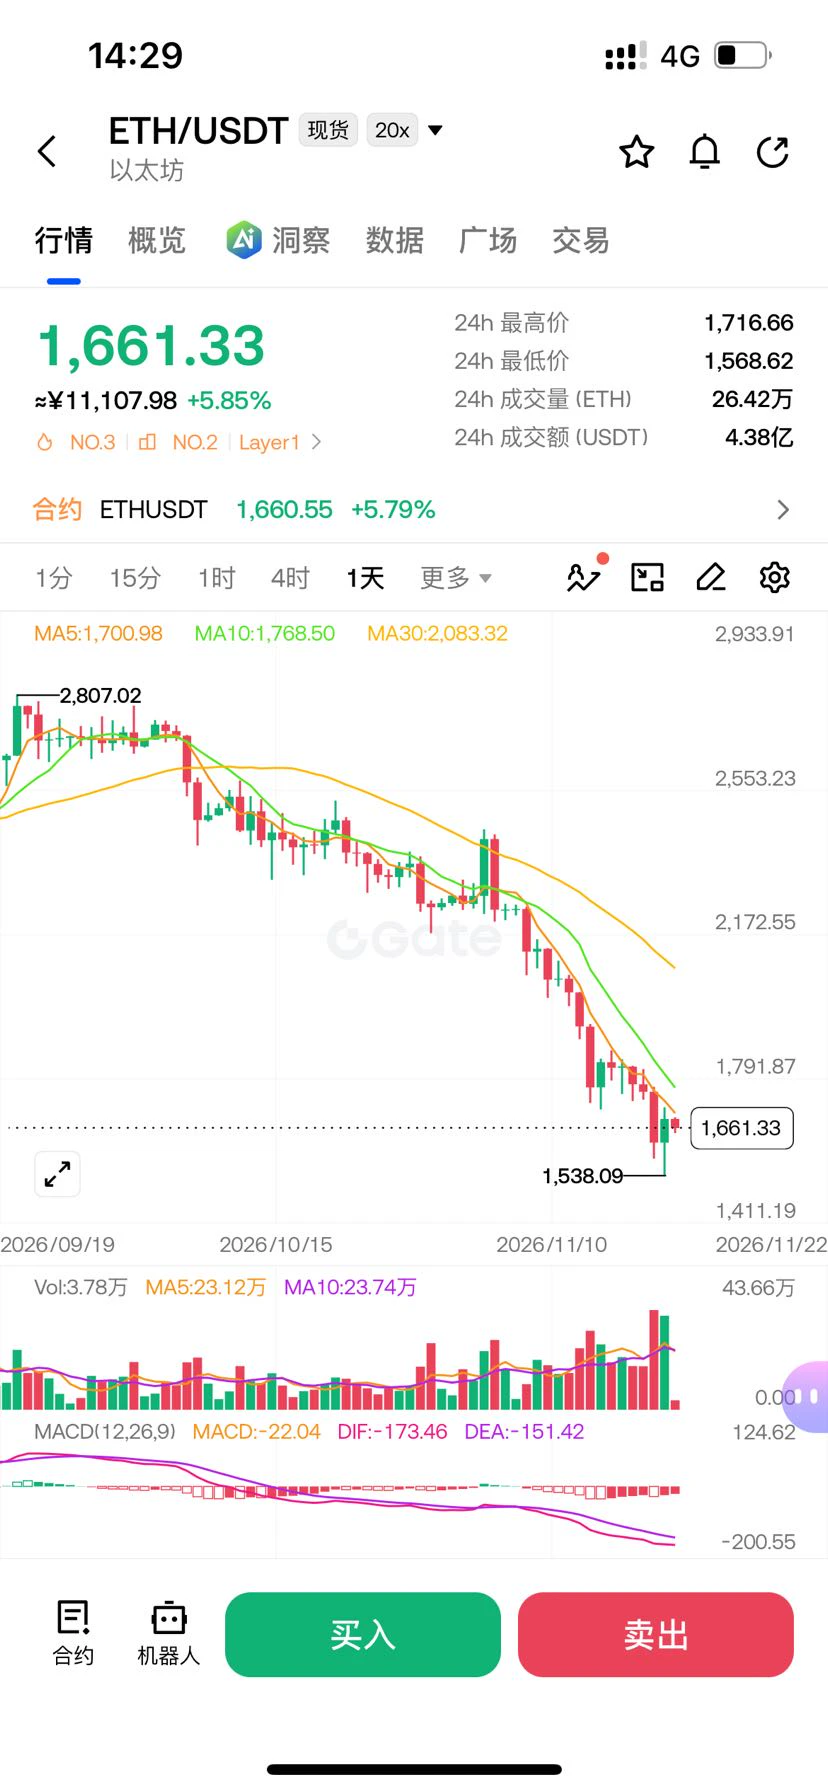
November 22, 2026 (Sunday) ETH Futures Analysis for Today (based on the current range of around $1,660–$1,690)
Core view (bearish, oversold rebound)
ETH has fallen sharply from above $2,000, touching around $1,540 over the past two days before rebounding to around $1,680. The daily chart structure remains bearish, while the RSI is in oversold territory. A technical rebound is possible in the short term, but significant resistance lies overhead. Sunday liquidity is lower, so prioritize shorting rebounds, with buying pullbacks to support as a secondary strategy. Keep positions small.
Today's Str
post-image
ETH-1.23%
#美国11月初请失业金人数高于预期
At first glance, a softer U.S. employment reading should give beaten-down risk assets room to breathe. Yet when the U.S. Department of Labor reported that initial jobless claims rose to 203,000 for the week ending November 14 coming in above Wall Street’s 197,000–198,000 consensus forecast the Nasdaq Composite still dropped roughly 2.25%–2.3% that session (before plunging another 5.28% on Friday, November 20), while Bitcoin broke decisively below $60,000 to test the $55,123–$58,914 zone into November 22, 2026.
Understanding why mildly cooler labor data failed to spark a reli
post-image
NDAQ-0.95%
NVDA-13.84%
BTC-0.67%
BLK-3.02%
IBIT-5.97%
Bitcoin plunged below $60k, triggering a chain reaction of $15.5 billion in liquidations. Insiders at Abraxas Capital bought up $897 million in BTC as the market fell.
liquidations Abraxas Capital
Bottom line: Strong liquidity outflows, but major players are using the dip to accumulate.
$NVDA ‌
post-image
NVDA-13.84%
  • 1
#GoldNears3500 Spot gold (XAU/USD) is staging a sharp technical rebound toward $3,578 per ounce on November 22, 2026 bouncing cleanly off Friday’s multi-month capitulation low near $3,514 after testing the critical $3,500 psychological floor. For active traders, this high-volatility inflection between $3,500 support and $3,600 resistance highlights why Gold Contracts for Difference (CFDs) on Gate TradFi paired with the Gate Card Points System have become a premier toolkit for capturing two-way precious-metal momentum while turning everyday expenses into digital assets (BTC, ETH, USDT, and GT).
post-image
XAUUSD-2.40%
BTC-0.67%
ETH-1.26%
GT-2.41%
XAGUSD-3.80%
#BTCReboundFaces60KTest
BTC Below $60K: Has the Market Entered a Deeper Bear Phase?

Bitcoin's break below $60,000 has changed the technical structure. What was previously a support test has now become a potential resistance zone, and the market needs to reclaim it before any meaningful recovery can be confirmed.

What Is Driving the Selloff?

This decline is being fueled by several factors working together:

1. Hawkish Fed expectations

Persistent inflation, resilient economic data, and hawkish FOMC commentary are keeping rate expectations elevated. A higher-for-longer interest-rate environm
post-image
BTC-5.94%
  • 2
  • 1
$ETH That guy who collateralized 180k ETH to borrow 214 million U—the one whose liquidation price I checked at noon, 1401—is still sitting right where he was.

Today I spotted another whale transferring 65 million U to an exchange, clearly ready to buy. Put the two side by side and it’s absurd: one has the market at his throat, watching how far ETH is from 1190; the other is sitting on bullets, waiting for a lower price. Same chart, two fates.

ETH bounced more than 6% today, closing at 1663, but looking back, it was still above 2300 a month ago. This rally feels like no rally at all—just anot
post-image
ETH-1.26%
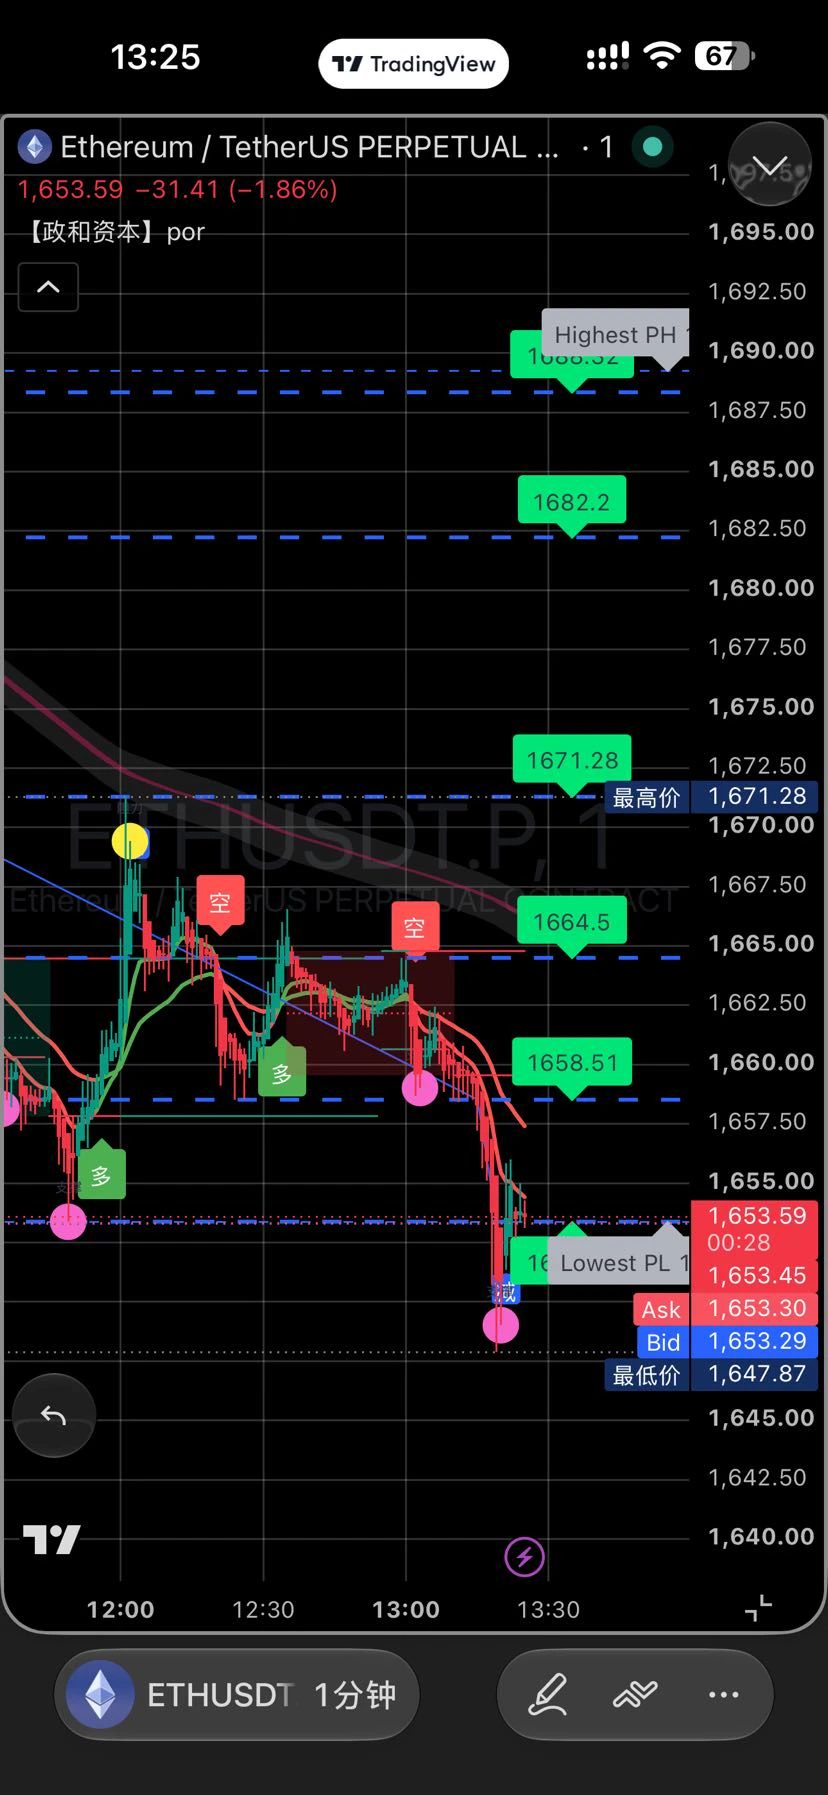
📈Nov 22 Midday Market Outlook📈

$ETH 思路:

ETH broke above 1680 on volume; chase longs on the right side and tighten the stop loss.

ETH broke below 1661 on volume; chase shorts on the right side and keep a stop loss in place.

If a pullback to 1600 confirms support, add one lot long; stop out if it falls below 1559.

If ETH holds above 1680 on the hourly timeframe, look for 1725-1768.

Watch 1725 overhead for a one-lot short; stop out if it breaks above 1768.

Left-side wick order: long at 1536, stop out if it falls below 1481.

Resistance above: 1680-1725-1768
Support below: 1661-16
ETH-1.23%
I love Shenzhen's weather so much; it's not cold at all.
Everyone here loves working out~ They're not only grinding to make money but also grinding to stay healthy—impressive in every way.
When it comes to P-background, GPT is still the only one I respect.
post-image
Netflix's SBF "Love Story" is so bad it crashed the market...
post-image
NFLX-2.87%
#PCEAndGDPDataNextWeek 📊 PCE and GDP Data Next Week: A Major Test for the US Economy and Crypto Market

The financial markets are preparing for an important week as investors await the latest US Personal Consumption Expenditures (PCE) inflation data and Gross Domestic Product (GDP) report. Both economic indicators will be released on Wednesday, November 25, 2026, at 8:30 AM ET.

These reports could influence Federal Reserve policy expectations, the US dollar, Treasury yields, gold, Bitcoin, and the broader cryptocurrency market.

1. What Is PCE Inflation?

Personal Consumption Expenditures (P
post-image
BTC-0.67%
ETH-1.26%
XAU+0.38%
#BTCReboundFaces60KTest

CAN BITCOIN HOLD ABOVE $60,000 AFTER BOUNCING OFF $55,300 AND SLIPPING BACK NEAR $59,300?

Will Bitcoin's quick jump back above $60,000 on November 21 turn into real stability, or is the pullback toward $59,300 a sign that sellers are still waiting overhead? After touching lows around $55,300—its weakest stretch since September 2024—Bitcoin rebounded above $60,000 before easing back toward the $59,300 area. Because round numbers act like magnets for both buyers and sellers, watching how price behaves around $60,000 gives a clear window into market strength.
CEO Econom
BTC-0.67%
When I wrote this morning that 60,000 had failed to hold
I thought today's numbers would stop around 59186
I didn't expect another leg down in the afternoon
At 13:45, spot lows were 58636 on one side and 58650 on the other
It was around 58874 when I took the screenshot
Yesterday's 55106 at 14:17 is still there, and 55000 hasn't been retested
What changed was the 59,000 level; it also failed to hold in the afternoon
From the intraday high of 60883, it was down about 3.7%
There is no closing price over the weekend; these are all intraday prices
I have no further judgment, so I'll just record thi
post-image
$STRK Short setup underway: sellers are finally about to act 👀
Plan to establish a short position in the 0.02984–0.02993 range $STRK , waiting for a clear rejection signal from price here. If the 0.0299 level above successfully holds as resistance, watch for downside targets of 0.0294, followed by 0.0290. Conversely, if price reclaims 0.0304, the entire short thesis is invalidated, and you should exit promptly.
🔴 Short setup entry range: 0.02984–0.02993 Take-profit targets: 0.02956 / 0.02935 / 0.02903 Stop-loss level: 0.03041
Technical confirmation: On the 4-hour timeframe, price at 0.0299
post-image
STRK-3.55%
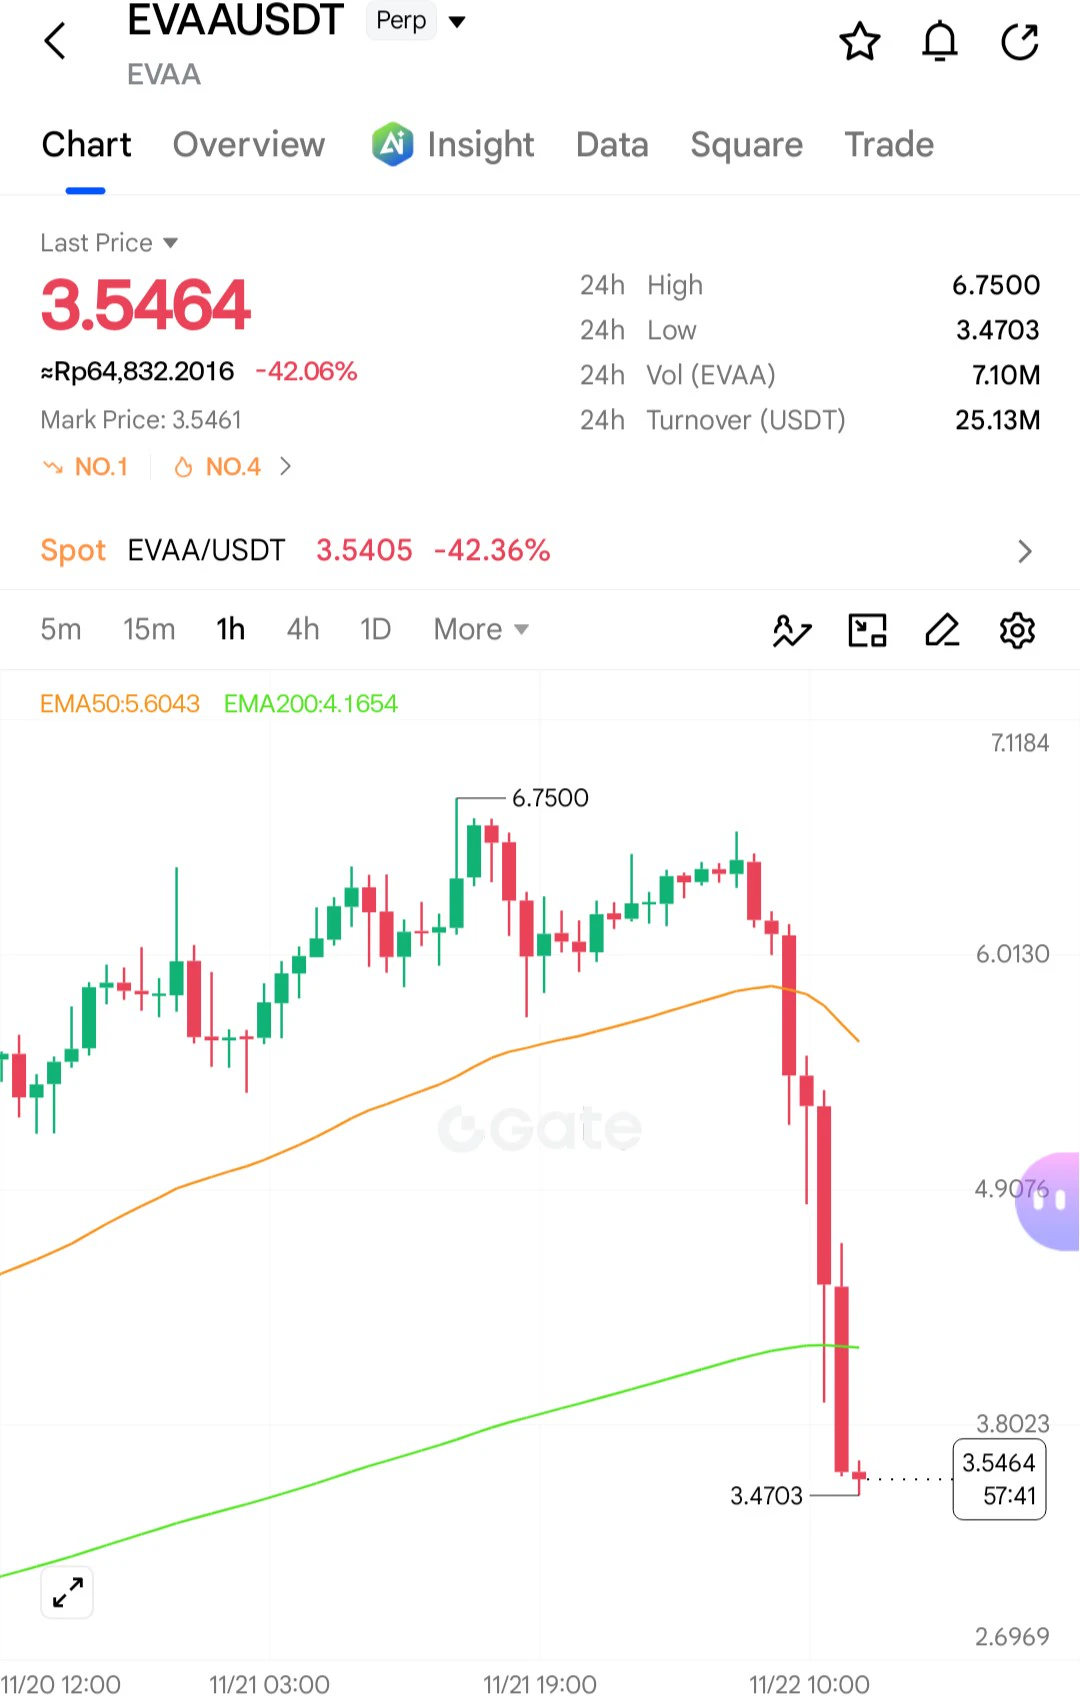
EVAA immediately moved lower after touching $6.7, without bouncing back up 🤣
$EVAA ‌$AKE ‌$ZEC ‌
post-image
EVAA-0.42%
AKE+6.39%
ZEC+1.29%
  • 3
Load More

Join 40 M users in our growing community

⚡️ Join 40 M users in the crypto craze discussion

💬 Engage with your favorite top creators

👍 See what interests you

Trending Topics

BTCReboundFaces60KTest

2.1M Views30.1K Discussing

BTC rebounded from around $55,300 on November 21, briefly reclaiming $60,000 before pulling back to around $59,300. The $60K level is back in focus as traders assess whether the recovery can last. Is this rebound a sign of stabilization or a short-lived recovery? Would reclaiming and holding $60K be enough, or do you need confirmation from trading volume and fund flows?

PCEAndGDPDataNextWeek

258.2K Views2.6K Discussing

GateDirectIPOPhase3ANTAllocates92100Shares

817.6K Views5K Discussing

View More