Share your thoughts
placeholder
Article
I was just about to curse it out, but then I looked at my account—forget it, it can pump however it wants. I’ll keep quiet.
When the whole screen was glowing green, I shorted once. Everyone in the market was chasing longs, and I said it smelled strongly of a bull trap. $SKYAI surged, but no one followed. Sure enough, it fell back down.
From 0.06198 to 0.051, the +434.41% gain has been achieved. The brothers on board should be waking up laughing. Close 70% first to lock in the gains, then move the stop loss on the remaining 30% to the breakeven price, regardless of what it does next.
The market
post-image
SKYAI-7.81%
XRP-3.70%
SOL-2.34%
I originally wanted to cut my losses and sacrifice to the heavens, but the sacrifice never happened—the meat cooked itself.

When I thought this move was completely over, my short position was still showing an unrealized loss, and I really wanted to close it with one click and go to sleep. But after reviewing it several times: every rebound was pushed back down, and volume never picked up at all, showing that the selling pressure above had truly not dissipated. I gritted my teeth, moved my stop-loss lower, and decided to give it one more night.

When I opened the charts this morning, what a
post-image
DOGE-2.92%
SNDK-4.15%
XRP-3.70%
The short strategy at the 365-day moving average level, with the coin price at 82222, has multiplied the principal 11x in 8 days and successfully come to a close!
Subscription special price: 8.8, today only. Subscribe and get on board—the next big trade is being laid out!
post-image
  • 3
I did nothing—just went to the restroom, and when I came back, the candlesticks had already done the work for me.
When the dump started in the early session, $BOME ’s rebound looked weak no matter how you looked at it. Every step down from the highs came with volume, while each rebound grew lighter. The trapped holders overhead were plainly weighing on the market; the funds only wanted to sell into the rebound, and no one was genuinely willing to take the other side. I followed the short direction at 0.0011263, with protection set above the rebound platform. I only reminded everyone of one thi
post-image
BOME-3.92%
BNB-1.41%
BTC-1.86%
#USTreasuryToBuyBackUpTo6Billion
U.S. Treasury Just Tripled Its Bond Buyback — But Look at the Yield
The U.S. Treasury announced a buyback of up to $6 billion of 10- to 20-year Treasury bonds on Thursday.
At first glance, $6 billion sounds massive. But the important part is the context: the U.S. Treasury market is worth more than $32 trillion. Against that size, the buyback is still relatively modest.
What makes this more interesting is the change in scale.
The operation is three times the normal size, and the Treasury has committed to conducting future operations of at least $4 billion. That
  • 3
  • 1
Regardless of which generation of iPhone you use, daily tasks remain unchanged. $PI
post-image
PI+0.46%
  • 1
I typically don't do this, but I have staked my $DTF.
APY on this is solid and the flywheel is pretty good.
All fees buy tokenized stocks which go back into LP's and keeps the treasury growing.
Looks good @DefiTradedFund
post-image
$1000 to $100,000 Crypto Trade Challenge Today
live-cover
LIVE758
Everyone is sleeping on this ETH setup while the 1h ATR whispers something else.

$ETH /USDT - LONG

Trade Plan:
Entry: 2436.67 – 2447.19
SL: 2391.41
TP1: 2479.82
TP2: 2505.08
TP3: 2542.97

Why this setup?
Why now? The daily trend is bullish and the 1h price is sitting at 2441.93, right inside a tight entry zone between 2436.67 and 2447.19. The 15m RSI at 38.58 shows room to run before overbought, and the 1h ATR of 21.049541 confirms the move has real momentum behind it. TP1 sits at 2479.82, with TP2 at 2505.08 offering the real reward, and the invalidation level at 2454.93 is the hard line
ETH-0.68%
Insiders are watching $ADA /USDT break a range that has held for weeks.

$ADA /USDT - LONG

Trade Plan:
Entry: 0.2039 – 0.2055
SL: 0.1944
TP1: 0.2125
TP2: 0.2176
TP3: 0.2254

Why this setup?
Why now? The daily trend is range, but the 1h ATR of 0.003314 signals a compression explosion is overdue. The 15m RSI sits at 28.64, showing the last dip was extreme enough to flip momentum. Entry is defined at 0.2047, with a tight zone between 0.2039 and 0.2055 to catch the bounce cleanly. The invalidation level at 0.2110 is the line in the sand that proves the range is truly broken.

Debate:
Are we h
post-image
ADA-2.60%
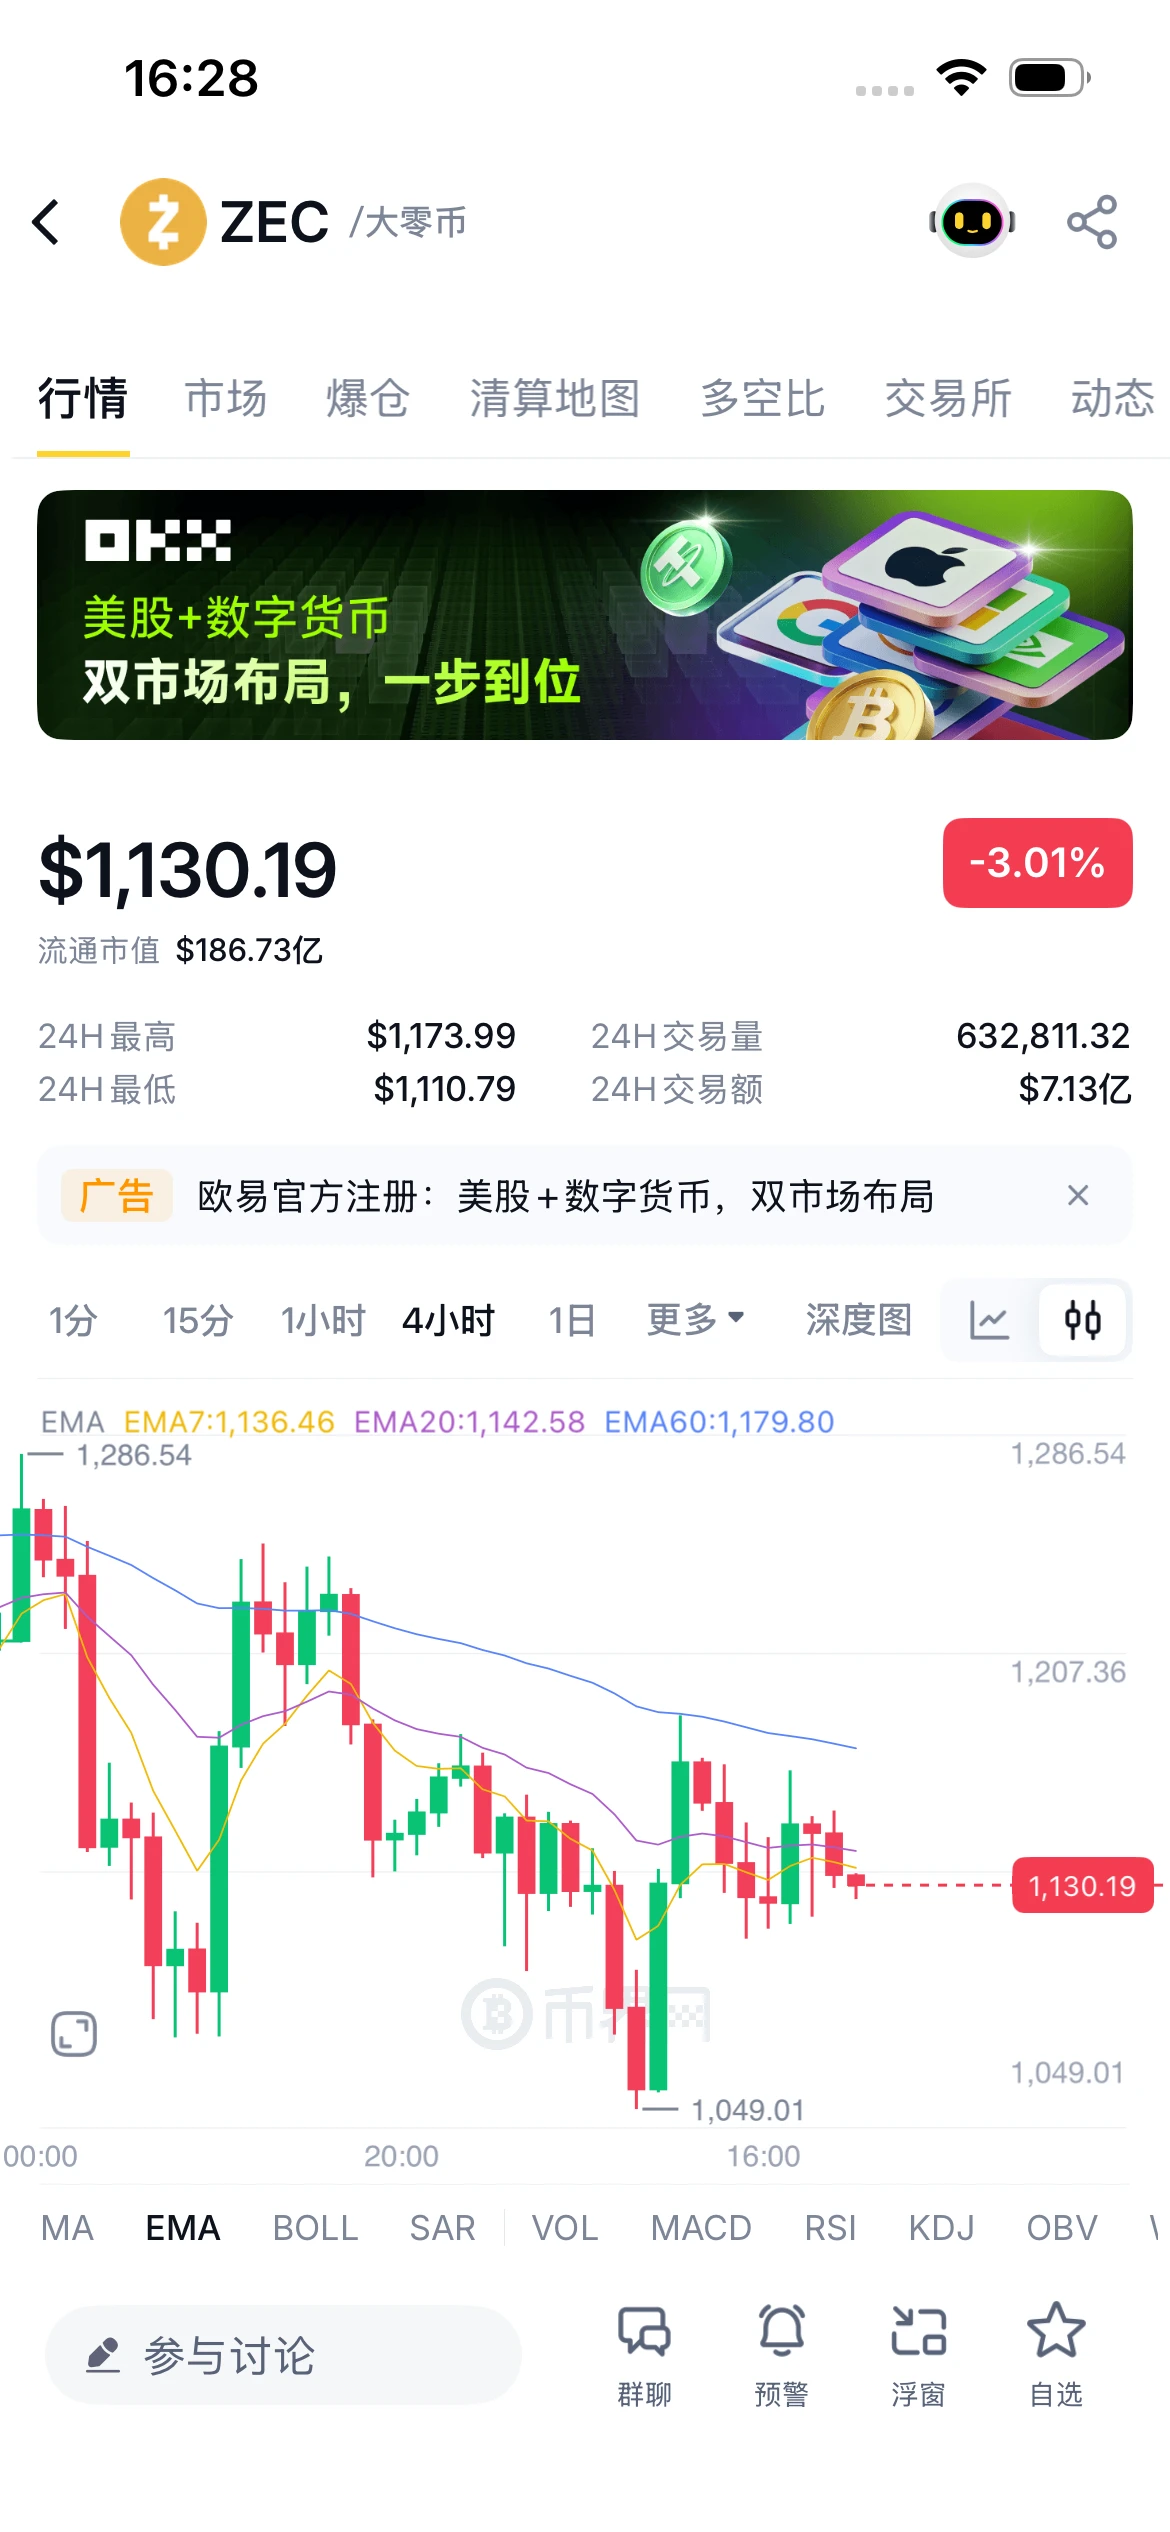
Why is everyone ignoring ZEC when the setup looks this clean?

$ZEC /USDT - LONG

Trade Plan:
Entry: 1076.87 – 1091.85
SL: 990.93
TP1: 1154.43
TP2: 1201.15
TP3: 1271.23

Why this setup?


Debate:
Are we hitting TP2 at 1201.15 or getting trapped before the daily close?

⚠️ Personal market analysis only. NFA — manage risk and DYOR.
Educational content, not investment advice or a recommendation to buy, sell, deposit, or withdraw any asset. No paid promotion or referral/affiliate links.
ZEC-12.28%
The institutions’ door is opening wider and wider, with 72.36% crowded into longs: $ETH is stuck at 2447, unable to move
Wow, the institutions’ door is opening wider and wider—the Singapore Exchange has received CFTC authorization to offer Bitcoin and $ETH perpetual futures to U.S. institutions, while the price is stuck at 2447.79 (-0.178%), with long bets at 72.36%. I’m short-term bearish and will reduce positions on a rebound.
Bearish logic: First, it is the eighth day of a MACD death cross above zero, while RSI at 61.0 cannot push the price higher; second, the long-short ratio is 2.6179 a
ETH-0.50%
Insiders are quietly pressing SHORT on SYMBOL while the range traps longs.

$SKHY /USDT - SHORT

Trade Plan:
Entry: 186.65 – 187.69
SL: 192.17
TP1: 183.42
TP2: 180.92
TP3: 177.18

Why this setup?
Why now? The 1h price sits at 187.17 inside a tight entry zone between 186.65 and 187.69, giving a clean short setup. The 15m RSI at 36.67 shows bearish momentum without being oversold, leaving room to fall. The 1h ATR of 2.08207 confirms enough volatility to reach the first target at 183.42 and the second target at 180.92. The daily trend is range, so mean reversion favors downside from this level
SKHY-4.06%
Is LINK about to break out while everyone is sleeping on this bullish setup?

$LINK /USDT - LONG

Trade Plan:
Entry: 11.450 – 11.520
SL: 11.052
TP1: 11.810
TP2: 12.026
TP3: 12.351

Why this setup?
Why now? The daily trend is clearly bullish, setting the stage for a continuation move. The 1h price sits at 11.485, right at the entry zone, while the 15m RSI at 34.54 signals oversold conditions that often precede a bounce. The 1h ATR of 0.138815 shows enough volatility to push toward the first target at 11.810 and potentially reach the second target at 12.026. However, the invalidation level at
LINK-2.17%
#GateGloballyLaunchesStockEventContracts Quick 5-Min Price Action Update!
​After a sharp bounce on the chart, some consolidation can be seen. The market movement for the next 5 minutes may look something like this:
​Short-Term Outlook: The bulls have shown a strong recovery, but there is pressure for a slight pullback or sideways movement on the current candle.
​Key Levels to Watch: If this support holds, another small push upward may occur.
​Caution: Volatility is high on short timeframes, so trade with a tight stop-loss!
​Disclaimer: This is only a technical observation, not financial advice
post-image
ready for a decade of dormancy?
just remember that ten years of dormancy can turn into something special after
RIP van winkle
post-image
$BTC we just tagged the purple line once again. Once we break below this $74,000 will be right around the corner. See the market update video from this morning as I talked about this scenario
post-image
BTC-1.73%
How is this a rebound? This is CPR for my empty account, isn’t it? The last thing I saw before bed a few days ago was $NBIS repeatedly oscillating around 224.85. I saw that volume wasn’t following and there were no buyers higher up, so I decisively went long, went long.
Before the market had fully started moving, I said it was forming a base without breaking down, with funds quietly entering. This level was worth a try.
When I opened the charts this morning, the price had already touched 226.97, with +18.75% right there. Feeling good, brothers.
Take profit on 80% first, and let the remaining
post-image
NBIS-3.64%
LAB-7.33%
SNDK-4.15%
#GateLaunchesTrenchesWith0GasFee
Gate Trenches VELO is at the point where the next candle matters more than the last candle.
VELO is around $0.02337, showing a 12.14% gain, with about $146.9K turnover, $1.52M liquidity, and a market cap near $21.39M. The move is interesting because price was compressed for a while around the $0.0233–$0.0234 area before buyers suddenly pushed it toward $0.02351.
That tells me buyers are testing the top of the range, but it is still only a test.
The level I care about most is $0.02350–$0.02355. If VELO can break this zone, stay above it and successfully retest
post-image
  • 2
  • 1
Load More

Join 40 M users in our growing community

⚡️ Join 40 M users in the crypto craze discussion

💬 Engage with your favorite top creators

👍 See what interests you