Share your thoughts
placeholder
Article
Everyone’s staring at $MU /USDT’s 1017—but the 4h tape is screaming something else entirely.

$MU /USDT - SHORT

Trade Plan:
Entry: 1016.16 – 1017.94
SL: 1025.64
TP1: 1010.61
TP2: 1006.32
TP3: 999.87

Why this setup?
- 1D is *range*, not trend—so this isn’t a breakout play; it’s a mean-reversion snipe.
- RSI on 15m sits at 57.31—weak momentum, not exhaustion—meaning longs lack fuel to clear 1025.
- ATR 1h = 3.58 → tight stops, but TP1 at 1010.61 is only 6.4 points away—quick grab if 1017.05 holds as rejection.
- Why now? Price is parked at entry_ref with a 55.4 SHORT edge—waiting for
MU+0.20%
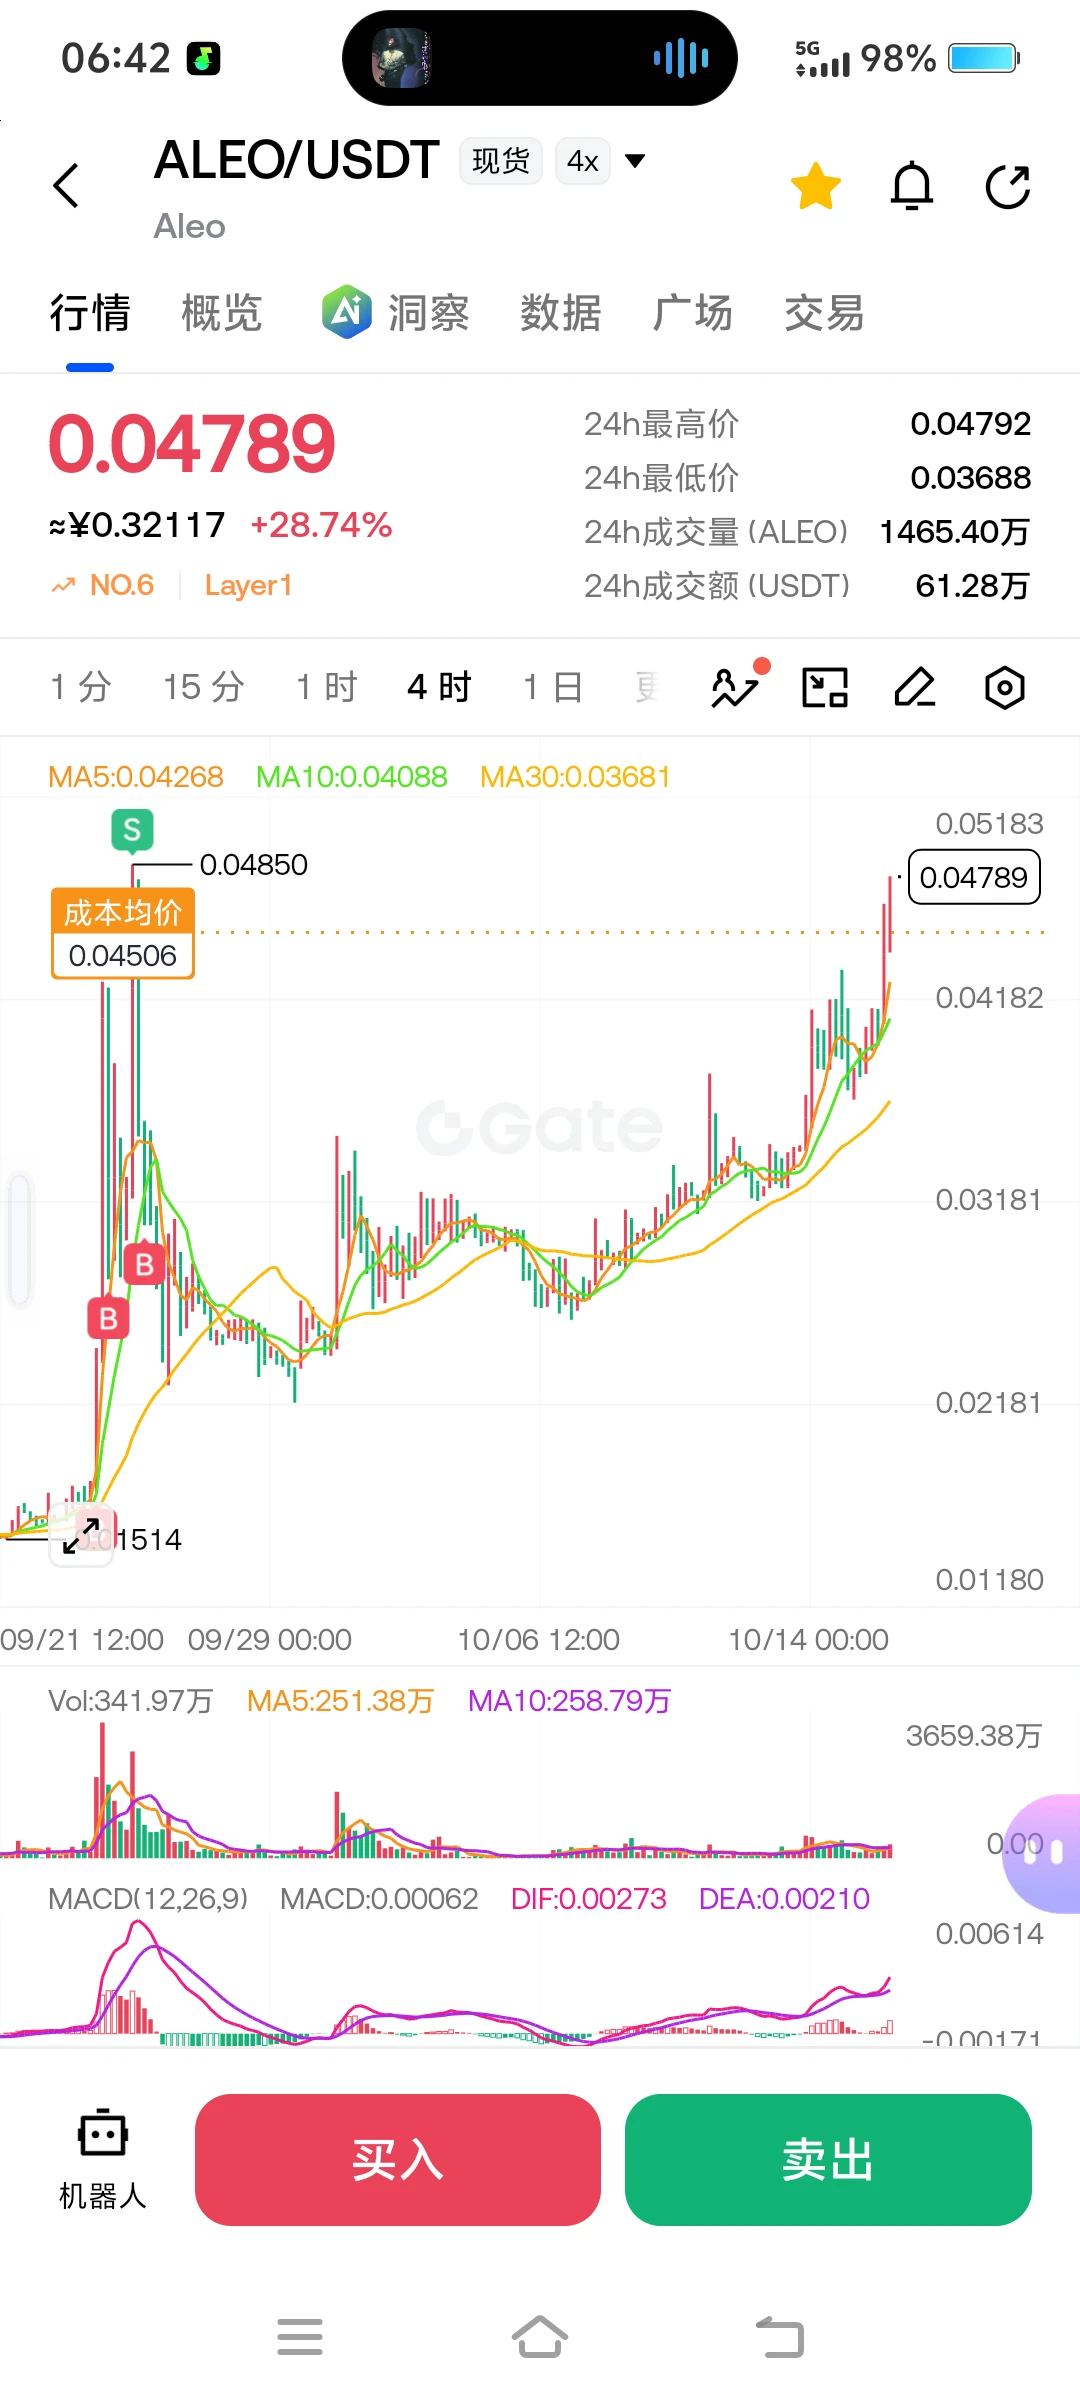
Is this even a rebound? It’s CPR for my account, isn’t it? $ZKC It just touched 0.0497, with +12.88% secured. I stared at the screen for several seconds to make sure I had the right account.

When I opened the charts this morning, buying pressure had clearly strengthened, and each pullback was getting smaller and smaller. This was obviously not an ordinary dead-cat bounce. Around 0.04953, I put it plainly: the risk-reward at this level was good enough; if wrong, take the loss, and if right, it’s a big payday.

Looking back now, the timing was spot-on. As for the position management: I took 7
post-image
ZKC+0.79%
XRP+1.50%
BTC+0.18%
Most traders will ignore this 95% confidence SHORT until it's too late.

$LAB /USDT - SHORT

Trade Plan:
Entry: 0.07452 – 0.07498
SL: 0.07695
TP1: 0.07310
TP2: 0.07200
TP3: 0.07036

Why this setup?
Why now? The 1D trend is bearish, and $LAB /USDT is stalling at 0.07475—just above the invalidation line at 0.07428. RSI on the 15m sits at 50.03, showing zero bullish momentum. The 4h setup targets 0.07310 first, then 0.07200. If we lose 0.07428, the thesis dies—but that's a 0.6% risk for a 3.7% move down to TP3.

Debate:
Is the dip to 0.07200 the real play, or do you think 0.07475 holds as fak
LAB+2.21%
$PI Pi doesn't have what it takes. TRB is the real deal.
post-image
PI+1.34%
  • 1
I originally planned to cut my losses as a sacrifice to the heavens, but the ritual never happened—the meat roasted itself.
With green filling the screen, $XAU kept oscillating around 4474.29, while the sell walls grew thinner each time. There was clearly no big money looking to take the other side. The rebound lacked volume and support, so I followed the trend and entered a short.
I switched over casually and saw it had already dropped to 4438.98, giving me a full +72.11% on paper. That was real meat on the table. It dragged its feet earlier, but the result tastes just as good.
Take profits
post-image
XAU+0.08%
XRP+1.50%
BNB+7.03%
BTC MARKET UPDATES
live-cover
LIVE74
U.S. August nonfarm payrolls “blockbuster”! Rate-cut expectations suddenly cooled?
The U.S. August nonfarm payrolls were indeed a bit “strong.” New jobs came in at 162k, directly blowing past market expectations of just over 50k, while the previous two months’ figures were revised up by a combined 55k. The unemployment rate held steady at 4.1%. On the headline figure alone, this is not a cooling labor market, but one that suddenly stepped on the gas.
The market’s most direct reaction was that the Federal Reserve’s rate-cut logic began conflicting again. Investors had previously bet on an econo
BTC+0.16%
NAS100+0.43%
  • 43
Seems like Christmas 🎁⛄🎄
$TROLL
post-image
TROLL-23.05%
These returns are making me nervous, as if I’m afraid the market will come to its senses tomorrow and blacklist me.
During the intraday bottoming phase, $UNI /UNI oscillated around 4.828, and many people couldn’t hold on and handed over their chips. I took another look at the order book: each pullback to a key level was higher than the last, and funds quietly entered every time it reached a key level. This didn’t look like a breakdown was coming, but more like the final shakeout before a move up. Once I had thought through the stop-loss level, all that remained was to leave it to time.
The pric
post-image
UNI+16.00%
LAB+2.21%
ZEC-0.32%
Everyone’s staring at the 1H pump, but the 4H clock just ticked against WLD.

$WLD /USDT - SHORT

Trade Plan:
Entry: 0.3959 – 0.3983
SL: 0.4084
TP1: 0.3886
TP2: 0.3830
TP3: 0.3745

Why this setup?
Why now?
- RSI on the 15m is 51.5—dead neutral, no momentum to break the range.
- ATR (1H) is razor-thin at 0.0047, meaning the next expansion hits fast.
- With 1D in “range” and bias SHORT at 55%, the path of least resistance is down to TP1 (0.3886).
- The current price (0.3971) sits right at the entry reference—this is the trigger zone, not a chase.

Debate:
If 0.3959 fails to hold, are
WLD+4.40%
I wasn’t even expecting to break even, but it took me straight into profit. This service really delivered. $TAO While everyone was still watching from the sidelines, I kept my eye on that range of repeated intraday fluctuations, and the more it consolidated, the more I felt something was brewing.
Buying pressure was quietly strengthening, with buyers stepping in every time it dipped. With this kind of bottom structure, I had to give it a shot. I opened a long at 225.0. The position wasn’t smooth sailing, but I held on as long as the trend remained intact.
Now 233.2 has been reached, and the +1
post-image
TAO+5.71%
ADA+4.43%
ETH+1.15%
Everyone’s staring at $LAB /USDT’s green candles—but the 4h tape just whispered something they’ll ignore until it’s too late.

$LAB /USDT - SHORT

Trade Plan:
Entry: 0.07433 – 0.07479
SL: 0.07676
TP1: 0.07291
TP2: 0.07182
TP3: 0.07017

Why this setup?
- 95% confidence SHORT while the crowd buys the bounce.
- 1D trend is bearish; this dip is a retest, not a reversal.
- RSI 15m at 43.66 = weak relief, no momentum shift.
- Entry 0.07456 with TP1 at 0.07291—that’s 2.2% before you blink.
- Why now? ATR (0.000915) says volatility is coiling; the next push down is the expansion leg.

Deba
LAB+2.21%
Crypto Signals and Trding Insights
live-cover
LIVE71
Everyone’s staring at the 4h bounce, but the daily tape just whispered a secret about $H /USDT.

$H /USDT - SHORT

Trade Plan:
Entry: 0.07609 – 0.07683
SL: 0.07998
TP1: 0.07382
TP2: 0.07206
TP3: 0.06942

Why this setup?
- RSI on the 15m is only 37.83—weak relief, not reversal.
- ATR (1h) at 0.001466 shows low volatility; the real move hasn’t started.
- Daily trend is bearish, and we’re armed at 0.07646 with a 95% confidence short.
- TP1 sits 3.4% below entry; TP3 is 9.2% down. The path of least resistance is lower.
Why now? The 4h structure is breaking, but the crowd is still buying
H-6.42%
Nobody is watching LINK while the 1D trend flips bullish at 95% confidence.

$LINK /USDT - LONG

Trade Plan:
Entry: 12.017 – 12.067
SL: 11.798
TP1: 12.225
TP2: 12.347
TP3: 12.529

Why this setup?
Why now? The 4h chart just armed a LONG entry at 12.042 with a tight stop at 11.798. RSI on the 15m sits at 54.77—not overbought, leaving room to run. ATR (1h) at 0.1015 means volatility is contracting, and breakouts from this squeeze often hit TP2 (12.347) fast. The 1D trend confirms, so this isn't a knife catch—it's a momentum ride. The invalidation at 11.388 is far enough to breathe, close enoug
LINK+3.25%
Gold’s 4h chart is screaming short at 4438—but the daily range says don’t trust it yet.

$XAU /USDT - SHORT

Trade Plan:
Entry: 4436.95 – 4439.87
SL: 4452.40
TP1: 4427.92
TP2: 4420.92
TP3: 4410.43

Why this setup?
- RSI 15m at 52.4 = no momentum fuel, just a lazy drift into resistance.
- ATR 1h at 5.83 means a 10 move is nothing—our TP1 at 4427 is a 0.24% scalp, not a trend.
- Daily range kills the conviction: 55% confidence is a coin flip, so we’re selling the 4h rejection, not the macro.
- Why now? Entry zone 4436.95–4439.87 is a tight 0.07% box—wait for a 15m close below 4438 to tr
XAU+0.08%
The opportunity is still there, be patient.

$ADA $SOL
post-image
ADA+4.43%
SOL+1.60%
This trend is so obvious I don’t even need to think—the account is dancing by itself 😂 I had just finished reading the bearish news, and the market slid another notch, with the short side starting to perform on its own.
Before the market had fully kicked off, I already felt that the rebound was off. Several consecutive rebound attempts were all pushed back down, with what felt like an iron plate covering the upside; price and volume completely failed to keep up. This kind of low-volume rebound is the easiest way to trick people into taking the other side. I went short directly around 0.00787,
post-image
BTC+0.18%
XRP+1.50%
What rebound? This is CPR for my account, isn’t it? When the screen was glowing green, I was wondering: Can this market still be traded? Then, right after I finished reading the bearish news, $BZ was forcibly pulled from 92.57 to 96.44, giving me a slap in the face and telling me: Stop being stubborn—the trend is king.
The entry logic was actually very simple: the pullback held, and buying pressure strengthened. When it stops falling, it stops falling; both volume and price were hinting that someone was buying the bottom. While everyone else was running, I chose to look at the weekly structur
post-image
BZ+1.04%
LAB+2.21%
ETH+1.15%
Load More

Join 40 M users in our growing community

⚡️ Join 40 M users in the crypto craze discussion

💬 Engage with your favorite top creators

👍 See what interests you

View More