Share your thoughts
placeholder
Article
#GateEventContractTradeSharingChallenge #BTC
Bitcoin is currently around $79,940, and in my view this is one of the most important decision zones of the entire recent move. BTC has already demonstrated that buyers are willing to defend the $77,000–$78,000 region, but the market is now facing a completely different challenge: can Bitcoin convert the $80,000 psychological level into genuine support while the U.S. macro environment is becoming more complicated? My view is cautiously bullish above the major support zones, but I would not call this a confirmed breakout yet. The market needs confir
  • 1
STONKFun’s STONK breaks $180M market cap high, up ~434% in 24h on strong volume. Caution warranted as related tokens remain highly volatile. $STONK
post-image
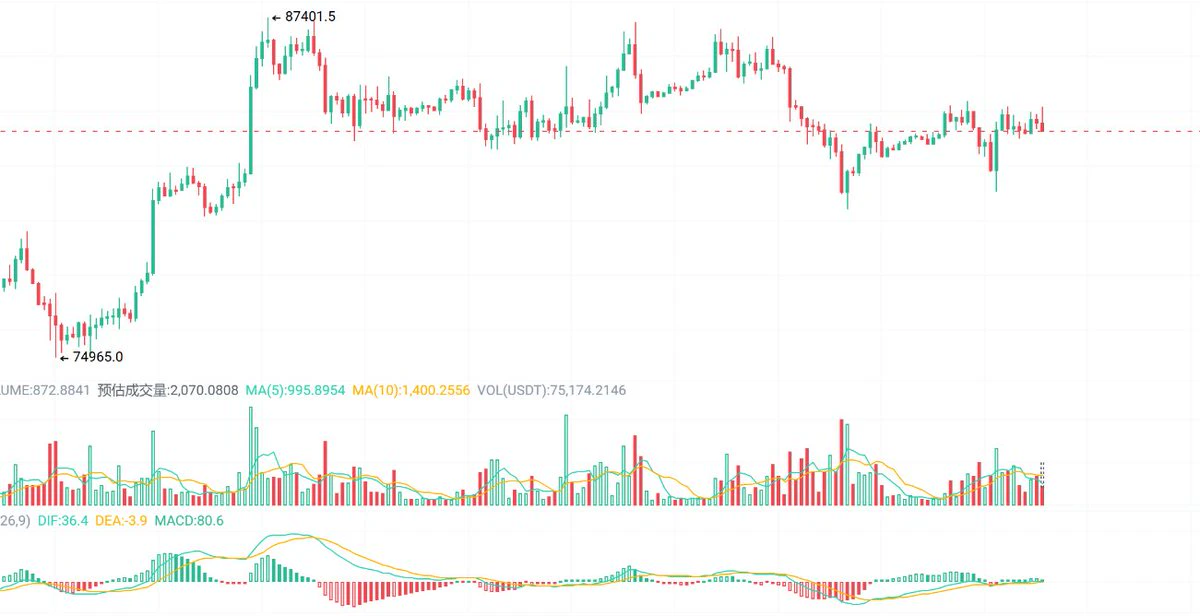
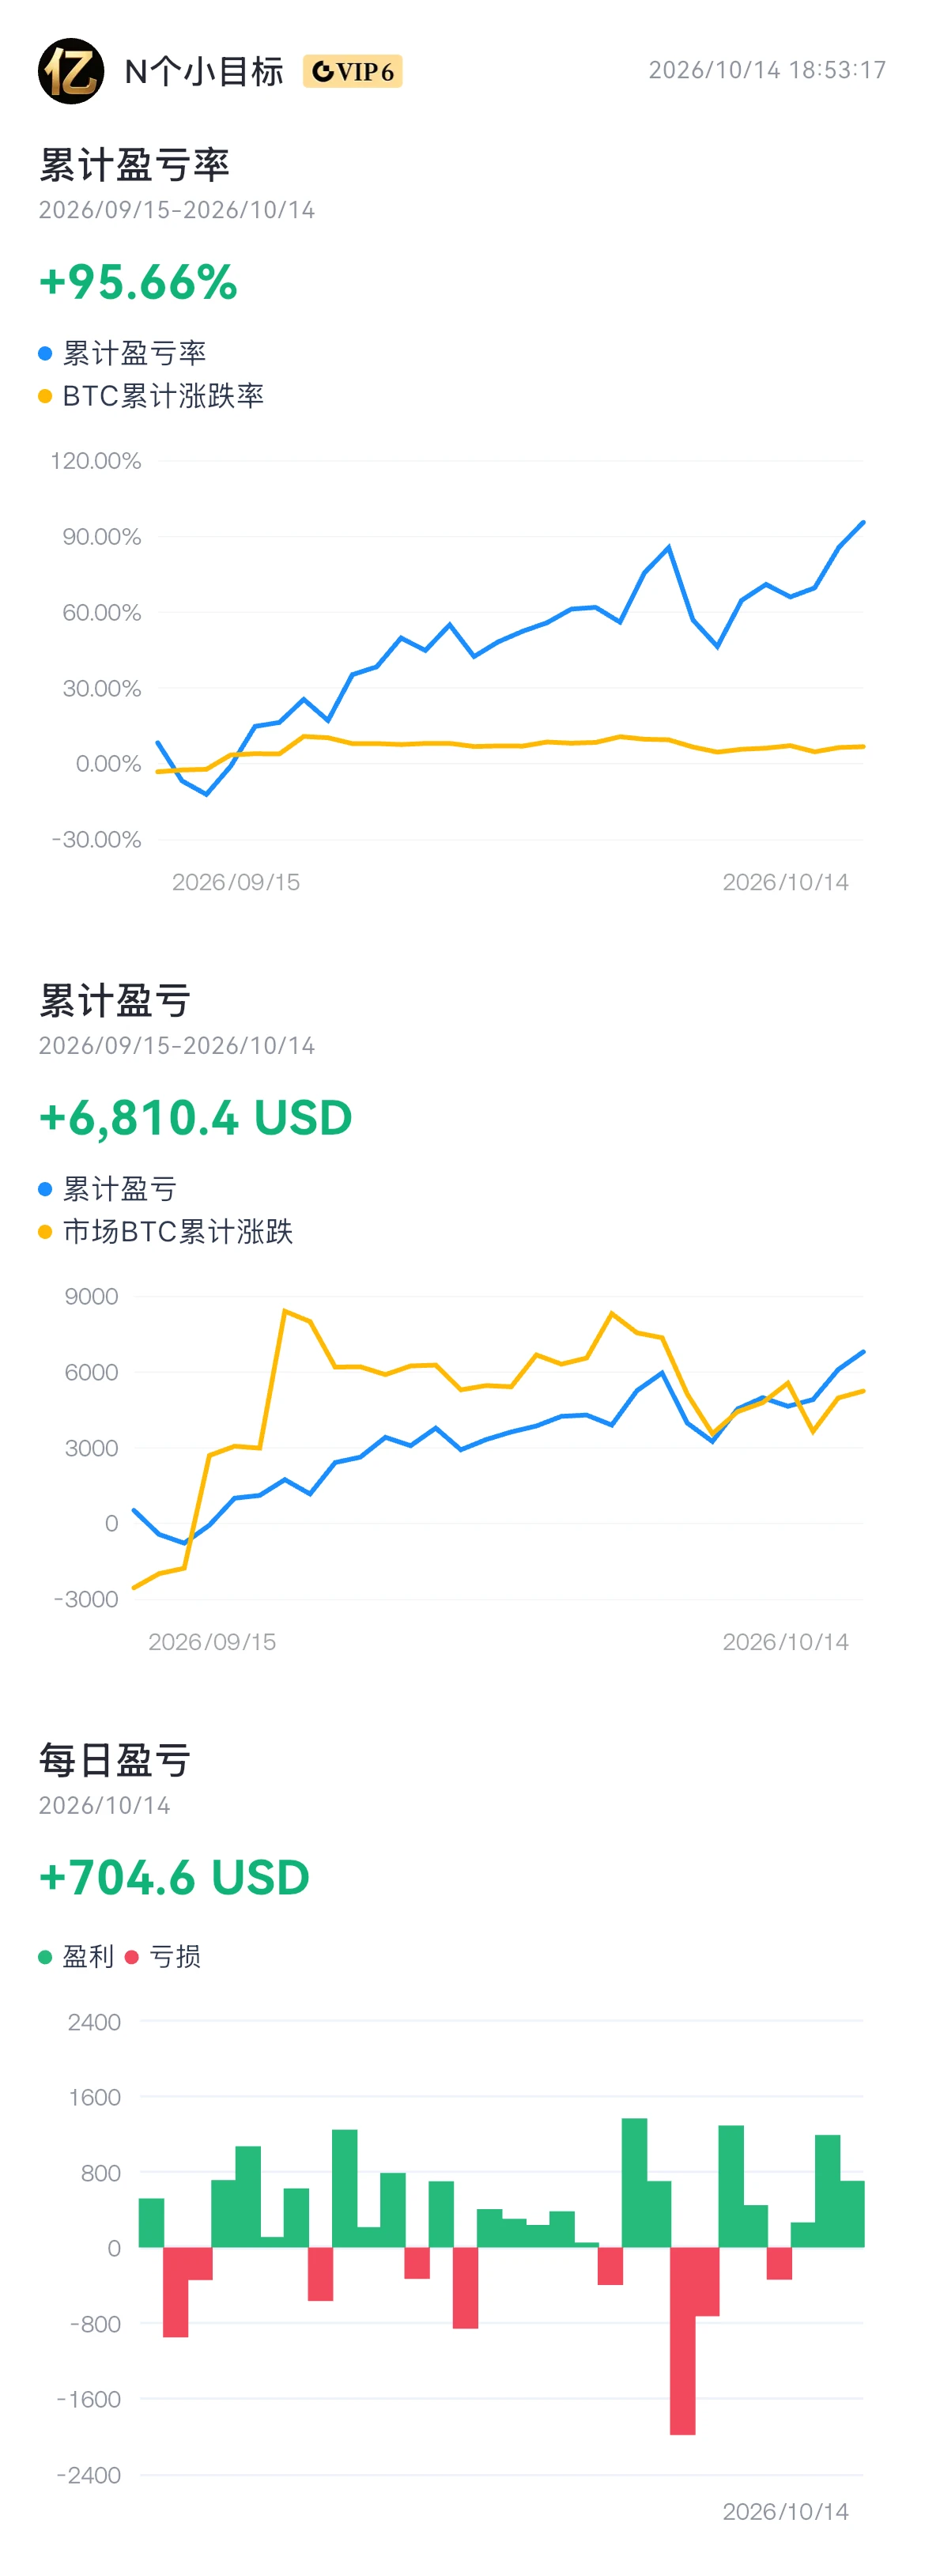
$BTC long position has been a bit of a grind to hold. There was one dip that swept out quite a few short chasers, coming just a few points away from my protection level. I didn’t manually cut the position at the time because the four-hour structure had not broken down yet.

I entered based on a double bottom on the hourly chart. After the right-side breakout, price pulled back to test the previous high neckline and stabilized. Once confirmed, I went long with the trend. The entry wasn’t particularly cheap, but the stop-loss was very close, making it a trade of limited risk for potential trend
post-image
BTC-0.22%
SNDK+0.47%
ZEC+14.75%
$HYPE
HYPE Prints a New High — Now the Market Faces Its Real Test
$HYPE has officially stepped into price-discovery territory.
Hyperliquid’s native token pushed toward a fresh all-time high near $88.90 on September 6, extending a powerful rally that has already taken the asset more than 50% higher over the past month and pushed its market capitalization toward the $20B+ area.
But the interesting part is not simply the new high.
The market is now trying to determine whether HYPE can turn this breakout into a sustained trend or whether the aggressive advance needs a deeper consolidation befor
HYPE+3.09%
  • 4
SUI’s 4h chart just whispered something most retail will ignore until it’s too late.

$SUI /USDT - SHORT

Trade Plan:
Entry: 0.7865 – 0.7911
SL: 0.8113
TP1: 0.7719
TP2: 0.7606
TP3: 0.7437

Why this setup?
- 1D trend is *range*, but the 4h MTF says SHORT with 55% conviction—that’s the edge.
- RSI 15m at 39.8 = momentum already rolling over, not yet oversold.
- Entry ref 0.7888; TP1 0.7719 is a 2.1% drop, TP2 0.7606 is 3.6%—tight, fast moves.
- ATR 1h (0.009389) confirms volatility is compressed—breakout fuel is loading.
- Why now? The invalid line at 0.7738 is the trapdoor; if price
post-image
SUI+0.24%
JUST IN: Harmony plans to shut down its mainnet, migrate ONE to Ethereum, and pivot to an AI video secondary creation economy, with a snapshot at the final block and airdrops to Ethereum wallets. $ONE
post-image
ETH+0.78%
Which coin will pump this new week?
post-image
tutorial:native can we see an upside from here after touching Midpoint gaussian channel... POTENTIALLY YES
TUT-6.31%
#ZEC How to View ZEC After Breaking Above $1,200

Let’s start with the most compelling point in the bullish narrative: ZEC’s all-time high was actually $5,941 in 2016—the current $1,193 is still about 80% below its ATH. Against the backdrop of continued ETF inflows, the market can fully tell the story that “a decade high is just the beginning, with a return to the ATH ahead.” ZEC’s ETF assets under management have surpassed $400 million, SMA-200 is providing strong trend support near $440, and the daily structure remains healthy.

But in terms of pace, the risk is accumulating rather than di
post-image
ThisIsTranslateContent:
#ZEC How should we view ZEC after it broke above $1,200?
First, the most compelling point in the bullish narrative: ZEC's all-time high was actually $5,941 in 2016—the current $1,193 is still about 80% below its ATH. Against the backdrop of continued ETF inflows, the market can fully tell the story that a ten-year high is only the beginning and that ZEC is returning to its ATH. ZEC's ETF assets under management have surpassed $400 million, while the SMA-200 near $440 provides strong trend support, and the daily structure remains healthy.
But in terms of momentum, the risk is accumulating rather than dissipating:
First, the squeeze fuel is nearing exhaustion. On top of OI tripling from $700M to $2B, shorts have been squeezed for two consecutive days. The remaining horsepower of this engine is rapidly declining—once the shorts are fully cleared out, a vacuum in buying pressure will emerge.
Second, the pace of the rise has shifted from "violent" to "out of control." ZEC broke above $1,000 on Thursday (+20%) and went straight to $1,200 today (+17.8%). A 40% two-day slope has historically almost never occurred without a sharp pullback. The price is tracking a parabola, and every parabola eventually breaks.
Third, sentiment has already overtaken demand. PANews' review of the previous ZEC surge concluded that it "began with demand and ended with sentiment"—the share of privacy transactions fell rather than rose after the surge, indicating that capital speculation, rather than real usage, was driving the price. This round has a stronger demand base thanks to the ETF, but the slope from $1,000 to $1,200 is clearly being driven by sentiment.
Key levels
Upside: $1,200 has just been breached. The next round-number level drawing market attention is $1,500, followed by the 2016 ATH of $5,941 as the "narrative level."
Downside: $1,000 is the lifeline of this rally; a break below it would mean the squeeze-driven move is over. $1,100 is the first short-term support.
Conclusion
The medium-term logic (ETF + privacy narrative + ten-year high) remains intact, and this rally has not been invalidated. But the 40% gain in two days has turned the question of "how much further it can go" into whether it will "pull back first and then continue" or "finish the move directly."
So: Above $1,200 is a high-volatility zone, where the probability of wide-range consolidation or a rapid wick is far greater than that of a continued one-way surge. $ZEC
repost-content-media
ZEC+14.92%
i loooooovvvveeee selling the pico bottom
many such cases
post-image
crypto market update
live-cover
LIVE367
Everyone’s long on FLOCK while the 4h chart quietly whispers a different secret.

$FLOCK /USDT - SHORT

Trade Plan:
Entry: 0.0709 – 0.0735
SL: 0.0846
TP1: 0.0629
TP2: 0.0567
TP3: 0.0474

Why this setup?
Why now? The 1D trend is *range*, but the 4h MTF is armed SHORT at 55% conviction. RSI 15m sits at 44.23—no oversold bounce fuel left. ATR 1h (0.005177) shows volatility is compressing, often a pre-breakout coil. Entry ref 0.0722 with a tight low of 0.0709; if we lose that, the slide to TP1 (0.0629) is a 13% drop with room to TP2 (0.0567). The alt scenario (long) needs a close above 0.0735 t
FLOCK+31.37%
🎉 Make a post for a chance to win 6,000 USDT!
Gate's global user base has officially surpassed 60 million!
This time, we're not just celebrating—we're giving away rewards directly 👇
🍀 1 person will exclusively win a 6,000 USDT futures position trial voucher
🎁 Plus, 60 more people will be drawn to receive a 60 USDT futures position trial voucher each
💙 More rewards for quality content: 1 $GT / Gate merchandise blind box
It's simple to participate:
Post on Gate Square with #Gate用户突破6000万 for a chance to become the 6,000U super lucky winner!
Don't know what to post? Just talk about your sto
GT-3.52%
  • 6
  • 1
These are the 10 best trades from the week in subscribers chat. (JOIN NOW FOR $14/MONTH ONLY)
🔥 For the week: 21/26 profitable trades
Watch results on the website:
81% target-hit rate based on the results you've provided.
Best trades
1st: $GPRO — 8.54%
2nd: $SOL — 6.70%
3rd: $MRVL — 6.15%
4th: #USOIL — 5.14%
5th: $NBIS — 4.33%
Average captured across all 21: ~3.33% 🔥
Join our free telegram:
post-image
GPRO+2.13%
SOL+2.79%
MRVL+7.00%
NBIS+7.51%
3 Targets done ✅
Set $XAN sl at entry 👍
post-image
Original content no longer visible
XAN+23.33%
Nvidia’s Latest AI Expansion Adds a New Growth Story for Semiconductor Markets
live-cover
LIVE370
#GateEventContractTradeSharingChallenge #ZEC
Zcash (ZEC) is showing exceptionally strong momentum. With your quoted current price around $1,189, the latest market data places ZEC around $1,184, with an intraday high near $1,204 and low around $1,005. That means the 24-hour move is roughly +16–19%, depending on the exchange and exact snapshot.
The most important development is that ZEC has successfully moved above the psychological $1,000 area after breaking through a major multi-year resistance zone. Recent reports attribute the acceleration partly to a short squeeze, with roughly $13M+ in Z
post-image
ZEC+14.92%
Why is everyone sleeping on UAI while its 4h chart screams 95% long conviction?

$UAI /USDT - LONG

Trade Plan:
Entry: 0.5477 – 0.5679
SL: 0.4605
TP1: 0.6307
TP2: 0.6794
TP3: 0.7523

Why this setup?
- Price sits at 0.5578, right on the entry ref, with a tight 1h ATR of 0.0405 – meaning volatility is compressed, and a breakout is imminent.
- RSI on 15m is 52.7 – neutral, not overbought, leaving room for a push toward TP1 at 0.6307 (+13%) before fatigue.
- The 1D trend is bullish, and this 4h setup is armed with a 95% confidence score – that’s not a coin flip, that’s a statistical edge.
UAI+19.95%
Rewards are being distributed! Open your mystery box now and win up to 100 USDT worth of tokens!
BOX+9.04%
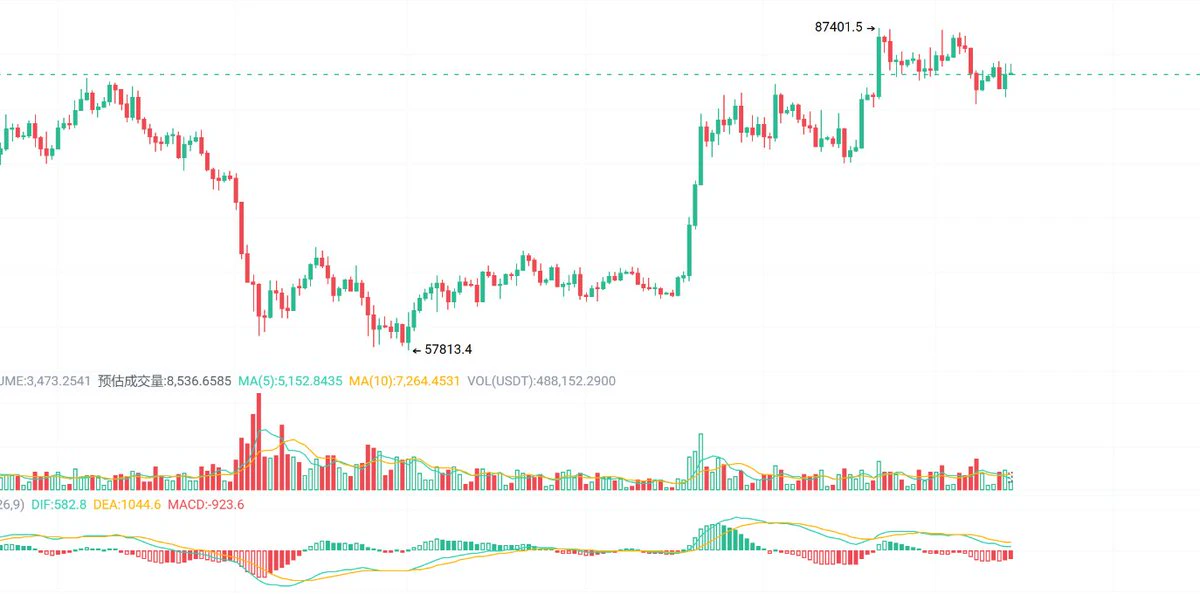
$BTC We have notable liquidation clusters both above the highs and below the lows.
The downside liquidity is theoretically closer, making it easier and more likely to get swept first.
However, in scenarios like this, a sweep of both clusters happens pretty often.
My thesis is that we sweep the upside liquidity today, followed by a sweep of the downside cluster on Monday.
post-image
BTC-0.22%
  • 5
Load More

Join 40 M users in our growing community

⚡️ Join 40 M users in the crypto craze discussion

💬 Engage with your favorite top creators

👍 See what interests you

View More