







Share your thoughts
placeholder
Article
Insiders are quietly loading $ETH /USDT while the crowd still doubts the breakout.

$ETH /USDT - LONG

Trade Plan:
Entry: 2480.01 – 2488.63
SL: 2442.94
TP1: 2515.35
TP2: 2536.04
TP3: 2567.08

Why this setup?
Why now? The daily trend is firmly bullish, the 1h ATR of 17.240717 shows the market is expanding enough to fuel a real move, and the 15m RSI at 46.76 signals room to run before overbought. The entry zone sits at 2484.32, with TP1 at 2515.35 and TP2 at 2536.04 offering stacked targets, while the invalidation level of 2451.09 acts as the hard line in the sand protecting the position.

D
ETH-0.46%
Everyone calling the bottom just missed the daily range trap.

$BTC /USDT - SHORT

Trade Plan:
Entry: 78373.5 – 78573.1
SL: 79431.1
TP1: 77755.0
TP2: 77276.1
TP3: 76557.8

Why this setup?
Why now? The 1h price is sitting at 78473.3, right inside the entry zone of 78373.5 to 78573.1, which aligns with a range-bound daily trend and a 15m RSI of 52.71, suggesting neither overbought nor oversold exhaustion. The 1h ATR of 399.066887 means a single hour of noise can easily cover the distance to TP1 at 77755.0, making a short entry statistically logical for capturing the move to TP2 at 77276.1. Th
BTC-0.96%
Nobody is talking about this SYMBOL setup yet

$SOL /USDT - SHORT

Trade Plan:
Entry: 103.05 – 103.49
SL: 105.34
TP1: 101.72
TP2: 100.68
TP3: 99.13

Why this setup?
Why now? The daily trend is range-bound and the 1h price sits at 103.27, which is the exact entry reference for this short. The 15m RSI at 43.02 shows bearish momentum without being overextended, while the 1h ATR of 0.862092 confirms the market is active enough for a meaningful move. The entry zone between 103.05 and 103.49 aligns with the reference, targeting TP1 at 101.72 and TP2 at 100.68. The invalidation level at 103.90 is
SOL-0.98%
ETH Major Market Forecast: Steady Profits
live-cover
LIVE27
Insiders are calling this the most overlooked long setup on the board right now.

$VVV /USDT - LONG

Trade Plan:
Entry: 24.016 – 24.596
SL: 21.525
TP1: 26.391
TP2: 27.782
TP3: 29.867

Why this setup?
Why now? The daily trend is firmly bullish, setting the stage for continuation. The 1h ATR of 1.158546 confirms strong momentum is present, which validates the move. The 15m RSI at 66.91 shows the market has room to run before hitting overbought territory. The entry zone between 24.016 and 24.596 aligns perfectly with the 1h price of 24.306, offering a precise risk-managed opportunity. The targ
VVV+29.81%
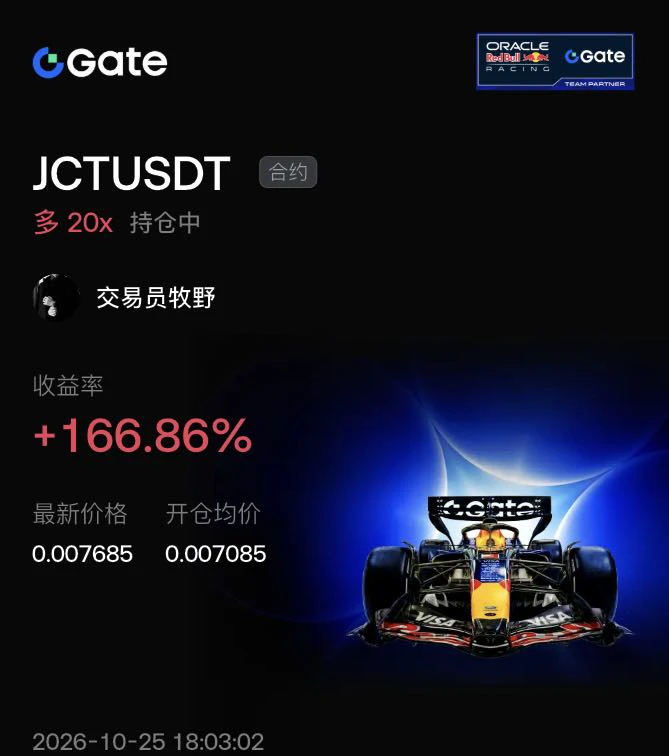
I switched to the background to reply to a message, and when I came back, it had already done the job. During the repeated intraday volatility, I watched for a long time and found that nobody was buying each rebound—the selling pressure was overwhelming, and the capital had no intention of pushing it higher. Right after lunch, while checking the chart, I gave a short-trade idea: entered at 1.3889, and it has now moved down to 0.1768, delivering +1718.34%. Feels good, brothers—this is how you hold a short. For the trade, take 70% off first and set a protective level for the remaining 20%. Don’t
post-image
XRP+1.41%
LAB-1.72%
A four-hour double top has formed, with the key level on the right noticeably lower than on the left. This pattern itself signals that the bulls are losing strength. After the neckline broke, I first entered $ROBO to validate the breakout. The position was very light, so even if I was wrong, it would not cause significant damage.

When the price retested the neckline, I first took profit on 80% of the validation position. Only after the price weakened again below the neckline did I add back 80% of the core position. The average price of the added position was actually more favorable than the
post-image
ROBO-7.82%
ADA-0.82%
ZEC+1.17%
This trend doesn’t even require me to think—the account is dancing on its own.

I just took a quick look, and $BMT has already reached 0.01757, with an unrealized profit of +207.95%. This short position was opened during the intraday plunge. At the time, each rebound was weaker than the last, and volume failed to follow through—a typical lack of support. I shorted around 0.01906 without much hesitation, because the chart had already told you it would fall; I simply followed it.

The money you make is the realization of your understanding; the money you lose is the flaw in your understanding
post-image
BMT+1.19%
XRP+1.41%
SOL-0.98%
today live markets updates
live-cover
LIVE1,409
They said crypto would change my life.
They weren't lying 🤣
post-image
NVIDIA is down -2% today because all you fucking lots keep pairing every single shitcoin to it and now liquidity is going.
I urge NVIDIA ceo to sue everyone dropping thread on how to create token on Robinhood and pair it with their 5.5 trillion dollar company stock.
Evil lots.
post-image
NVDA-2.00%
HOOD-3.89%
I did nothing—just went to the restroom, and when I came back, the candlestick chart had already done the work for me. While it was grinding out a bottom intraday, $SNDK kept sweeping back and forth. I watched for a while: it pulled back but held firm, buying pressure was quietly strengthening, and the longer it consolidated here, the better the prospects later. I decisively opened a long position. 😏
Once I saw the structure clearly, I got in around 1586.74. When I came back just now, the current price had already reached 1744.09, with 80% secured in profit. The wait was worth it—this bite o
post-image
SNDK-2.34%
ADA-0.82%
BNB+1.66%
I didn’t chase the short when the large bearish candle broke below the previous low, as this area is most likely to see a rebound that sweeps traders out. I waited for a rebound toward the key moving-average level before shorting $CHIP . Entering below the key level kept the stop-loss small if wrong, making the risk-reward favorable.

The first test of resistance was followed by a rapid pullback, so I used 20% of my position to test a short. The market then surged again, and the false breakout stopped out the initial position. I didn’t reverse into a long after being stopped out, as the moving
post-image
CHIP-1.89%
BNB+1.66%
ETH-0.46%
XRP is range-bound daily but the 1h setup hints at a hidden move.

$XRP /USDT - SHORT

Trade Plan:
Entry: 1.4140 – 1.4212
SL: 1.4520
TP1: 1.3918
TP2: 1.3746
TP3: 1.3487

Why this setup?
Why now? The daily trend is a range, so the real edge comes from the 1h window where the 15m RSI sits at 48.1, showing neither overbought nor oversold exhaustion. The 1h ATR of 0.014347 quantifies the current volatility, defining the risk per unit as the price rotates. The entry zone between 1.4140 and 1.4212 aligns with the 1h price at 1.4176, offering a precise trigger for a short bias. Targets sit at 1.39
XRP+1.41%
#GateTrenchesGasFree
🔥 The meme I’m watching today is $ LAPTOP.
$ LAPTOP is just entering the market but is already attracting a lot of attention. For a memecoin at launch, this is exactly what is needed for a strong move: a recognizable narrative, a fresh story, and active interest from speculative capital.
My main focus right now is volume and price behavior after launch. If buyers can sustain the volume and local pullbacks are quickly bought up, this could signal a continuation of the momentum.
But $ LAPTOP is a high-risk meme: it is important not to chase the green candle, but to watch l
LAPTOP
LAPTOPLAPTOP
Pump.Fun
MC:$1.95Holders:8
27.89%
MEME+0.08%
  • 2
I'm literally shaking...
bitcoin:native golden cross
post-image
BTC-0.94%
ETH Strategy

Current price: 2485. The price has pulled back slightly over the past 24 hours, with bears dominating the short-term market.

After surging on the four-hour chart, the price came under pressure and moved downward, falling below the moving averages. After narrowing, the Bollinger Bands turned downward; the MACD red bars continued to contract, bearish momentum gradually strengthened, and the RSI turned downward. The broader uptrend structure has not yet been completely broken, but short-term pressure is evident, so blindly chasing highs is not advisable.

Wait for a rebound into
post-image
ETH-0.46%
$USELESS (per request)
Already updated once this morning but zoomed out we see price is right at weekly resistance.
Still showing good strength and if it breaks that level then new ATH comes quick and it's off into price discovery.
post-image
USELESS+23.31%
Insiders are watching SYMBOL closely while the 1h price sits at 84.305.

$HYPE /USDT - LONG

Trade Plan:
Entry: 84.097 – 84.513
SL: 82.305
TP1: 85.805
TP2: 86.805
TP3: 88.306

Why this setup?
Why now? The daily trend is bullish and the 1h ATR of 0.83344 shows expansion, meaning volatility is increasing just as the 15m RSI sits at 54.97, a neutral zone that precedes a directional move. The entry zone between 84.097 and 84.513 aligns with the 1h price of 84.305, offering a precise long trigger with the target at TP1 of 85.805 and a further extension toward TP2 of 86.805. This setup only works
HYPE-1.10%
I was just about to head to the forum and rage-post, but then I looked at my position and thought, forget it—the market is always right.
The intraday plunge was indeed pretty scary, but watching the volume on $SNDK , I noticed that the further it fell, the more volume contracted, while the bids below kept getting thicker. It was clearly someone accumulating amid the panic. Once I had a read on it, I went straight in and entered a one-lot long position at 1503.37.
The market didn’t disappoint. The current price climbed all the way to 1748.15, taking the position’s profit directly to +1158.48%. T
post-image
SNDK-2.34%
ZEC+1.17%
SOL-0.98%
Load More

Join 40 M users in our growing community

⚡️ Join 40 M users in the crypto craze discussion

💬 Engage with your favorite top creators

👍 See what interests you