













#每周来晒 #Gate广场万圣节
Halloween Fright Night: From Hell to Heaven, All in One Night! My Wild Night with IRYS
The 10U warrior is heading out again. This time, I picked IRYS as my target. Last night, Bitcoin and Ether were moving sideways near their lows. I figured most of the short-term risk in crypto had been flushed out, and a rebound might be next. With risk cleared, funds could become active again, and we might see an altcoin season over the weekend. So I started looking for a target. IRYS has been strong lately, and its holders seemed firmly committed. I thought, this is the one. Little did I know this decision would give me an early taste of Halloween.
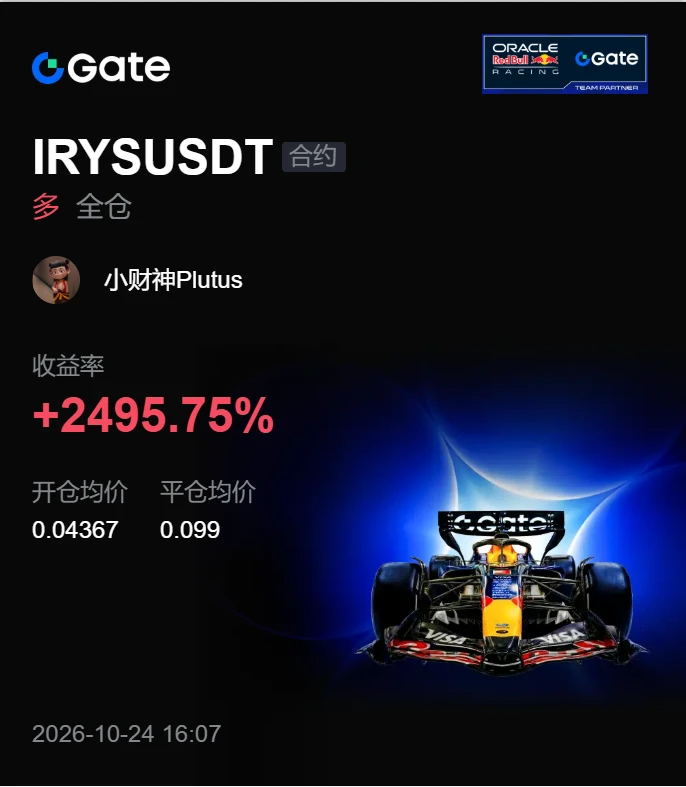
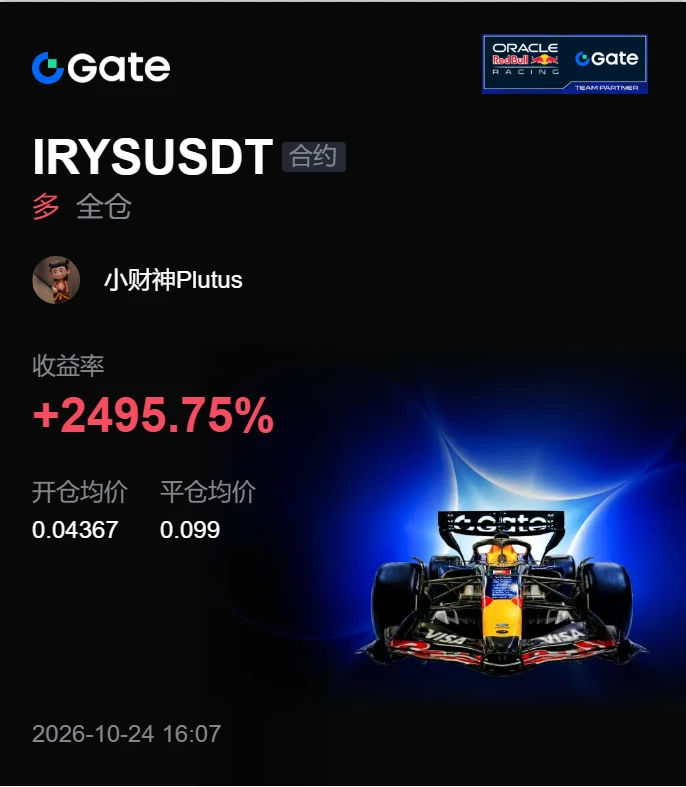
Everything went smoothly at first. I opened a long position around 0.036, using the same approach I mentioned before: going all in with 10U as if buying a lottery ticket, with isolated margin and max leverage. To my surprise, less than 5 seconds after I opened the position, the price started pumping and shot up to around 0.04. I couldn't help thinking, "I'm really lucky tonight!"
But my lucky streak went to my head. I was already in profit right after opening the position, and greed got the better of me. For some reason, I decided to try compounding my position, so I switched to cross margin and moved all my extra funds into my stock account. Then I added another 50% to my position around 0.043, bringing my liquidation price to 0.0405. But as soon as I added to the position, the market turned down, falling from 0.043 to 0.0417. My profit turned into a loss. At the time, I thought there was a 50% chance this was 🐶 shaking out the market. Whether I could hold on was up to luck, so I set a stop-loss at 0.0407 and a take-profit at 0.099, then went to bed. I still remember the last time I checked the market before falling asleep: it had dropped to 0.0414.
When I woke up this morning, the first thing I did was open the app. My position was gone. My first reaction was disappointment, thinking I'd handed another 10U to 🐶. But then I checked my futures account balance and saw there was still over 200U. Had my take-profit hit? I quickly checked IRYS's candlestick chart. It had actually surged to 0.42 overnight. Not only had I hit my take-profit, I'd also sold too early. In an instant, I felt like I'd gone from hell to heaven! I checked the chart and saw that last night's shakeout had taken it as low as 0.041, just a hair above my stop-loss!
Although I made a lot of money this time, it was purely a gift from the heavens. I had actually violated the trading rules I'd set for myself in advance, so afterward I reflected and reviewed what happened. A few things are worth noting:
1. Don't compound positions in altcoins! Trading altcoins is basically about following the whales and taking whatever crumbs you can get. Price swings are huge, and compounding your position means a single pullback can easily trigger your stop-loss or cause you to get liquidated—or even lose more than your margin.
2. When trading popular altcoins, stick to the principles I've shared before: use isolated margin, trade as if you're buying a lottery ticket, set your stop-loss just above the liquidation price, and give the trade more room.
3. Always use a small amount of capital, and trade only with money you can afford to lose without worrying. Being a 10U warrior is nothing to be ashamed of. If I'd invested more than 10U, I wouldn't have been able to sleep easy. I probably would have stayed up all night glued to my computer, then sold as soon as I saw a pump.
Finally, as for selling too early, I actually take it pretty well. From LSK last month to AGT this month, I was in on the main rallies, and making more than 10x was nothing unusual. But in the end, I gave those profits back during sideways and downtrending markets. So this time, my first reaction wasn't to regret selling too early. I chose to shut down my computer and give myself some peace and quiet. The real skill is holding on to your profits. $IRYS
Halloween Fright Night: From Hell to Heaven, All in One Night! My Wild Night with IRYS
The 10U warrior is heading out again. This time, I picked IRYS as my target. Last night, Bitcoin and Ether were moving sideways near their lows. I figured most of the short-term risk in crypto had been flushed out, and a rebound might be next. With risk cleared, funds could become active again, and we might see an altcoin season over the weekend. So I started looking for a target. IRYS has been strong lately, and its holders seemed firmly committed. I thought, this is the one. Little did I know this decision would give me an early taste of Halloween.
Everything went smoothly at first. I opened a long position around 0.036, using the same approach I mentioned before: going all in with 10U as if buying a lottery ticket, with isolated margin and max leverage. To my surprise, less than 5 seconds after I opened the position, the price started pumping and shot up to around 0.04. I couldn't help thinking, "I'm really lucky tonight!"
But my lucky streak went to my head. I was already in profit right after opening the position, and greed got the better of me. For some reason, I decided to try compounding my position, so I switched to cross margin and moved all my extra funds into my stock account. Then I added another 50% to my position around 0.043, bringing my liquidation price to 0.0405. But as soon as I added to the position, the market turned down, falling from 0.043 to 0.0417. My profit turned into a loss. At the time, I thought there was a 50% chance this was 🐶 shaking out the market. Whether I could hold on was up to luck, so I set a stop-loss at 0.0407 and a take-profit at 0.099, then went to bed. I still remember the last time I checked the market before falling asleep: it had dropped to 0.0414.
When I woke up this morning, the first thing I did was open the app. My position was gone. My first reaction was disappointment, thinking I'd handed another 10U to 🐶. But then I checked my futures account balance and saw there was still over 200U. Had my take-profit hit? I quickly checked IRYS's candlestick chart. It had actually surged to 0.42 overnight. Not only had I hit my take-profit, I'd also sold too early. In an instant, I felt like I'd gone from hell to heaven! I checked the chart and saw that last night's shakeout had taken it as low as 0.041, just a hair above my stop-loss!
Although I made a lot of money this time, it was purely a gift from the heavens. I had actually violated the trading rules I'd set for myself in advance, so afterward I reflected and reviewed what happened. A few things are worth noting:
1. Don't compound positions in altcoins! Trading altcoins is basically about following the whales and taking whatever crumbs you can get. Price swings are huge, and compounding your position means a single pullback can easily trigger your stop-loss or cause you to get liquidated—or even lose more than your margin.
2. When trading popular altcoins, stick to the principles I've shared before: use isolated margin, trade as if you're buying a lottery ticket, set your stop-loss just above the liquidation price, and give the trade more room.
3. Always use a small amount of capital, and trade only with money you can afford to lose without worrying. Being a 10U warrior is nothing to be ashamed of. If I'd invested more than 10U, I wouldn't have been able to sleep easy. I probably would have stayed up all night glued to my computer, then sold as soon as I saw a pump.
Finally, as for selling too early, I actually take it pretty well. From LSK last month to AGT this month, I was in on the main rallies, and making more than 10x was nothing unusual. But in the end, I gave those profits back during sideways and downtrending markets. So this time, my first reaction wasn't to regret selling too early. I chose to shut down my computer and give myself some peace and quiet. The real skill is holding on to your profits. $IRYS