Square
Following
Hot
News
Profile
Share your thoughts
placeholder
Article
Micron's earnings report dazzled, yet the stock still plunged—why are its results and share price “fighting” each other?

This is the most puzzling part of this storage-stock pullback—Micron just delivered the best earnings report in its history, yet its stock fell the hardest.

First, the results. Micron's fourth-quarter fiscal 2026 revenue was $54.23 billion, up 379% year over year and 31% quarter over quarter, setting a record for the sixth consecutive quarter. GAAP net income was $37.7 billion, up more than 10x year over year. Adjusted EPS was $33.42, with both revenue and adjusted EPS e
MU+1.93%
The returns are absolutely real. No one is currently copying the trades. You can give it a try—it will absolutely exceed your expectations.
  • 1
All steady spot profits in crypto have never come from betting on market moves or relying on luck! True professional traders only trade high-confidence moves at key support and resistance levels! All price rises and falls, shakeouts, and breakouts revolve around key levels of market consensus! No empty talk today—we’re directly revealing precise BTC/ETH/SOL/BNB resistance and support levels, and teaching you step by step how to draw lines, identify trends and signals, and determine entries and exits. Put it straight into practice after reading!
📍 Spot Strategy · Practical Identification and L
BTC+1.76%
ETH+3.88%
SOL+3.92%
BNB+1.71%
Yesterday I suggested buying XPL, and looking at today, it was almost exactly the bottom. After the PPI data came out and the bearish news was priced in, it immediately V-reversed. Still, pay attention to coins with discernible patterns. Keep following #美国9月PPI大超预期
XPL+12.18%
#KOSPIJumps3.3% Asian Markets in Freefall: SK Hynix and SanDisk Face a Critical Test as AI Memory Stocks Slide
The latest sell-off across Asian equity markets has put semiconductor and memory stocks directly under the spotlight. Japan’s Nikkei 225 fell 4.90%, while South Korea’s KOSPI plunged 7.56%, according to the market figures provided. The sharp decline has renewed concerns about valuations, investor positioning, and whether the powerful AI-related rally in memory stocks has become vulnerable to a deeper correction.
But beneath the red numbers, another development deserves attention: trad
  • 3
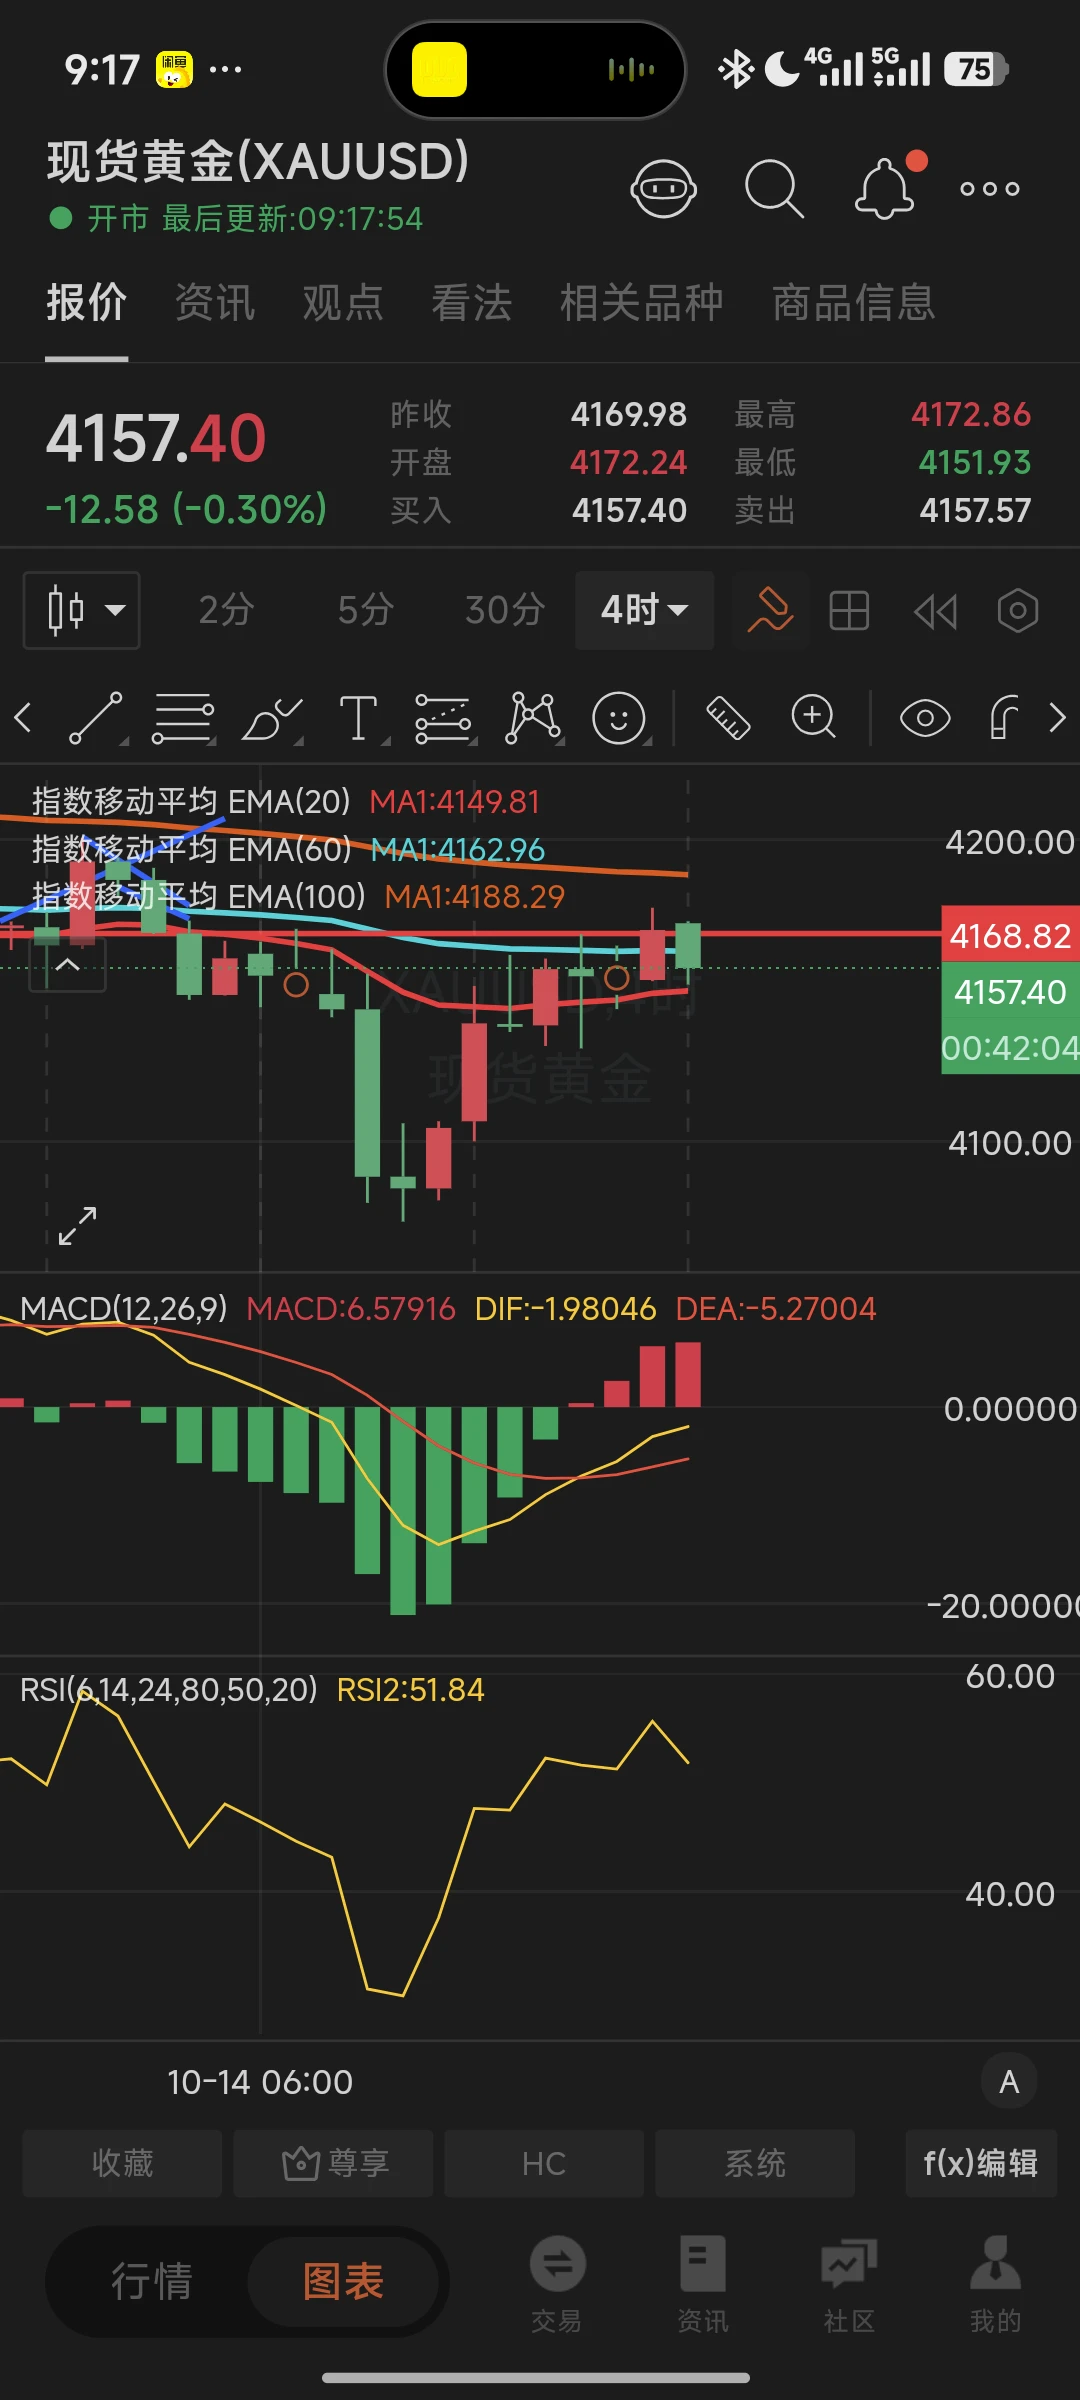
XAUUSD Oct 16 Asia-European Session Outlook$XAUUSD
It has not yet firmly held above 4170, so be especially cautious of a false breakout! If 4170 is truly broken to the upside, pay attention to the 4192–4198 resistance zone with multiple mid-level confluences. Do not take the wrong direction; going short currently offers a significantly better risk-reward ratio!
Intraday resistance
1. 4190–4198, 4h timeframe
2. 4220–4226, daily timeframe
3. 4315, daily timeframe
Support
1. 4104–4113
2. 4066–4070; watch for additional wick-spike action here
3. Around 4024
post-image
XAUUSD-0.21%
📉 ALTCOINS UNDER PRESSURE! IS BITCOIN DOMINANCE SET TO RISE?
The altcoin market is facing pressure, raising an important question: will Bitcoin strengthen its dominance, or could altcoins stage a recovery?
🔥 Today's Livestream Discussion:
🔹 Why are altcoins struggling?
🔹 What does rising Bitcoin dominance mean for the crypto market?
🔹 Could capital be shifting from altcoins toward BTC?
🔹 How are ETH, SOL, XRP, and other major altcoins performing?
🔹 What signals could indicate a potential altcoin recovery?
📊 Bitcoin Dominance vs. Altcoin Strength
We'll explore market sentiment, Bitcoin
post-image
BTC+1.76%
ETH+3.88%
SOL+3.92%
XRP+2.62%
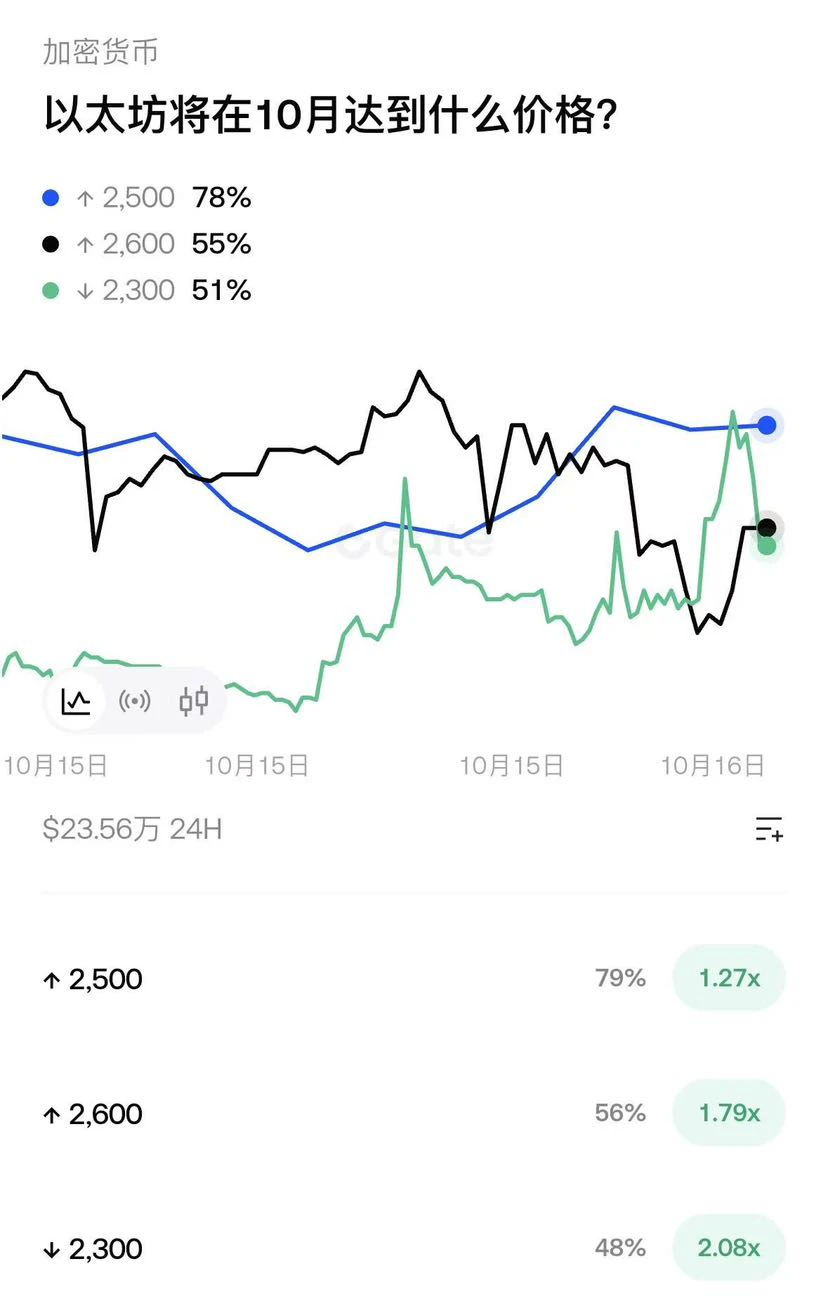
The overall market is tilted bullish, with most capital betting that ETH will hold above 2500.
However, there is insufficient certainty of a break above 2600, while the probability of a pullback to 2300 is close to 50%, indicating significant disagreement between bulls and bears over Ethereum, unlike the one-sided optimism seen in BTC.
The upside offers limited potential returns, while lower pullback levels offer better risk-reward; beware of the risk of a failed rally followed by a retracement to the 2300 range.
post-image
ETH+3.88%
BTC+1.76%
“The last straw” is no longer just an idiom.
It is now a warning post, dozens of bandwagon negative reviews, and the night when a 33-year-old mother could no longer hold on.
For ordinary people, living really is too hard.
post-image
#USSeptemberPPIBeatsExpectations
PPI 6.3%. Hotter Than Expected. Rate Cuts Just Got Harder. 📈
US September PPI came in at 6.3% YoY, well above the 5.3% forecast. Monthly rose 1.3%, the biggest jump since March 2022. Energy did most of the work. Weekly jobless claims were 199K, right on the number.
What it means
Producer prices are the front end of inflation. A print this hot, after yesterday’s CPI miss, gives the Fed less room to cut and more reason to stay higher for longer. Hike odds for late October are already elevated.
Asset reaction
• $BTC briefly lost $80K, then bounced back toward $8
BTC+1.76%
🌈 Gate Live Streaming Inspiration - October 16
Trending Topic Recommendations:
🔹Rate hike expectations heat up, but U.S. stocks and Crypto rebound against the trend! Huang Renxun steps in to save the day—is the seven-day losing streak for chip stocks about to end?
🔹BTC rebounds from the bottom, with NEAR surging nearly 10%! Altcoins recover across the board—is it time to buy the dip?
🔹KOL take: Ansem remains firmly bullish on BTC! Crypto market confidence has fallen to a ten-year low—is it time to be greedy when others are fearful?
🔹Mysterious whale makes a $187 million bet! Going fully l
post-image
BTC+1.74%
ANSEM+8.39%
ETH+3.94%
SK Hynix+2.06%
SKHY-0.94%
  • 5
  • 4
US Initial Jobless Claims
live-cover
LIVE1,629
U Jie 10.16 Friday $SOL Strategy
Entry condition: 104‑104.8 range, long.
Stop-loss: 103.6
First take-profit target: 106.5
Second take-profit target: 108.2
Market logic: SOL previously dipped to a low of 100.51. After the concentrated release of selling pressure, funds entered and drove a corrective rebound. It is currently in a consolidation phase following the sharp decline. 103.8-104.5 is the key support range for this rebound. As long as support holds, the rebound structure will not be broken. Wait for a sign that the decline has stopped after a pullback to support before entering a long p
SOL+3.60%
#DrLinHanSpeaksAtOxfordUnion
I'll be honest, when I first saw this headline, I read it twice. A crypto exchange founder walking into one of the oldest debating halls in the world? That's not something you'd have imagined a decade ago. So I dug into the details, and here is what's actually confirmed so far.
Gate's founder and CEO, Dr. Han, has been invited to speak at The Oxford Union on November 12, between 15:30 and 16:30 UTC. The venue is on St Michael's Street in Oxford, UK. Worth remembering: the announcement came out in mid-October, so the talk hasn't happened yet. Right now, this is an
post-image
10.16 Market Analysis
Bitcoin Strategy Reference
Entry zone: Long around 81800
Stop loss: 81200
First target: 82500, second target: 83500
Don't let repeated volatility wear down your bullish outlook! Bitcoin is currently at a key breakout juncture, and the opportunity is still there.
The market bottomed out and rebounded last night, rising to around 82500. After midnight, it repeatedly pushed higher to test this resistance level, with volume continuously building and momentum nearing an explosion. Continue holding the long positions entered earlier, and patiently hold swing positions while wai
BTC+1.74%
ETH+3.94%
Preparing to add the link
What slogan would work better?
live market update
live-cover
LIVE2,006
$NEAR This pump was set up as a meat grinder for shorts, and the 11.8% bullish candle is a cure for all kinds of disbelief.
When the order I placed at 4.65 last week filled, my hand was shaking. Not because the position was large, but because the daily chart had already posted seven consecutive bearish candles, and the community was full of horror stories about “NEAR going to zero.” But I stared at the 4.52 24h low for a long time—that level was the neckline where last December’s rally began. A break below it would mean a trend reversal on the weekly timeframe, and the damn market makers would
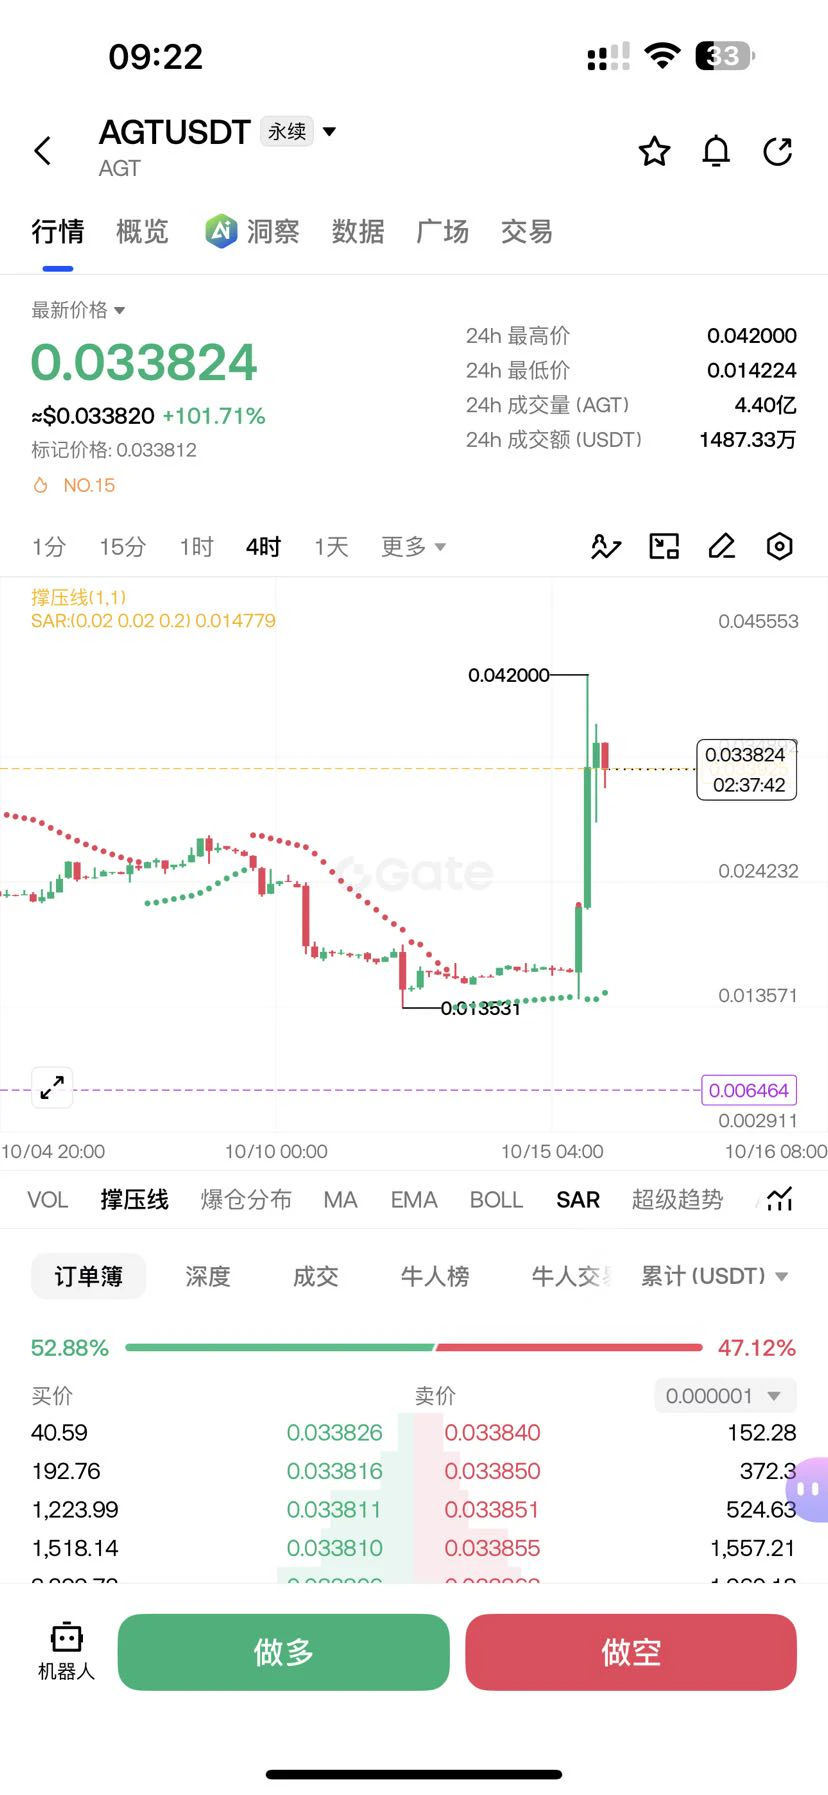
AGT 4-Hour Chart Analysis: Doubling Rally from a Deep Bottom, Short-Term Long
AGT previously dipped to 0.013531 to complete bottom confirmation, with a 24-hour gain of over 101%, representing a typical aggressive rally driven by bottom-fishing capital. A huge bullish candle broke through the long-term downtrend, while the SAR indicator simultaneously turned bullish, signaling a concentrated release of bullish momentum. After the current surge, it has pulled back slightly for consolidation, which is a retracement during the uptrend.
Support: 0.013531
Take-profit target: 0.042000
Stop-loss: 0.01
post-image
AGT+109.95%
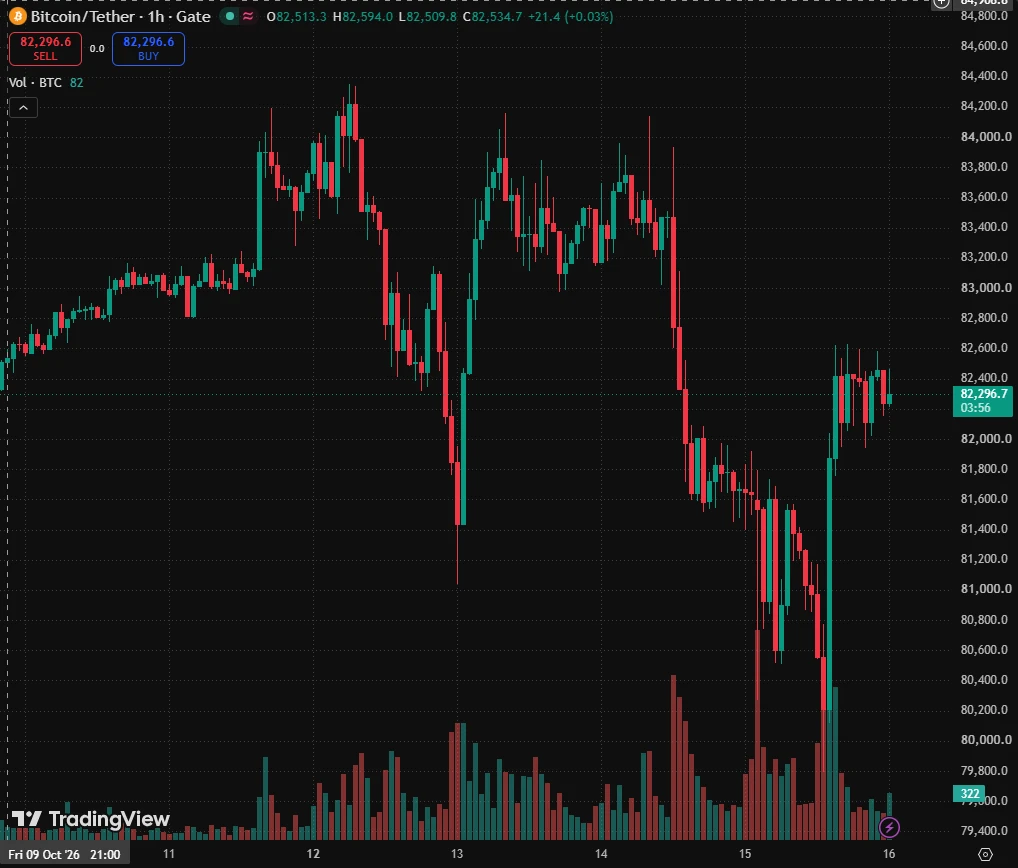
$BTC Bitcoin At $82,400: Breakout Loading Or A Bear Trap
BTCUSD Perpetual Futures | 1-Hour Chart | October 16, 2026
Bitcoin has staged a sharp recovery from the $79,800 region, but the price is now consolidating around a critical decision zone near $82,400–$82,420. The next move may depend on whether buyers can defend this level and push toward overhead resistance—or sellers regain control.
Bullish Setup — Buy on Confirmation
Trigger: sustained move above $82,420–$82,500, followed by a successful retest.
- Target 1: $83,025
- Target 2: $83,825
- Target 3: $84,687
Bearish Setup — Sell on Brea
post-image
BTC+1.74%
Load More

Join 40 M users in our growing community

⚡️ Join 40 M users in the crypto craze discussion

💬 Engage with your favorite top creators

👍 See what interests you

Trending Topics

USSeptemberPPIBeatsExpectations

91.35k Views1.9k Discussing

US September PPI came in at 6.3% YoY, well above the 5.3% market expectation, pointing to renewed producer-side inflation pressure. Weekly jobless claims were 199K, broadly in line with forecasts. Could hotter inflation further reduce room for rate cuts, and what does it mean for $BTC, US stocks, and gold?

DrLinHanSpeaksAtOxfordUnion

135.63k Views1.86k Discussing

KOSPIJumps3.3%

47.29k Views1.88k Discussing

View More