Share your thoughts
placeholder
Article
Spending 6 USDT just to roast Gou Le feels not worth it.😂
$XAN Signal】Long 1H/4H bullish continuation
$XAN 1H RSI 74.23, 4H MACD bullish histogram expanding. Order book depth imbalance -38.89%, with considerable selling pressure, yet the price is still holding around 0.018. Funding rate 0.0238%, with no signs of overheating. Buyers are absorbing at 0.0179-0.0180, and short-term momentum remains intact.
🎯Direction: Long
⚡Entry/limit order: 0.01800283 - 0.01805700
🛑Stop-loss: 0.01787643
🚀Target 1: 0.01832786
🚀Target 2: 0.01846328
🛡️Trade management: Reduce the position by 50% upon reaching Target 1, and move the stop-loss to breakeven. Automatica
post-image
XAN+18.75%
BTC-0.42%
ETH+0.50%
SOL+2.29%
$JUP Signal】Go long: 1H breakout followed by pullback confirmation
$JUP Current price 0.2663. After the 1H breakout, price pulled back on declining volume, while the 4H Bollinger upper band at 0.2587 has been broken through. RSI is 77.02 on 1H and 73.56 on 4H, with funds still aggressively supporting the price in the overbought zones on both timeframes. The 4H MACD bullish histogram continues to expand, while the 1H histogram is contracting. Momentum is slowing, but the direction remains unchanged. Buy orders account for 0.75 of the order book; sell-side depth has a slight edge. The 0.0050%
post-image
JUP+20.68%
BTC-0.42%
ETH+0.50%
SOL+2.29%
This $CHIP trade took profit proactively near the target, without getting greedy for the final acceleration. Volume has clearly contracted, lowering the probability of another push higher; the biggest fear is watching floating profits ride another roller coaster.

Looking back at the entry logic: the price pulled back to the platform around 0.05377, and the four-hour candle closed with a long lower wick, making the shift between bulls and bears fairly clear. I entered with 30% of the position to test, then held throughout once it stabilized.

During the rally, I originally planned to sell 70
post-image
CHIP-3.06%
DOGE+0.17%
XRP-0.59%
I was just about to close the position and curse the market a little, but it turned around and dropped my jaw instead. While everyone else was running, I kept my eyes on the chart, thinking, what’s the point of cutting losses at a level like this? The pullback held, and support was still there, so I went long as planned and took a shot.

The entry price was 453.65. I opened a long position without hesitation and immediately took a clear direction. A lot of people were saying it would keep falling at the time, and I couldn’t be bothered to argue. The chart doesn’t lie—the price speaks for itse
post-image
DELL+0.25%
LAB-2.88%
BTC-0.41%
While monitoring the market just now, I noticed a subtle detail: after a sharp move in a low-liquidity area, volume failed to follow. I immediately sensed an opportunity. When the market pulled back, I didn't hesitate and quickly entered a short position.

Within minutes of entering, a rapid drop appeared, with the candlestick plunging particularly fast. I placed my first take-profit at the upper edge of the lower consolidation platform. After the order filled, I continued holding the remaining position. Since the selling pressure around $BR showed no sign of easing on the order book, while t
post-image
BR-16.34%
XRP-0.59%
ETH+0.51%
$FLOCK #FLOCK / USDT - 0.07259 (+33.44%)
Live Data: 0.07259 | 24h High 0.08200 / Low 0.05092 / Vol 129.09M / Turnover 8.50M | EMA5: 0.07136 | EMA10 0.06557 | EMA30: 0.05292 | MFI: 90.07 | Today +18.11% | 7d +108.29% | 30d +156.59% | 1y -75.04%
Market Overview
The token moved from 0.03011 on Aug 26 to 0.07259, representing significant price appreciation over the last 10 days. The 30-day performance remains strong, while the 1-year performance reflects a broader historical decline.
Technical Snapshot
EMA5 (0.07136) remains above EMA10 (0.06557), while EMA10 stays above EMA30 (0.05292), indic
post-image
FLOCK+34.13%
  • 2
ETH Outlook and Trading Suggestions

Current price: 2482. Slight gains over the past 24 hours, with market sentiment indicators showing bears in control and intense bull-bear contention in the market.

After surging on the four-hour chart, the price has entered a consolidation and pullback phase, while the Bollinger Bands are gradually narrowing; RSI is retreating from overbought levels, and the MACD red bars continue to contract. The broader upward structure remains intact. This is merely a technical pullback after the rise, so do not blindly chase short positions based on short-term market
post-image
GT-4.27%
ETH+0.51%
Why is $SKHYNIX /USDT's 15m RSI at 41.93 while the 4h chart screams lower—most traders are already late.

$SKHYNIX /USDT - SHORT

Trade Plan:
Entry: 1278.91 – 1281.75
SL: 1293.92
TP1: 1270.14
TP2: 1263.34
TP3: 1253.15

Why this setup?
This isn't a breakout; it's a controlled descent. With 1D stuck in 'range' and ATR at 5.66, volatility is compressing before a snap. The short setup is armed: entry 1280.33, but the real meat is TP2 at 1263.34. Why now? The momentum divergence between the 15m (cooling off) and the 4h bias (SHORT) means smart money is distributing into that 1281.75 high. If we
SKHYNIX+0.15%
I originally wanted to cut losses and sacrifice the flesh to the heavens, but the sacrifice never happened—the flesh cooked itself instead. 🍖

A few days ago, I checked the charts after lunch. $CYS was grinding back and forth at the lows, making me drowsy. But the more I watched, the more something felt off: several rebounds moved up in tiny steps, volume never followed through, and selling pressure stayed overhead. This kind of low-volume rebound is usually a big gift to the shorts. Nothing to overthink—I directly placed a short order at 0.4520.

As a result, the market chose the direction
post-image
CYS-2.44%
SNDK+0.20%
DOGE+0.17%
#USELESSSurgesAnother67%
USELESS Token Posts Another Sharp Surge And Grabs Market Focus
USELESS, the meme coin that has built a cult following by leaning into its name, has printed another powerful upside move. After a calm phase, the token has come back with strong volume and fast price action, pushing it into top trending lists. The move has sparked fresh talk across trading desks, as many try to grasp why a coin that jokes about having no use keeps drawing such heavy bids.
① Why The Recent Rally Stands Out
This latest leg up is notable for its speed and breadth. Buy flow came from both spo
USELESS-25.50%
  • 5
  • 3
Financial News, Crypto Updates, Real-World Strategies
live-cover
LIVE1,304
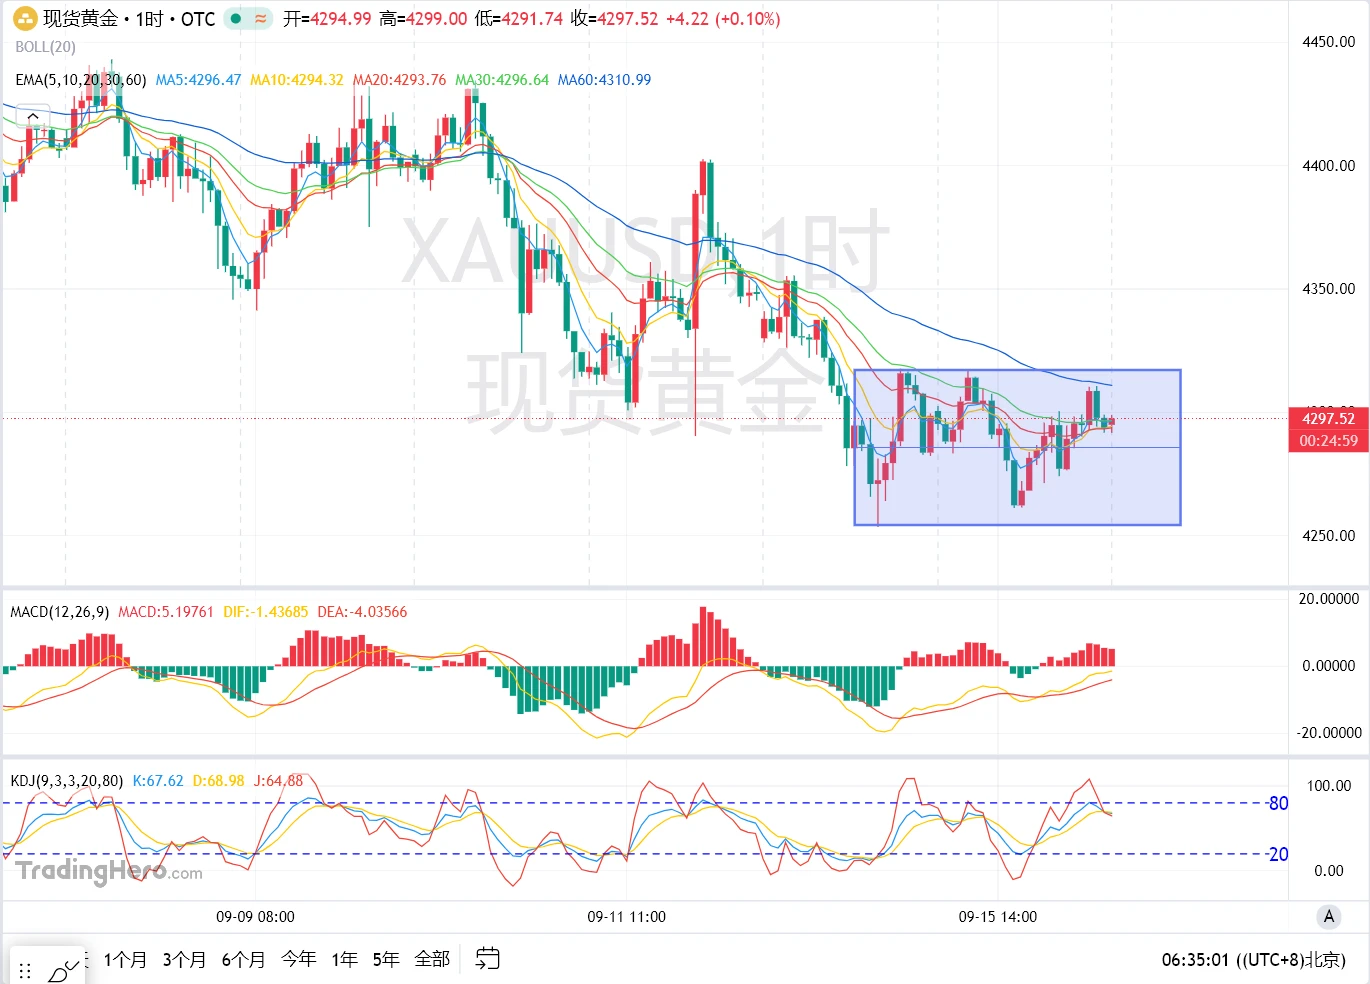
Everyone’s watching gold, but you’re blind if you missed $XAU /USDT’s 4h trap door.

$XAU /USDT - SHORT

Trade Plan:
Entry: 4432.35 – 4434.39
SL: 4443.13
TP1: 4426.05
TP2: 4421.17
TP3: 4413.84

Why this setup?
Why now? The 1D trend is *range*, yet the 4h signal just armed SHORT with 55% confidence. RSI on the 15m is crushed at 38.81—momentum is fading fast. Price is pinned at 4433.37, squeezing between entry support and a 4.06 ATR that’s begging for a 10-point drop. TP1 at 4426 is the first crack; TP3 at 4413 is the floor if sellers commit. This isn’t a gamble—it’s a low-risk slide with inv
XAU-0.24%
$UNI
Ripping from 5.453, now pressing 7.484. Price below the 5 and 10 but above the 30—pullback after a strong move. Break above 7.114 triggers recovery; rejection retests 6.962. Momentum cooling but structure intact.
Entry Zone: 6.960 – 6.965
TP1: 7.114
TP2: 7.484
TP3: 7.700
Stop-Loss: 6.560
#UNI #Gate60MillionUsers #BTCReclaims80K #HYPEBreaks88HitsNewAllTimeHigh #GateEventContractTradeSharingChallenge
post-image
UNI+7.36%
  • 3
  • 1
Dollar surges, gold plunges $70, Dow drops 380 points—a cross-asset massacre triggered by one data release
After the nonfarm payrolls release, the U.S. Dollar Index instantly climbed 35 points, rising from 99.035 to 99.932, up 0.5% intraday. The 10-year U.S. Treasury yield jumped 5 basis points. Spot gold plunged $70 in a short period, briefly falling below $4,400 per ounce, down 1.66% intraday.
But one detail is particularly intriguing: Gold’s decline was clearly larger than the moves in the dollar and yields would suggest. Analysts at HuiTong Finance pointed out that this indicates technical
MU+5.89%
$HYPE : Breakout or Confirmation?
HYPE reached ~$89.6, clearing its previous ATH near $86.7.
The breakout is now facing its first real test: can $86–87 hold as support?
Key levels: → $86–87 — first support
→ $84–85 — secondary support
→ $80–82 — structure weakens below here
Beyond price, Hyperliquid’s fee mechanism channels part of trading fees into HYPE purchases through the Assistance Fund, with acquired tokens burned.
But leverage remains elevated: futures volume is roughly 13× spot.
U.S. access could add another catalyst, but remains a possibility — not an approval.
For now, the key is con
post-image
HYPE+2.68%
$ARB ‌ ‌ARB / USDT - 0.19201
Live Data: 0.19201 +44.79% | 24h High 0.20616 / Low 0.13181 / Vol 107.88M / Turnover 19.32M | 4h EMA5:0.18633 EMA10:0.17213 EMA30:0.14443 | MFI:65.99 | Today +18.74% / 7d +115.62% / 30d +143.08% / 90d +130.78% / 1y -60.68%
1. PROJECT DETAILS
Arbitrum is the largest Ethereum Layer2. ARB is its governance token. NO.10 Hot, NO.12 Overall. Base was 0.08312 on Aug 31, now 0.19201 is +131% in 5 days. Despite 1y -60.68%, short-term momentum is the strongest in Layer2 sector.
2. WHAT TO WATCH
Parabolic Breakout: EMA5 0.18633 > EMA10 0.17213 > EMA30 0.14443 - perfect bulli
post-image
ARB+38.63%
ETH+0.50%
  • 3
#USAugustNFPBeatsExpectations
August Jobs Report Beats Outlook
Fresh labor data from early autumn brought a welcome lift for observers who watch job creation. After weeks of cautious tone, August payroll growth came in above collective outlook, easing fear of a sharp slowdown and reviving debate over how solid household income remains.
① Labor Market Shows Renewed Vigor
The headline figure surprised many who had braced for a cooler period. Private firms led gains, while public sector hiring added modest support. Service related roles provided much of the push, with leisure, health care and
post-image
AKE has fallen 27% in 24 hours. Those who entered with 1,000U now have only 730U left, while the shorts next door have already doubled their money. With the same 1,000U, one bought the bottom and the other sold the top—the outcomes couldn't be more different. At 0.0139, the overhead bagholders have been dumping all the way down from 0.0214, and retail traders are cutting losses every minute. A rebound to 0.015 would be an opportunity to escape; don't fantasize about a V-shaped reversal. The 170 million in trading volume looks lively, but volume is increasing as the price falls, indicating that
AKE-27.60%
Load More

Join 40 M users in our growing community

⚡️ Join 40 M users in the crypto craze discussion

💬 Engage with your favorite top creators

👍 See what interests you

View More