Share your thoughts
placeholder
Article
New coins are launching one after another—how can you find opportunities worth watching? What is sma
live-cover
LIVE1,885
Sorry everyone, because of me, I missed the 4,435 short trade and missed out on a profit opportunity.
post-image
  • 1
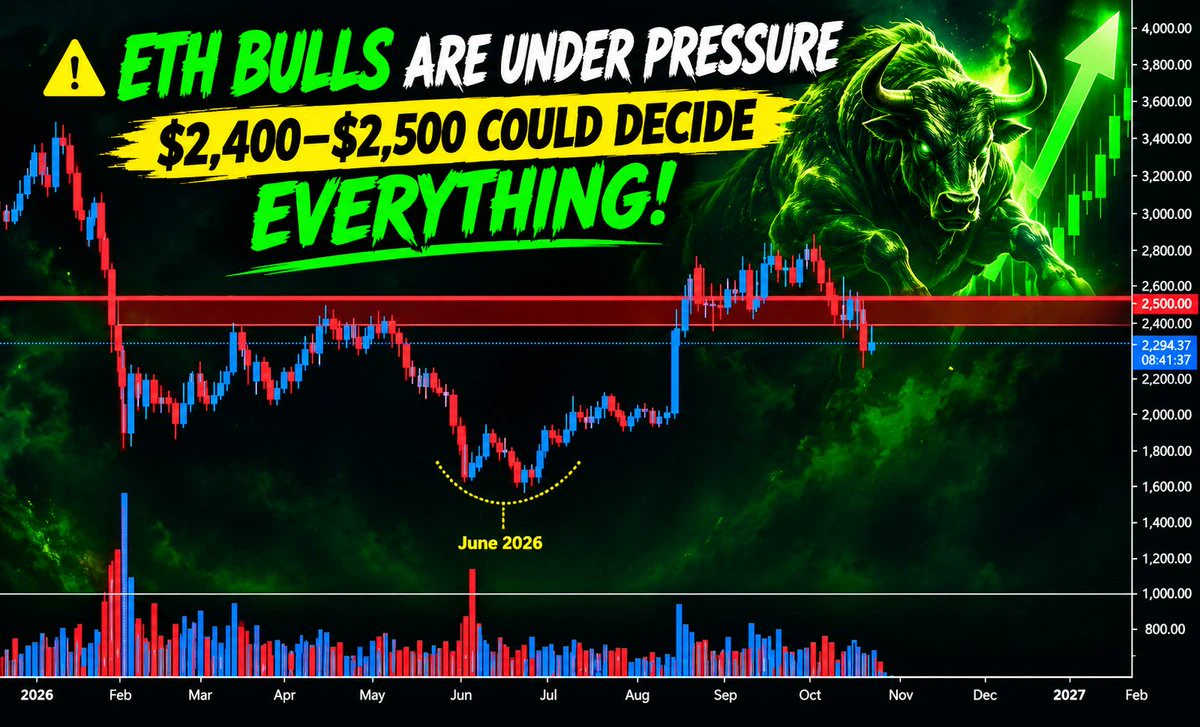
9.10, Thursday, ETH, afternoon outlook

Repeated attempts to rise have been met with resistance, and the rebound remains weak. Overall, it is following BTC lower under synchronized pressure, with short-term sentiment bearish and the market repeatedly oscillating while forming a bottom.

Trading strategy
Short around 2485‑2500 on a rebound, targeting 2430-2445, with further downside toward 2350$ETH #GateUS与RQDClearing达成战略合作
post-image
ETH-1.30%
Crude oil’s recent price action has been highly consistent with the trading system, reacting very closely at support and resistance levels. This is already the Nth time I’ve perfectly taken profits. $CL
post-image
CL+1.34%
September 10 Crypto Market Watch: The “Quiet Period” Before the Data Window
During the day, the crypto asset market continued to trade within an extremely narrow range, with overall volatility of only about 2.1%. The Bollinger Bands visibly narrowed, trading volume continued to shrink, and multiple moving averages converged. The market greed index stood at 69, with funds clearly retreating toward large-cap assets and cash, reflecting an overall pattern of “sideways trading at elevated levels and strong wait-and-see sentiment.”
Reason Analysis
The core factor is that the market is proactively r
post-image
BTC-1.59%
BTC forecast chart for Thursday at 09:10 today
BTC-1.60%
Layout for Bitcoin, Ethereum, and Dogecoin
live-cover
LIVE1,330
9/10 daily time frame “long-short ratio” data analysis: Large traders are increasing long positions against the trend, while retail investors are slightly bullish
1. The market funding rate is 0.0045%, within the normal range.
2. The retail long-short ratio is 0.5103. Retail investors switched from shorts to longs and then became trapped again, with the overall long-short balance even.
3. The large-trader long-short ratio is 2.19. Large traders are increasing long positions against the trend.
Large traders: Continuing to increase long positions against the trend, heavily weighted toward longs
BTC-1.59%
  • 1
9、9/10 Afternoon Market Outlook and Strategy
Gold surged to a high of 4434.53 before pulling back, with the current price at 4406.93. On the one-hour timeframe, the price has come under pressure and pulled back from the high. Short-term moving averages have shifted from support to resistance, and the short-term market has entered a corrective pullback after the surge, while overall it remains in a range-bound pattern.

Short-term resistance above: 4411‑4416; the intraday high of 4434.53 is strong resistance;
First support below: 4389; key defense level: 4375. If 4389 holds, the market will co
post-image
XAUT-0.12%
Hey traders, $VVV ‌is down 10% today but I’m seeing a potential reversal signal on the chart – let’s break it down.
Venice Token is trading at $24.249, after a wild swing that saw it jump 3.14% in 15 minutes and then pull back 13%. The 24h high is $27.988 and the low is $22.179, so the volatility is real. Price is currently hovering just above EMA5 ($24.153) and EMA10 ($24.023), while EMA30 sits at $23.963 – meaning the short-term trend is trying to stabilize. The MACD is showing a bullish crossover: DIF (-0.013) is above DEA (-0.039), with the histogram turning positive at 0.025. That tells
post-image
VVV-8.34%
  • 3
  • 2
🇺🇸 US PPI DATA DROPS TODAY 👀
PPI drops at 8:30 AM ET today
Forecast:
PPI: 5.3% YoY
Core PPI: 4.1% YoY
post-image
#USTreasuryToBuyBackUpTo6Billion US Treasury to Buy Back Up to $BTC Billion, A Signal Worth Watching
The US Treasury is set to buy back up to $6billion of its own debt, putting another important development in focus for global markets.
Treasury buybacks can influence liquidity, demand, and market expectations. When the government repurchases outstanding securities, it can help manage the supply of certain bonds while potentially improving market functioning.
For traders and investors, the bigger story is how this move interacts with interest rates, Treasury yields, dollar strength, and broader
BTC-1.60%
I only wanted to mooch a free breakfast, but the market ended up trapping me for half a year. 😂 A few days ago in the afternoon, while watching the market, $SNXX was still moving sideways at the bottom. Seeing no breakdown, I flagged a small long position around 13.489, planning to follow once buying strengthened. With a small position, there was no need to panic.
When I checked the market after lunch, the price had not fully taken off yet, and the pullback had stabilized. Many people were still hesitating. Looking at it now, it has already climbed to 17.732, with a +1515.55% return right th
post-image
SNXX-0.81%
ETH-1.29%
XRP-3.16%
Yesterday, high-level shorts across multiple assets collectively paid off
BTC: Shorted at 79800 under resistance, bottomed at 77700, capturing 2000 points
ETH: Shorted the rebound at 2520, bottomed at 2440, capturing 80 points
SNDK: Positioned for a high-level short at 1800, capturing 60 points on the pullback
XAU: Shorted near 4430, pulled back as expected, capturing 50 points

The bearish outlook across the board fully played out. Choosing the right direction matters, but holding the position matters even more.
I watch the market, you trade—that simple. #美国财政部将回购至多60亿美元美债 $BTC $ETH
BTC-1.59%
ETH-1.29%
This move doesn’t even require me to think—the account is partying on its own. I opened the charts this morning, and $WLD held firm after one pullback. Buying pressure was clearly getting stronger, so I knew at a glance that this move wasn’t over yet. The prompt at the time was: get in once it holds; don’t wait for it to fly before kicking yourself.

Don’t lose patience in the range, then try to win back your dignity in a one-way move.

0.3669 to 0.4105, unrealized gain +843.78%—nailed it. No trades, no analysis, all thanks to sheer luck? No, the entry was comfortable and the timing was rig
post-image
WLD-9.30%
ADA-2.91%
BTC-1.59%
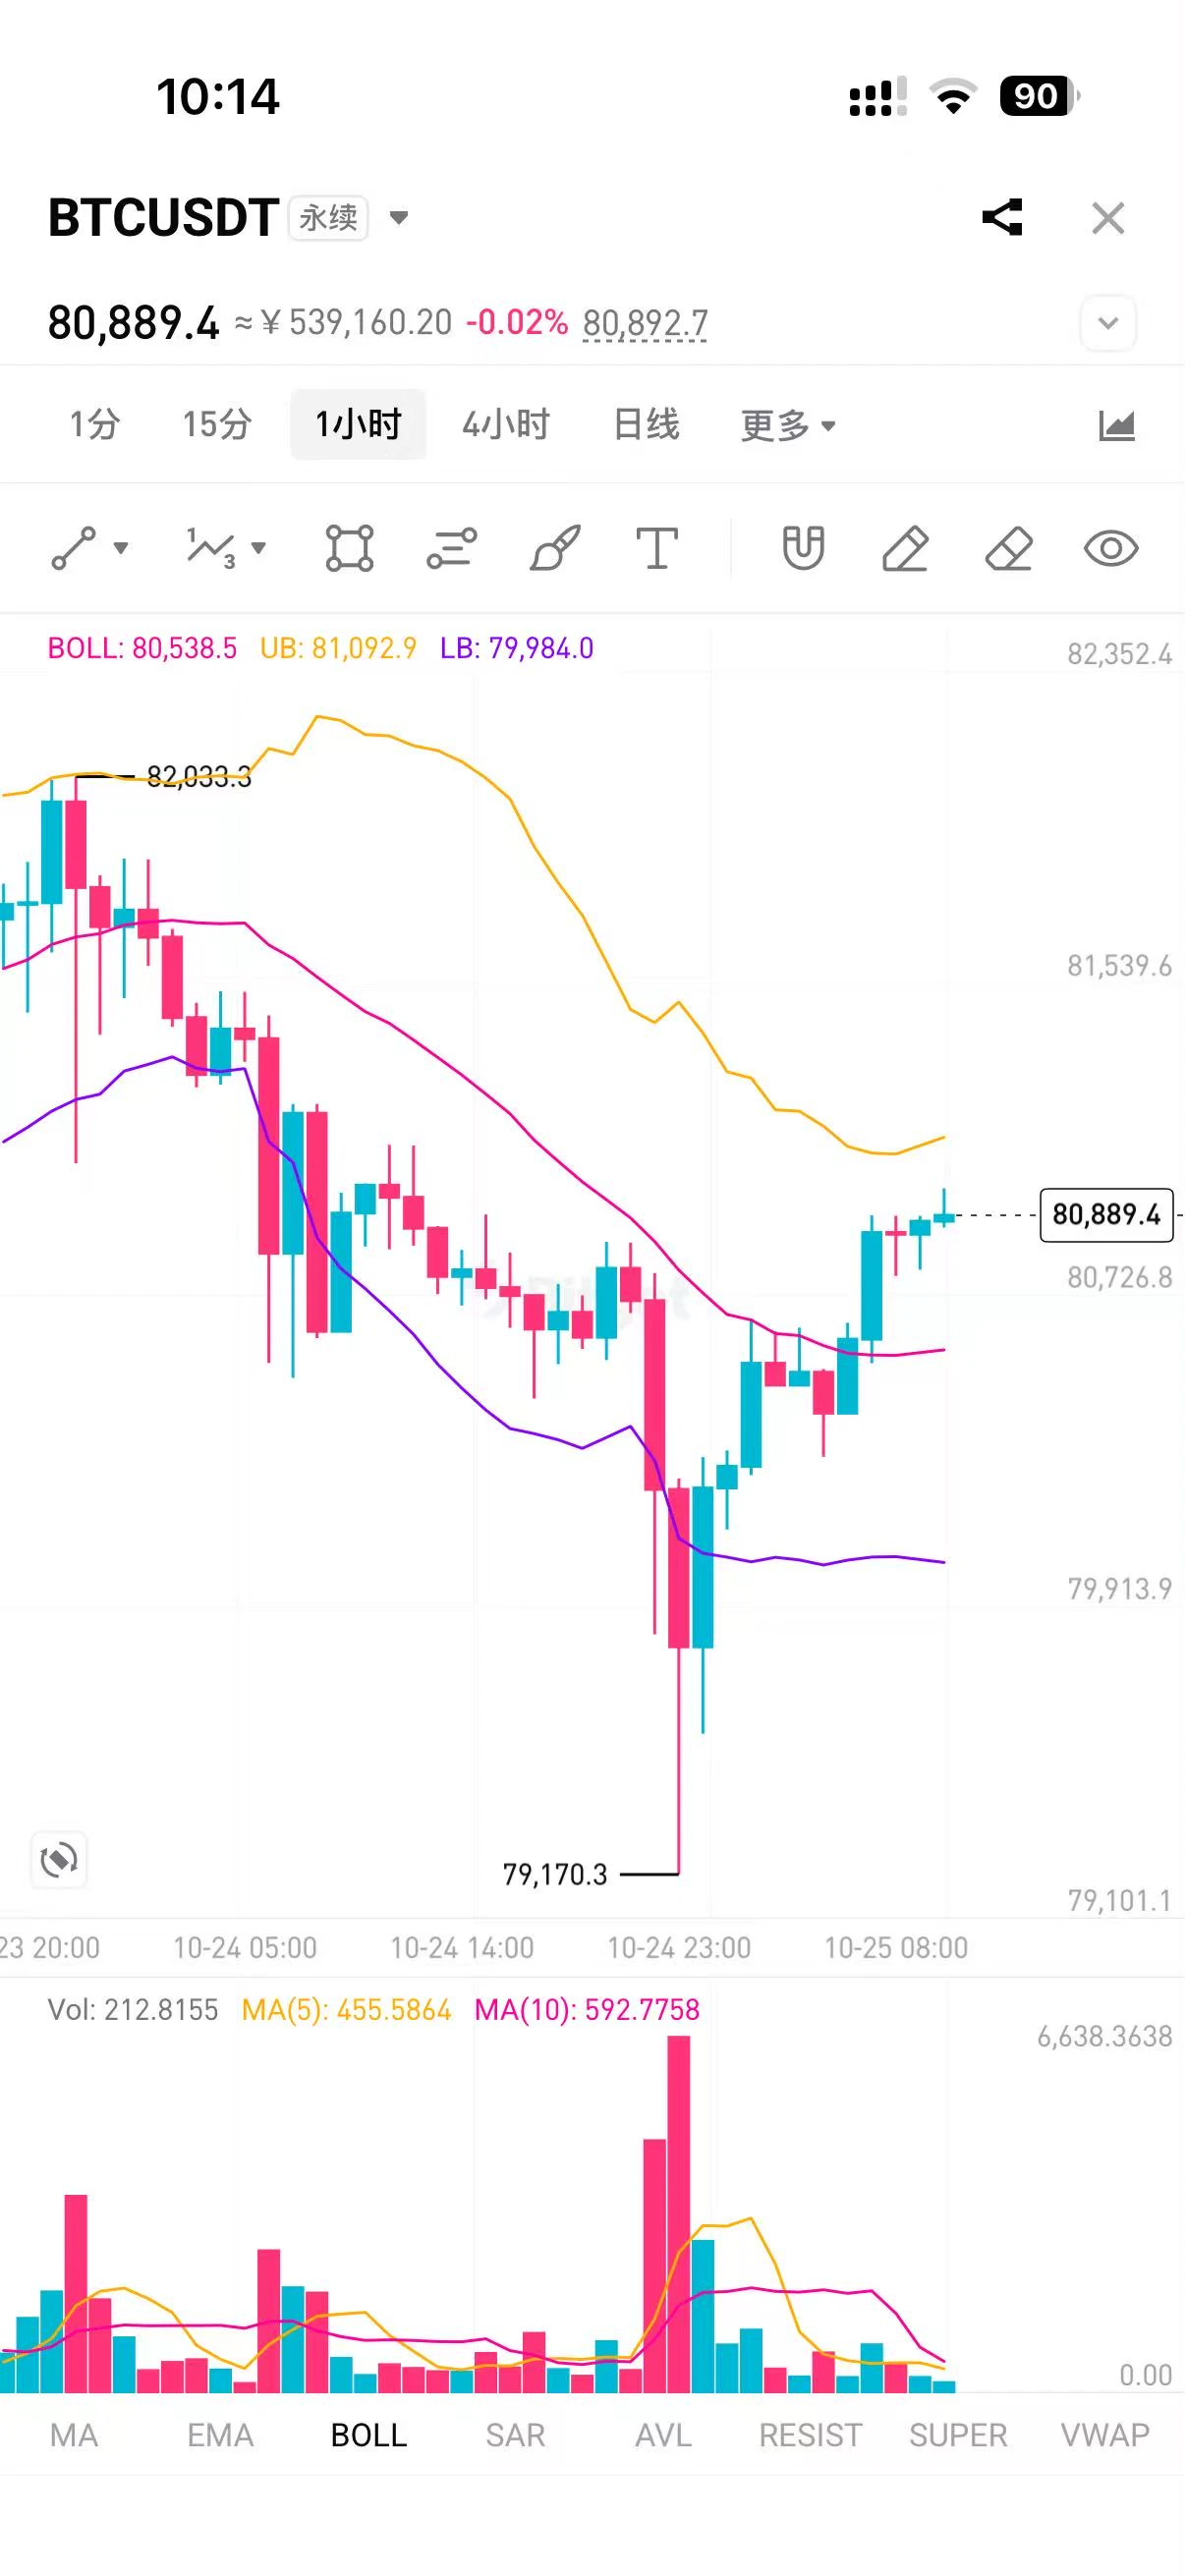
Yesterday, Bitcoin came under pressure after rebounding to around 79800 and oscillated downward all the way, touching a low of around 77700 in the early hours. The move fully matched our expectations, and our short around 798 delivered a solid 2,000-point pullback!
From the current chart, the daily upper Bollinger Band is turning downward, and the price has fallen back below the middle band. The bullish uptrend structure has been broken, with 80832 constituting strong resistance above. The 4-hour Bollinger Bands are opening downward, with the price running below the middle band and the highs g
post-image
BTC-1.59%
Most traders will miss this UNI setup hiding in plain sight

$UNI /USDT - LONG

Trade Plan:
Entry: 5.949 – 6.007
SL: 5.617
TP1: 6.249
TP2: 6.430
TP3: 6.701

Why this setup?
Why now? The daily trend is bullish and the 1h ATR of 0.115841 shows enough momentum to push from the entry zone toward the first target. The 15m RSI at 50.4 confirms the 4h trend has room to run before hitting overbought territory. The entry reference of 5.978 sits at the 1h price, making it the precise trigger for a long position. The first target of 6.249 and the second target of 6.430 define the profit ladder, while
UNI-11.26%
The early-session market action fully exposed the market’s fragility: Bitcoin tested 77700, while Ethereum dipped to 2440. Many retail investors saw the brief rebound and prepared to buy the dip, overlooking the dominant bearish structure. This is merely a brief consolidation during the decline.
Bottom signals are currently absent, and no solid bottom has formed on the lower time frames. To form a bottom, the market must either continue moving sideways to absorb selling pressure or surge strongly and then undergo a slight pullback to establish a reversal. Neither of these two characteristics i
post-image
BTC-1.59%
ETH-1.29%
SOL-2.91%
  • 1
🚨 $USDT and $USDC together control 94% share of the leading stablecoin market.
New stablecoins and 25+ competitors are fighting only for the remaining 6% market share.
post-image
USDC+0.04%
$PONS ’s -27% big bearish candle looks like a waterfall to retail traders, but I see a coordinated scheme. The market makers’ playbook has just three steps: first push it to 0.8151 to create FOMO, then unload their holdings at the top onto late buyers, and finally crash it through the 0.60 round-number level to trigger stop-loss orders. The 24h trading volume of 191.9M shows that turnover was sufficient; panic sellers are cutting their losses and exiting, while holdings are shifting from weak hands to strong hands. It is now at 0.5887, close to the low of 0.5869, so don’t rush to buy the dip—w
PONS-25.35%
Load More

Join 40 M users in our growing community

⚡️ Join 40 M users in the crypto craze discussion

💬 Engage with your favorite top creators

👍 See what interests you

View More