Square
Following
Hot
News
Profile
Share your thoughts
placeholder
Article
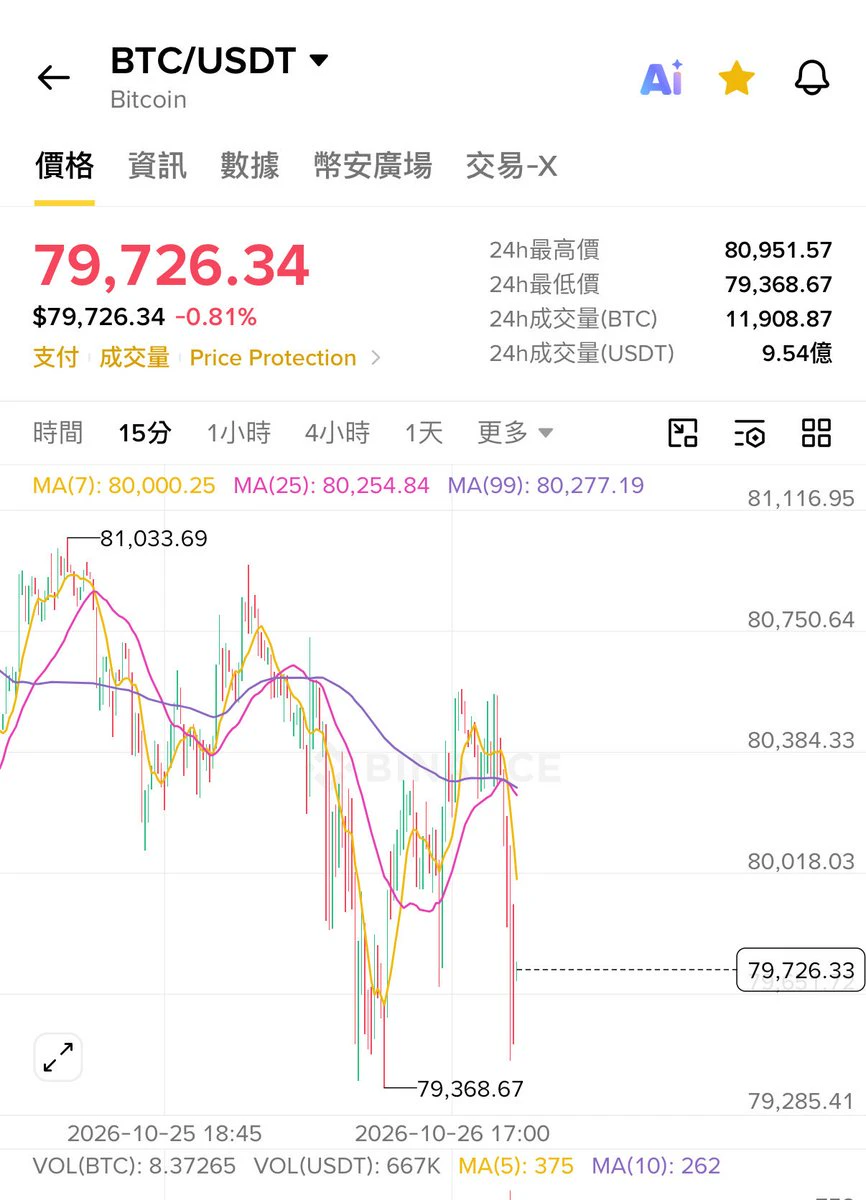
Better to lose more than chase a short!!!!!
What’s your view on what comes next? Duoduo will update after dinner~
post-image
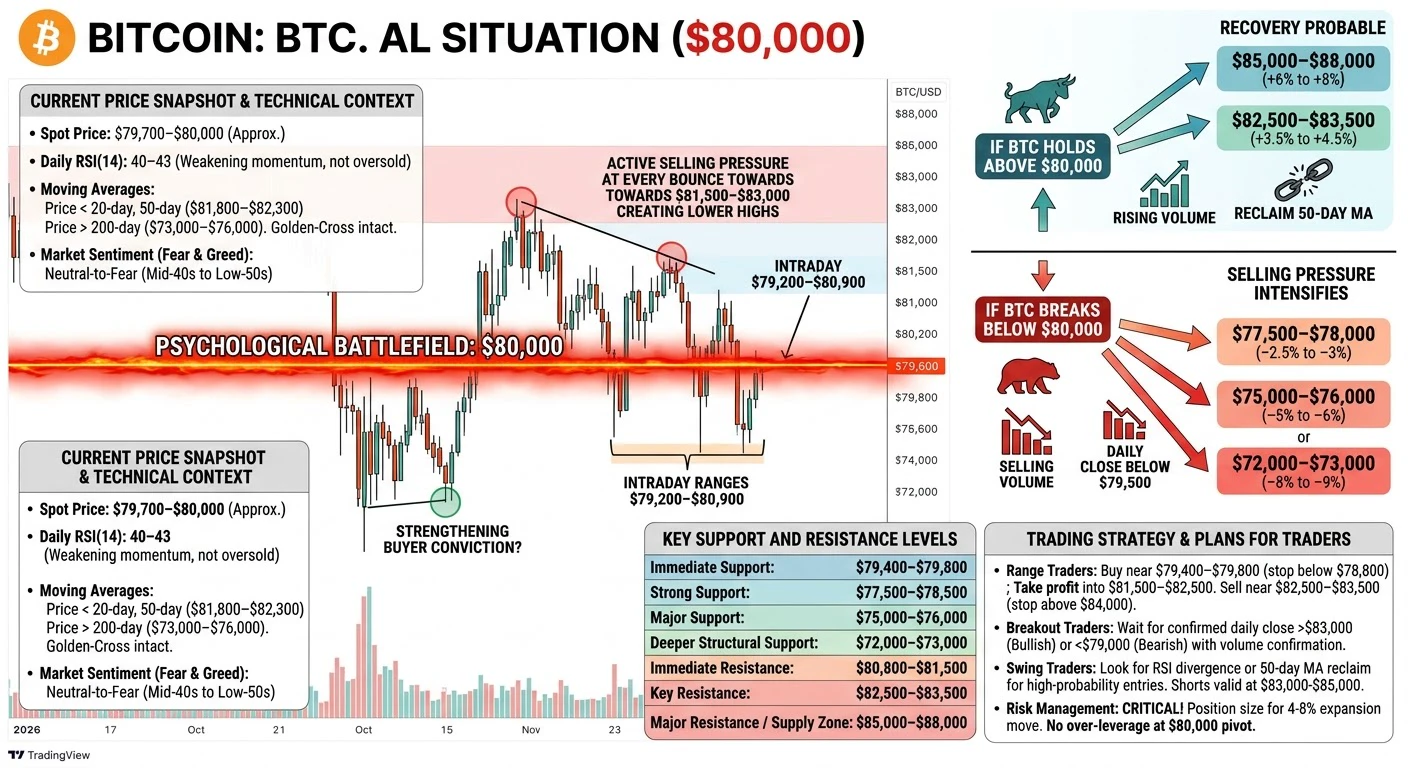
BTC/USDT MARKET UPDATE: IS BITCOIN PREPARING FOR A STRONG BOUNCE?
Bitcoin is showing an interesting price movement on the 4-hour chart! At the time of this snapshot, BTC is trading around $82,513, after experiencing a sharp decline from the $85,000–$86,000 region toward a recent low of approximately $80,397.
📊 Key Technical Levels to Watch
🔹 Current Price: $82,513
🔹 Immediate Resistance: $82,881
🔹 Major Resistance: $83,816
🔹 Strong Resistance Zone: $85,868–$87,513
🔹 Immediate Support: $81,875
🔹 Major Support: $80,397–$80,935
📉 What Is the Chart Telling Us?
Bitcoin recently faced stron
post-image
BTC-0.45%
☀️ GM. Buckle up. 🎢
Markets can shift fast. Is your trading plan ready?
📌 Today's topic: What's your safety belt in a volatile market?
🛡️ How are you managing your positions?
👀 What risk signals are you watching?
📝 Any recent trades worth reviewing?
Chasing opportunities matters. Managing risk matters just as much.
Share your strategy or trade recap on Gate Square. Quality posts may get featured and receive extra exposure.
👇 Share your take:
https://www.gate.com/post
Gate_Square
☀️ GM. Buckle up. 🎢
Markets can shift fast. Is your trading plan ready?
📌 Today's topic: What's your safety belt in a volatile market?
🛡️ How are you managing your positions?
👀 What risk signals are you watching?
📝 Any recent trades worth reviewing?
Chasing opportunities matters. Managing risk matters just as much.
Share your strategy or trade recap on Gate Square. Quality posts may get featured and receive extra exposure.
👇 Share your take:
https://www.gate.com/post
repost-content-media
  • 3
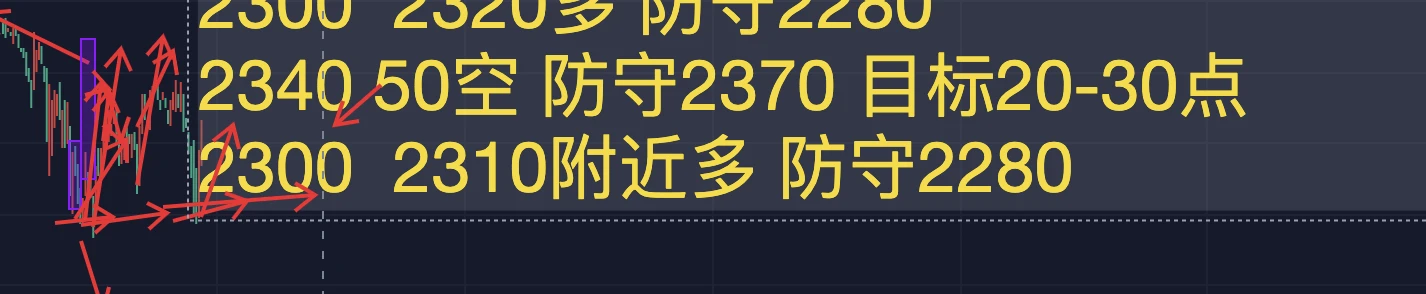
That ETH long from yesterday afternoon hit its stop-loss last night. Today’s update will likewise start with the stop-loss, then cover the rebound in the early hours.
Yesterday’s ETH long hit its stop-loss last night.
The long was opened around 2565 yesterday, with defense at 2542. The afternoon high reached 2574, just over 10 points short of the 2585 target, so it was missed. At 7:30 p.m., price broke below 2542, so we exited as planned, losing a little over 20 points.
BTC then continued plunging, reaching a low of 2409 at 2 a.m.
After rising from 2409, it surged directly to 2475 within three
post-image
BTC-0.45%
ETH-2.97%
The three A-share stocks I have been shorting all along—ChangXin Memory Technologies (CXMT), Innolight Technology, and Yushu Technology—plunged today. It looks like the bubble in A-share tech stocks is about to burst!#CXMT
post-image
Converting it into a unique guesthouse would at least triple the price, right?
The current sluggish real estate market is just lacking a sales genius like you 🤣
post-image
Gold continued its strong upward move in the early session, reaching a high of 4176 before pulling back slightly, and is currently trading near 4171. On the 5-minute chart, the Bollinger Bands are opening upward, with the price running along the upper band; the MACD red bars are gradually shortening, while DIFF and DEA remain above the zero axis, indicating that short-term bullish momentum has weakened somewhat. It is not advisable to chase longs at this level; wait for a failed push higher before entering at an opportune time, targeting 4100 on the downside!
$BTC $ETH #GateMoney正式上线 #BTC回调触及8
post-image
BTC-0.49%
ETH-2.99%
Greedy people see some fear
Wise people see some opportunity.
post-image
$BTC Current price 82256, 24h -0.77%, trading volume 1735.6M USDT, Fear & Greed Index 59, still in the greed zone—the price is drifting lower, but sentiment has not cooled, and this divergence usually means bulls have not surrendered yet, with selling pressure coming more from leverage than spot markets. On the funding side, funding rates across the market remain slightly positive, with longs still paying to hold positions, but the funding premium has been compressed, indicating that the willingness to chase longs is waning and shorts are beginning to cautiously add positions. In terms of liq
NEAR-11.48%
#BTC回调触及81000美元 A corpse lies at the bottom of the $81,000 pit: $429 million in liquidations has just been buried—dare you sleep in it?💀

BTC crashed to $81,125 yesterday, erasing half of September’s gains, then bounced back to $82K today. But don’t rush to mistake the “pit” for a “bed”—the $429 million in liquidation casualties at the bottom of this pit were just buried, with long liquidations accounting for 87.5%. Is $81K an “oversold bounce” or a “continuation of the decline”? Don’t look at the candlesticks—watch three things: the 10/14 CPI, whether ETF buying returns, and whether Treasur
BTC-0.49%
#浇朋友 #蓝v互关
The current employment environment~
I found a job in Chengdu with a monthly salary of 6000
Working hours are from 9 a.m. to 9 p.m. (with a three-hour break in between)—alternating one- and two-day weekends
The company provides afternoon tea, snacks, tea, coffee, and... every day
Most importantly, they provide cigarettes!!!
post-image
$XAU
Looking at gold’s trend, you can really laugh out loud😅 A shake on the four-hour chart is tough enough for one day; after a month, you start questioning your life🙃 Once this wave gets me back to break-even, I’ll switch up my approach on MT4 and see how many more days it can keep bouncing around🤡
post-image
XAU+1.38%
crypto market update
live-cover
LIVE1,933
According to SoSoValue data, Ethereum spot ETFs experienced a total net outflow of $72.54 million yesterday (October 8, Eastern Time). The Ethereum spot ETF with the largest net inflow yesterday was Fidelity's FETH ETF, which recorded a net inflow of $5.503 million, bringing its historical total net inflow to $2.334 billion. In second place was Morgan Stanley's Ethereum Trust MSSE, with a net inflow of $1.3209 million, bringing its current historical total net inflow to $42.679 million. The Ethereum spot ETF with the largest net outflow yesterday was BlackRock's ETHA ETF, which saw a net outfl
ETH-2.97%
TRUST+0.05%
There is no need to deny the strength of $TIA , but treating overheating as safety often comes when sentiment is at its most expensive.
I am watching just one divergence: whether there is still support after breaking through 0.5303. The current price is 0.5235, with volume at 0.18x. The 1-hour and 4-hour trends are both strong, with RSI at 76 and 56, respectively.
If volume continues to increase after breaking through 0.5303, the initiative will favor the bulls; if it falls below 0.4446 and fails to recover, the short-term outlook is invalidated, and the next level to watch shifts to 0.4351.
D
post-image
TIA+9.72%
#BTC回调触及81000美元 Bitcoin Pullback Reaches $81,000: What Could Happen Next?
Introduction: Bitcoin Faces Renewed Selling Pressure
Bitcoin (BTC) has attracted market attention after a pullback brought its price toward the $81,000 level. This movement highlights the volatility of the cryptocurrency market and shows how quickly market sentiment can change when traders reassess risk, liquidity, and short-term price trends.
A pullback does not necessarily mean that a broader bullish trend has ended. In some situations, it represents a temporary correction after a strong rally. However, if selling pre
BTC-0.45%
[New Streamer] Whales Moves in Sync!
live-cover
LIVE2,895
$JCT Market rally launch signal! Technical indicators show bullish momentum poised to surge; scaling in gradually and avoiding chasing highs is the right move. Are you ready?#Gate.io 🚀🔥 #每周来晒
JCT+44.87%
Hot CPI: A Rate Hike—or a Longer Wait for Relief?
Inflation can unsettle markets without forcing the Federal Reserve to raise rates.
The crucial shift is in the expected policy path, not the CPI headline alone.
Here is how to separate October tightening risk from a temporary market scare.
What would change?
In this hypothetical scenario, CPI exceeds expectations. That could strengthen October hike expectations, but the adjustment might instead mean fewer anticipated cuts or a longer hold. Without verified market pricing, assigning a probability would be speculation.
Composition matters: persis
post-image
xxx40xxx
Hot CPI: October Hike Risk or Delayed Rate Relief?
Markets can tighten financial conditions before the Federal Reserve changes rates.
An upside CPI surprise matters most when it changes the expected policy path—not merely the headline.
The distinction helps explain when pressure on crypto and U.S. stocks could persist.
A surprise is not a verdict
If CPI exceeds expectations, October hike expectations could rise. But investors might instead anticipate fewer cuts or a longer hold. Without verified starting probabilities, the magnitude of that shift remains unknown.
Persistence matters more than surprise alone. Broad-based core inflation would strengthen the tightening argument; an isolated energy increase would offer weaker evidence. Employment trends and Fed communication could reinforce or challenge either interpretation.
Where the pressure lands
If expected interest rates and Treasury yields rise, equity valuations could weaken as future profits are discounted more heavily. Earnings provide a separate test: resilient margins and guidance could cushion the impact, while deteriorating profits could compound it.
Crypto could face reduced speculative demand and tighter financing conditions. Leverage can amplify price moves, but losses are not inevitable: positioning and expectations already reflected in prices influence the reaction.
Strategy: separate confirmation from noise
A sustained rise in yields alongside restrictive Fed communication would strengthen the bearish scenario. Cooling underlying inflation or a reversal in bond-market repricing would weaken it.
One important countercase: weaker employment could reduce hike expectations yet still hurt stocks through recession fears. Easier policy expectations are not automatically bullish.
A disciplined framework watches yields, earnings guidance and crypto leverage together rather than chasing the first move.
Risk: Inflation releases can trigger reversals, slippage and leveraged losses. This is educational analysis, not personalized investment advice or a profit guarantee.
What evidence would persuade you that October’s dominant risk is renewed tightening rather than weakening growth, and why?
$BTC $GT $ETH
#ShareWeekly #weeklyshare #FedSeptemberMinutesLeanHawkish #GateSquare
repost-content-media
BTC-0.45%
GT-0.27%
ETH-2.97%
$PUMP ’s direction looks smooth, but trading volume is casting doubt on this move.
I’m watching just one divergence: whether it can quickly reclaim 0.005269 after breaking below it. The current price is 0.005628, with volume at 0.06x. The 1-hour and 4-hour outlooks are both weak, with RSI at 44 and 35, respectively.
If it breaks above 0.0062 and volume continues to increase, control will shift toward the bulls; if it breaks below 0.005269 and fails to reclaim it, the short-term thesis is invalidated. Stop trying to call the bottom for now and wait for a new support structure.
Don’t rush to gue
post-image
PUMP-6.75%
Load More

Join 40 M users in our growing community

⚡️ Join 40 M users in the crypto craze discussion

💬 Engage with your favorite top creators

👍 See what interests you

Trending Topics

GateAtTOKEN2049

35.2k Views20.8k Discussing

Gate brought a series of major events to TOKEN2049 Singapore! From the official launch of Gate Money to the F1 Red Bull driver meet-and-greet and the Gate Gala, we witnessed a new chapter of "One Gate, Borderless Finance." Which moment from TOKEN2049 stood out most to you?

BTC Pulls Back to 81000

25.41k Views35.7k Discussing

AIStocksFallALABDropsOver9%

24.61k Views554 Discussing

View More