


Square
Following
Hot
News
Notifications
Profile
Share your thoughts
placeholder
Article
A brief analysis of BTC’s short-term trend through Dow Theory, Chan Theory, Elliott Wave Theory, volume-price relationships, order flow, and price action
Reassessment: The Nov 14–15 capitulation timeline has been recalibrated! Based on Yahoo Finance’s official daily data: Nov 14 was not a rebound day, but a continuation of capitulation with a massive bearish candle (68,249→64,128, Low=63,329, V=44.02B); Nov 15 was the ultimate panic bottom (64,128→65,305, Low=62,017.88, V=39.76B). 62,017 was the ultimate low of this capitulation. Nov 16–17 saw low-volume consolidation in the 64,500–65,300 rang
BTC-0.67%
Live market update from dark princess
live-cover
LIVE2,592
Trenches
BP
B
bade
b
BP
BPxx...jPCy
Market Cap
$.
Change
.
24h Vol
$.
Holders
.
BAWSAQ
B
bade
b
BAWSAQ
4La9...pump
Market Cap
$.
Change
.
24h Vol
$.
Holders
.
mihao
m
bade
b
mihao
4Cxj...pump
Market Cap
$.
Change
.
24h Vol
$.
Holders
.
GTA6
G
bade
b
GTA6
4kjr...zDnz
Market Cap
$.
Change
.
24h Vol
$.
Holders
.
Marvin
M
bade
b
Marvin
HkRQ...pump
Market Cap
$.
Change
.
24h Vol
$.
Holders
.
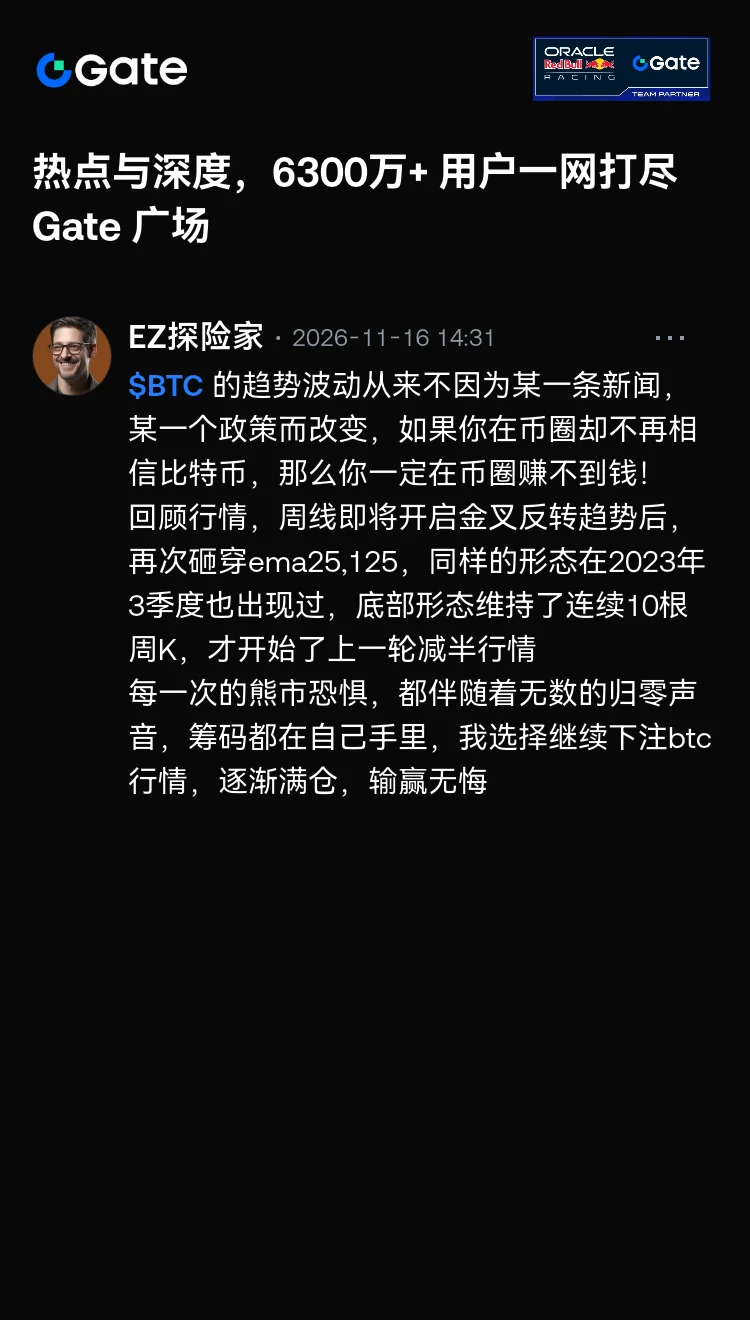
Once you’ve firmly chosen a direction, don’t let a few bullish candles shake you out!
The easiest way to lose money in trading isn’t getting the direction wrong—it’s flip-flopping: going long today, short tomorrow, and letting every move follow your emotions.

Ever since Bitcoin was above 87,000, I’ve repeated just one thing: short every rebound!
There have been bounces along the way, bull traps, and calls to buy the dip everywhere, but my thinking hasn’t changed from start to finish. Don’t try to call the bottom or catch a falling knife. A few bullish candles won’t shake my view of the trend.
post-image
BTC-0.65%
ETH-1.23%
11.16 Market Analysis
SOL Reference Setup
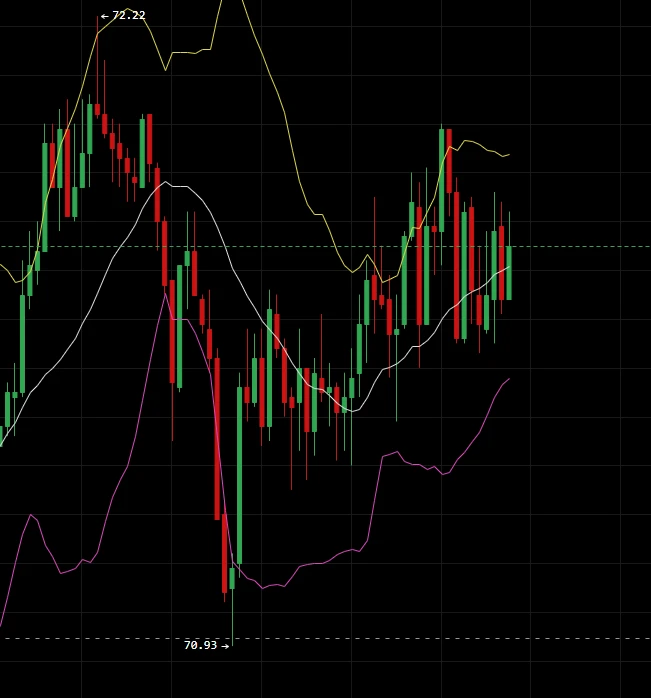
Rebound near 72.5–73.2
Defense level: 73.8
First target: 71.0, second target: 70.0
SOL is currently trading at 71.95. On the 1-hour chart, the price began rebounding from a low of 69.87, climbed to a high of 72.91, and then pulled back. It is currently fluctuating within the 71–72.5 range.

Recent candlesticks have alternated between bullish and bearish, with large candles frequently switching direction, reflecting intense competition between buyers and sellers. The short-term direction remains unclear; bearish momentum has eased somewhat, and the pric
post-image
BTC-0.65%
SOL-0.74%
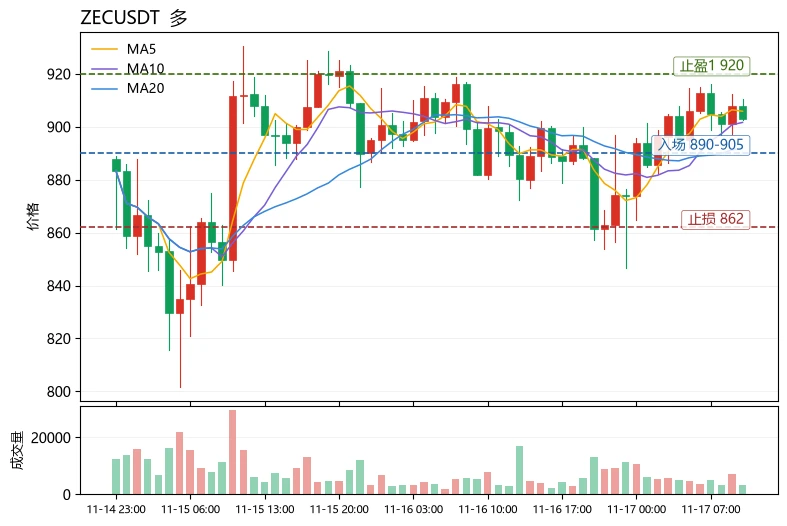
$ZEC Current price 903.28, 24h +0.36%, trading volume 134.7M USDT; MA5=905.86 is above MA20=891.97, RSI=53.3 is neutral-to-bullish, the MACD histogram at +2.278 remains bullish, Bollinger Bands [863.72, 920.22], funding rate -0.0036%, and the Fear & Greed Index is only 12 (extreme fear). The data is clear: the trend structure remains intact, but the market is at the end of a consolidation phase with tangled moving averages, leaning bullish.
Using this coin as an example, here’s a reusable chart-reading method: use moving averages to assess whether a trend is healthy. Focus on three points: Fi
post-image
ZEC+1.16%
SOL-0.77%
$PI Faith is being ground into the dirt
PI-0.60%
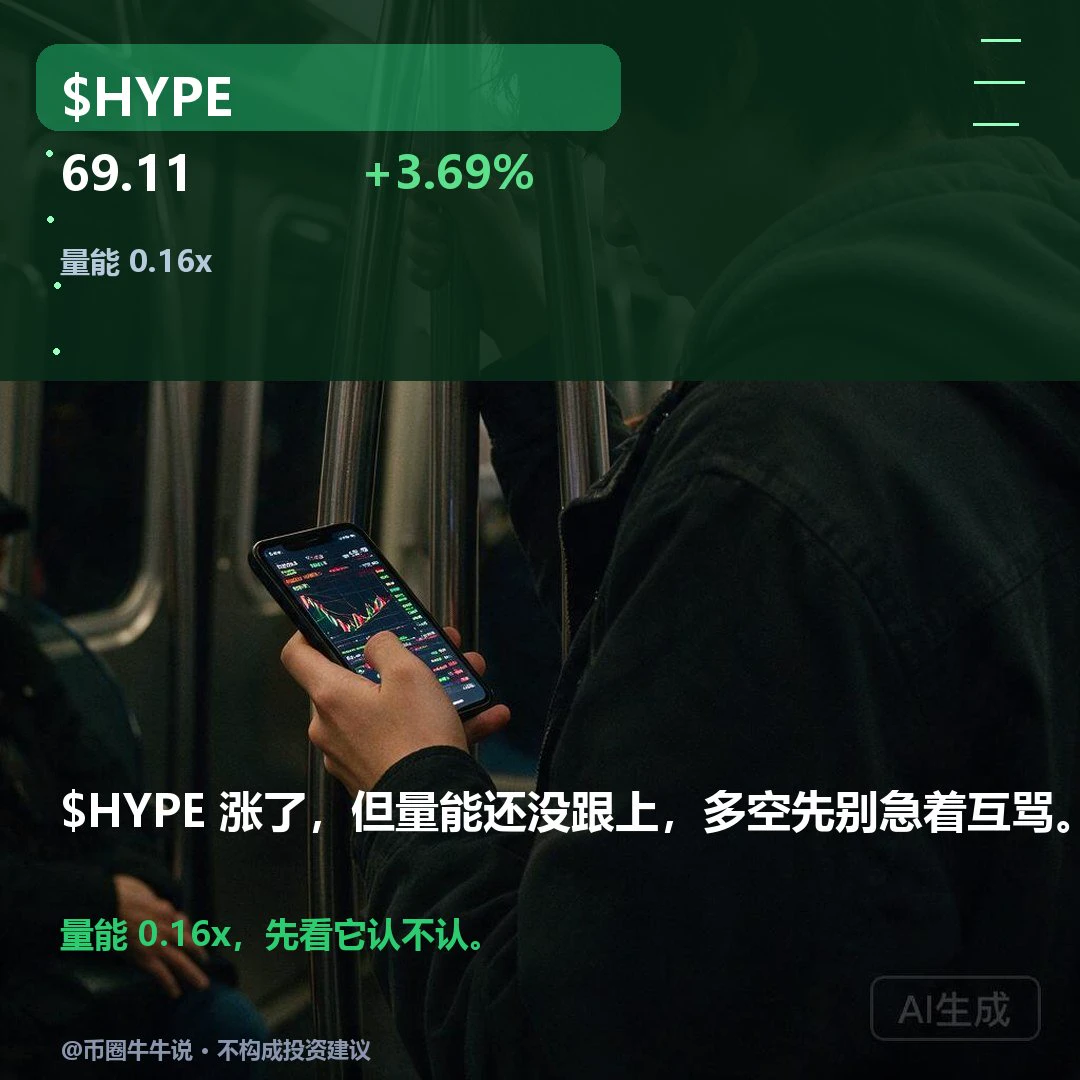
$HYPE Currently at 69.106, up 3.69% over 24H (range: 64.847–71.046). The 1H trend is strong, with an RSI of 71; the 4H trend is also strong. If it breaks above 71.046 decisively, watch for further upside. If it falls below the 64.847 support, the short-term structure may weaken. The market is volatile; for observation only.
#HYPE #Hyperliquid
post-image
HYPE+0.24%
No wonder they paid to have these photos taken
They turned out really great🙈
post-image
social-auto-f81bc9e9564f4e8a8003a9d1753a20b7
Repost test copy must contain at least ten characters
post-image
$PI Could the Lao Si couple👫 let the pioneers down? Could they be cruel and heartless toward them? It doesn’t feel like they could. This coin price really isn’t good for pioneers who firmly believed and followed the pace all along—at the very least, it’s not very fair. Starting at 3U, they followed all the way, holding firm and only buying, never selling... A mink coat has turned into a little cotton-padded jacket...
But it has given speculators a chance to reap rewards without lifting a finger. Just think, what has happened to this world? You can’t have no faith, but what good is having fait
PI-0.60%
  • 3
Scumbag Watch: SpaceX 11.17
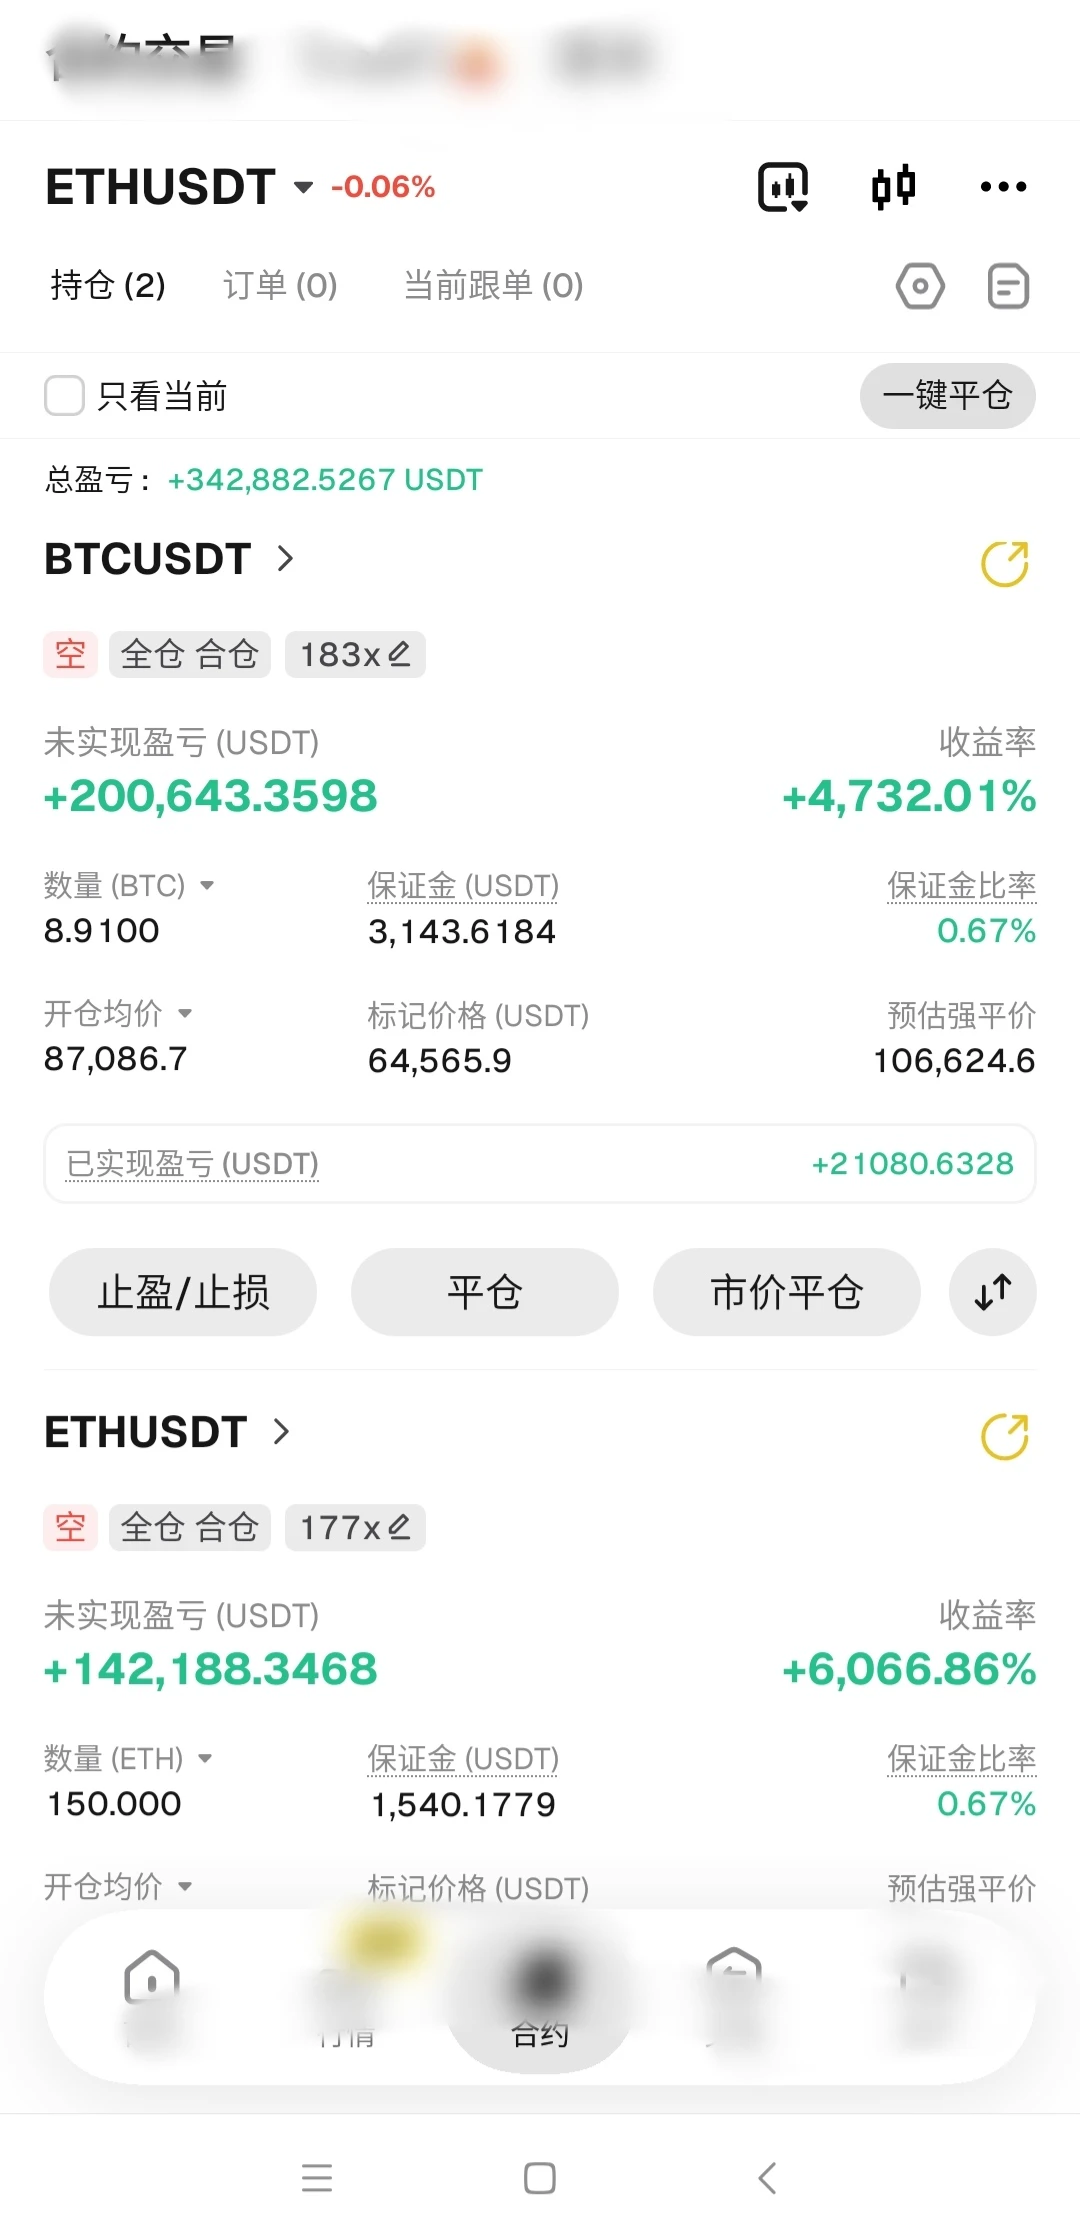
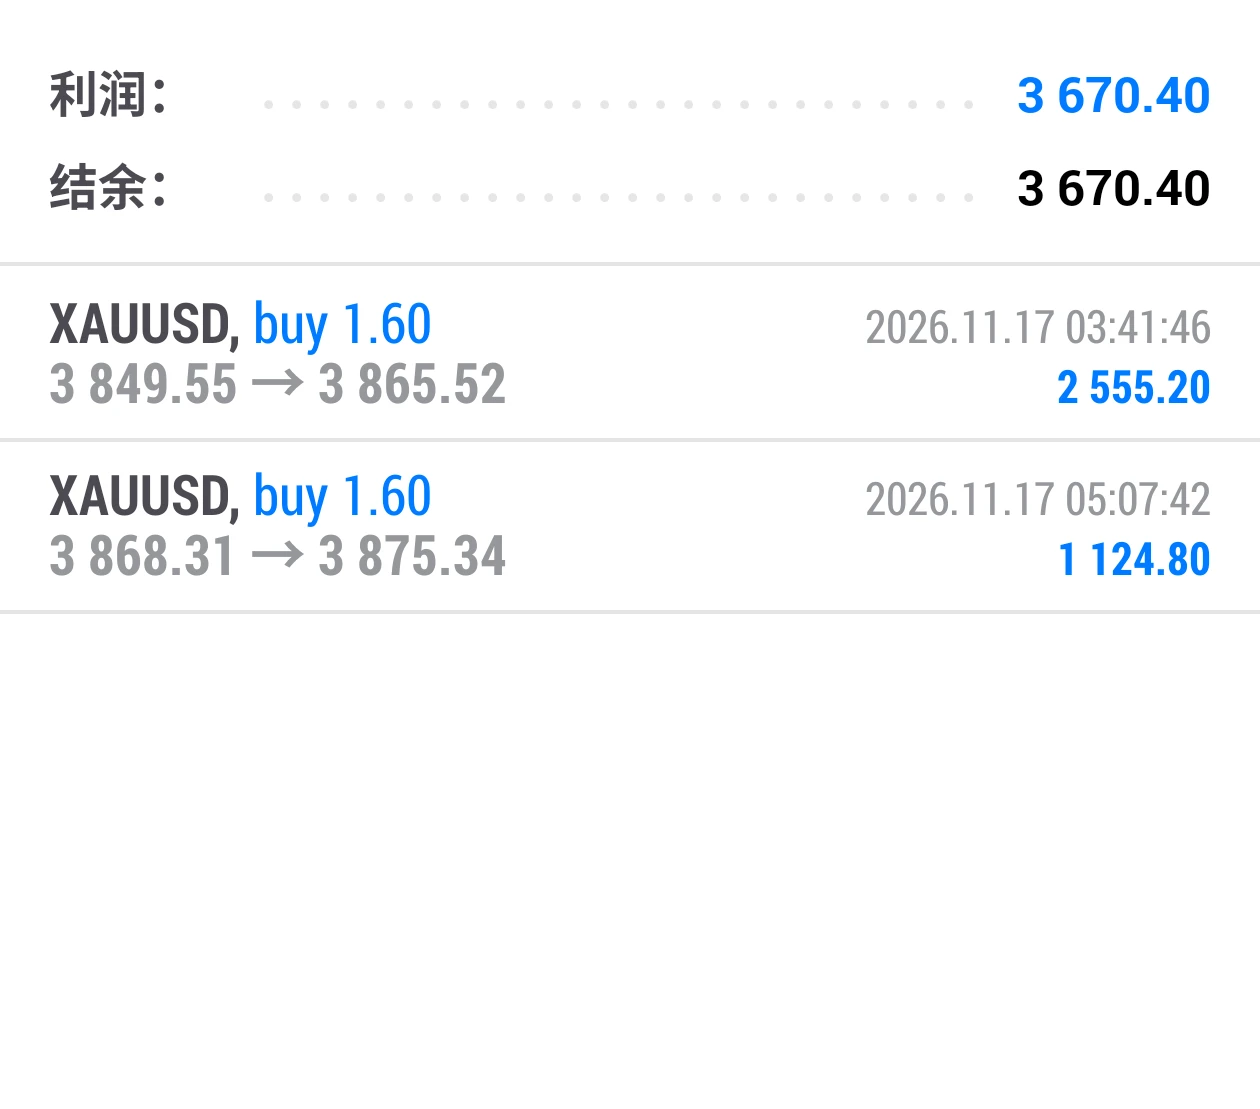
Two wins in a row intraday! Long at 3868, exited at 3875, capturing a $7 move and $1124!
$ETH $XAU #黄金 #Strategy增持485枚BTC
post-image
ETH-1.23%
XAU+0.38%
Backpack Securities is bringing Anthropic’s tokenized stock ANT to Solana in sync with its first day of Nasdaq trading, allowing on-chain capital to participate in IPO pricing for a leading AI company. Backpack launched its securities brokerage platform in June and has already brought SEC-registered stocks into centralized trading; in September, tokenized stocks generated 73% of issuer-level DEX trading volume with just 5% of the supply.
The key is “synchronization”: from day one, the stock can be exchanged between traditional brokerages and Solana, with the tokenized shares tracking the I
post-image
SOL-0.77%
Yesterday I said if it bounced to 66,100–66,500 and couldn't break through, I'd try a small short. It only reached 65,683, falling short and never giving me the entry. But the 64,000 level below did get hit first; the 8 p.m. candle dropped to a low of 63,908, and I closed the position I needed to take profits on without chasing it and adding to the short.

Then it rallied again, reaching 65,683 at 10 p.m. and retesting 65,537 at 6 a.m. this morning, still failing to break Sunday's rebound high of 66,127. It's around 64,700 now. ETH hit a low of 1,787 overnight and a high of 1,866, and is aroun
BTC-0.65%
ETH-1.23%
SOL-0.74%
market update
live-cover
LIVE2,040
11.17 ETH Silk Road
$ETH
【Market Analysis】
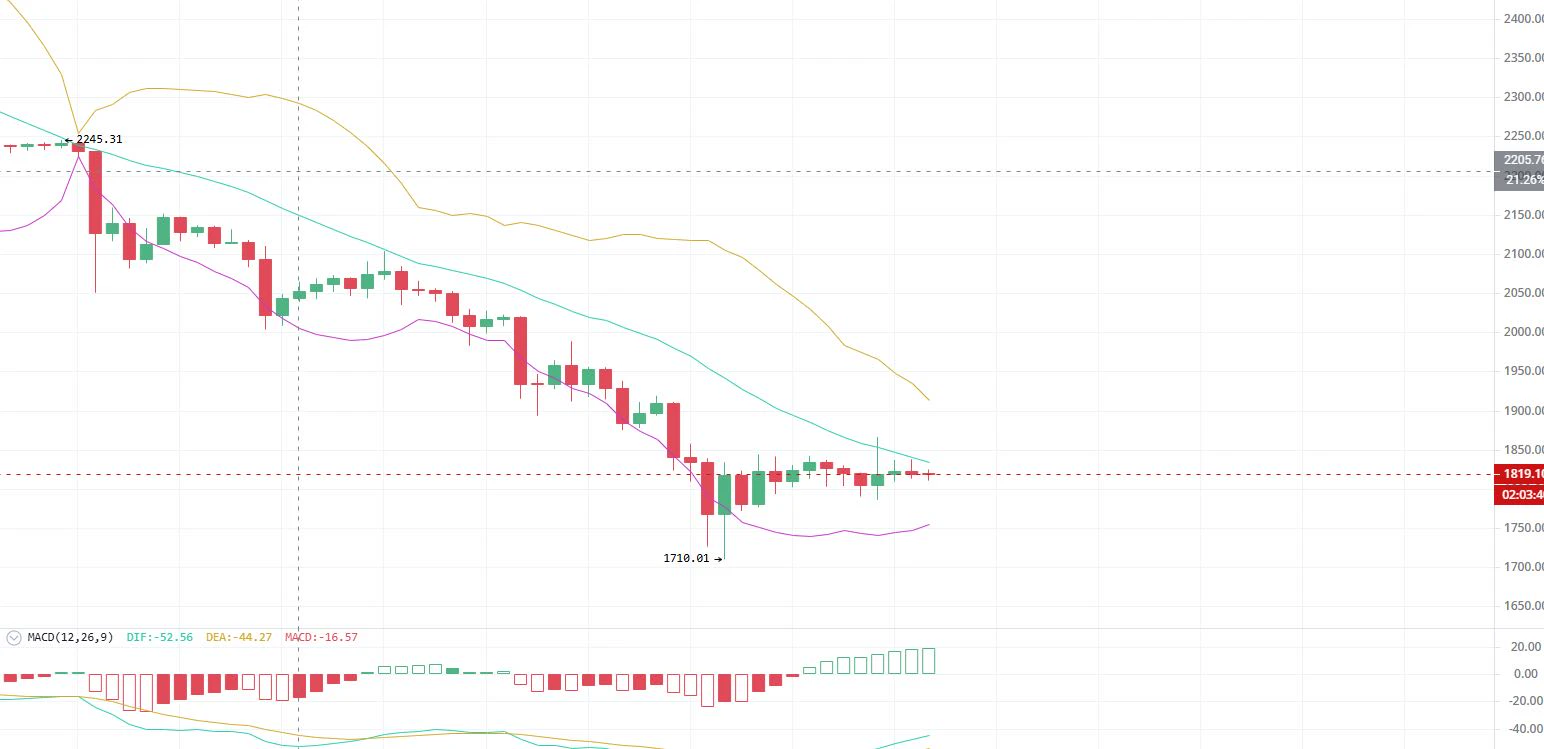
The market began a swing decline from the high of 2449.95. The Bollinger Bands have continued to fan downward, with the price remaining below the middle band and under pressure, indicating a clear bearish trend structure. After previously dipping to a low of 1710.01, the price found support and stabilized, then entered low-level consolidation and recovery. The MACD turned upward below the zero line, and bearish momentum has eased somewhat, indicating low-level consolidation and recovery following the decline. The rebound has not yet reclaimed the Bol
post-image
ETH-1.23%
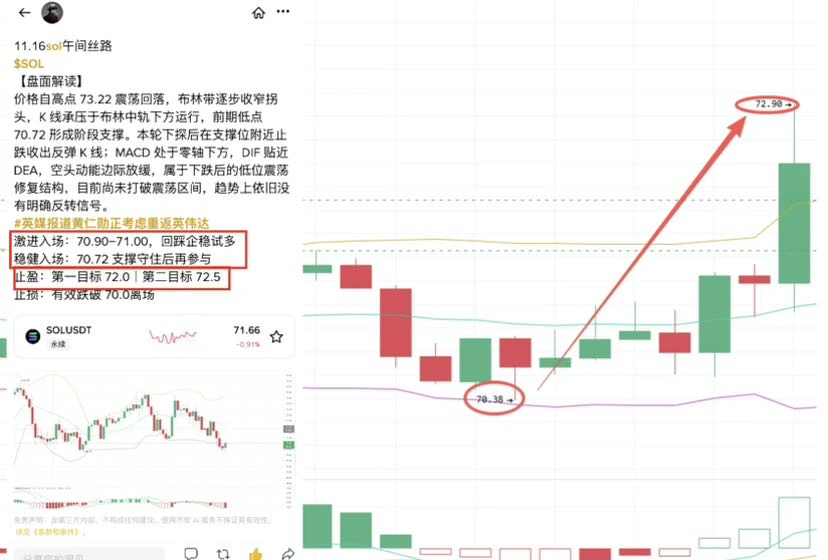
$SOL sol, Silk Road’s call yesterday at noon was spot-on. That entry level was like drawing the K-line😂, with the high reaching 72.9 and all targets hit. The entry zone was rock-solid too—no chasing highs or buying dips. Doesn’t this steady approach get you interested?#纳指跌近2.5%闪迪跌逾8%
post-image
CryptoMarketKingLuffy
11.16 SOL Midday Silk Road
$SOL ‌
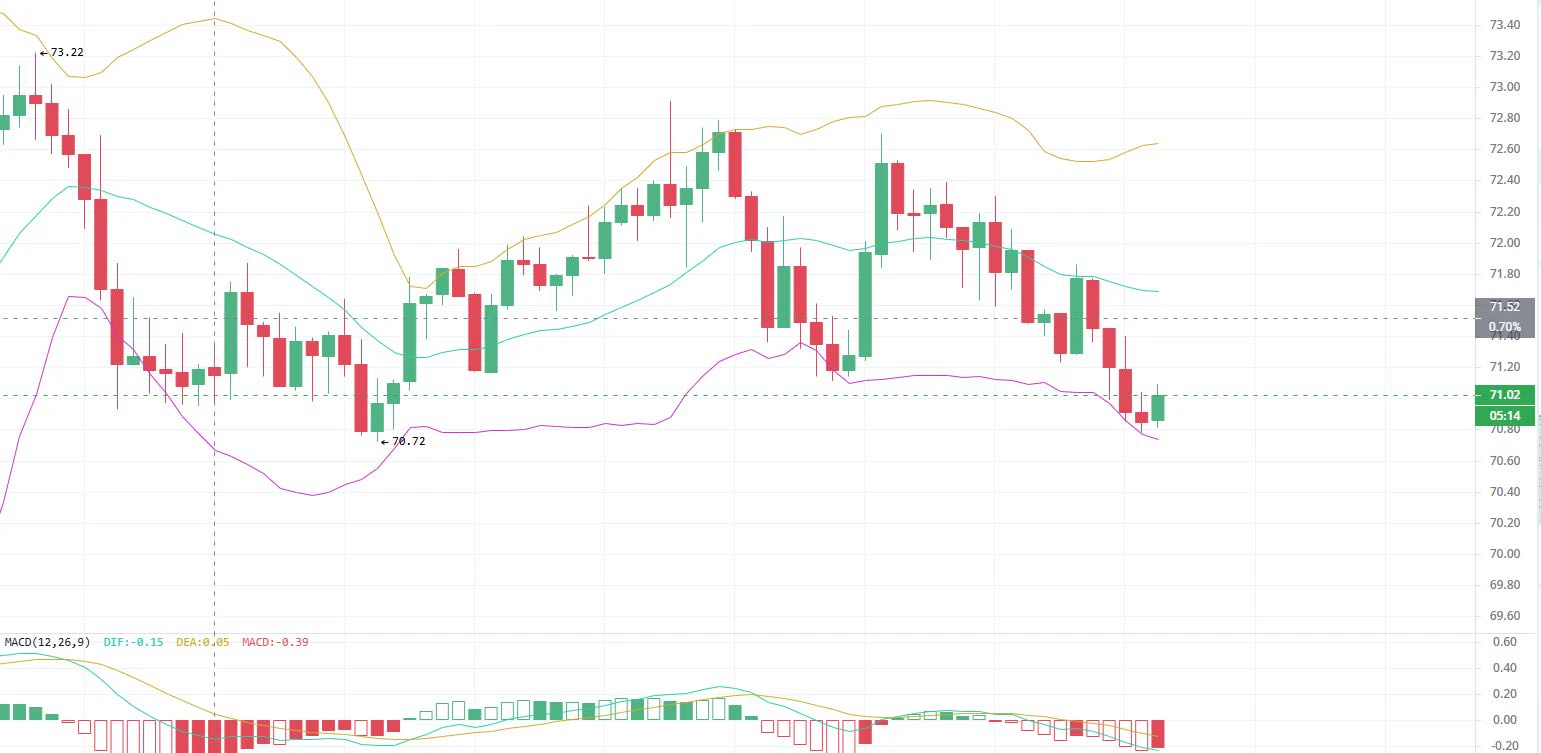
【Market Analysis】
Price pulled back in a choppy manner from the high of 73#Gate直通IPO第三期Anthropic .22. The Bollinger Bands gradually narrowed and turned downward, with the candles trading under pressure below the middle band. The previous low of 70.72 is acting as near-term support. After this dip, price found support and printed a rebound candle near the support level. MACD is below the zero line, with DIF close to DEA; bearish momentum is easing marginally. This is a low-level consolidation and recovery structure following the decline. The range has not yet been broken, and there is still no clear trend reversal signal.
Aggressive entry: 70.90–71.00, go long on a pullback that stabilizes
Conservative entry: Participate only after 70.72 support holds
Take profit: First target 72.0|Second target 72.5
Stop loss: Exit if price decisively breaks below 70.0
repost-content-media
SOL-0.74%
$ETH Yesterday morning, the ETH trading plan called for an entry at 1840, with the first target at 1780, which was missed by just 6 points. This move still has 54 points of downside potential, so it’s not too late to enter. It rallied in the evening, reaching a high of 1866, but failed to hold. We’re still bearish today; if the price stabilizes at the middle band on the 4-hour chart, we’ll look to go long.#Gate直通IPO第三期Anthropic
post-image
CryptoMarketKingLuffy
11.16 ETH Silk Road
$ETH
【Market Analysis】
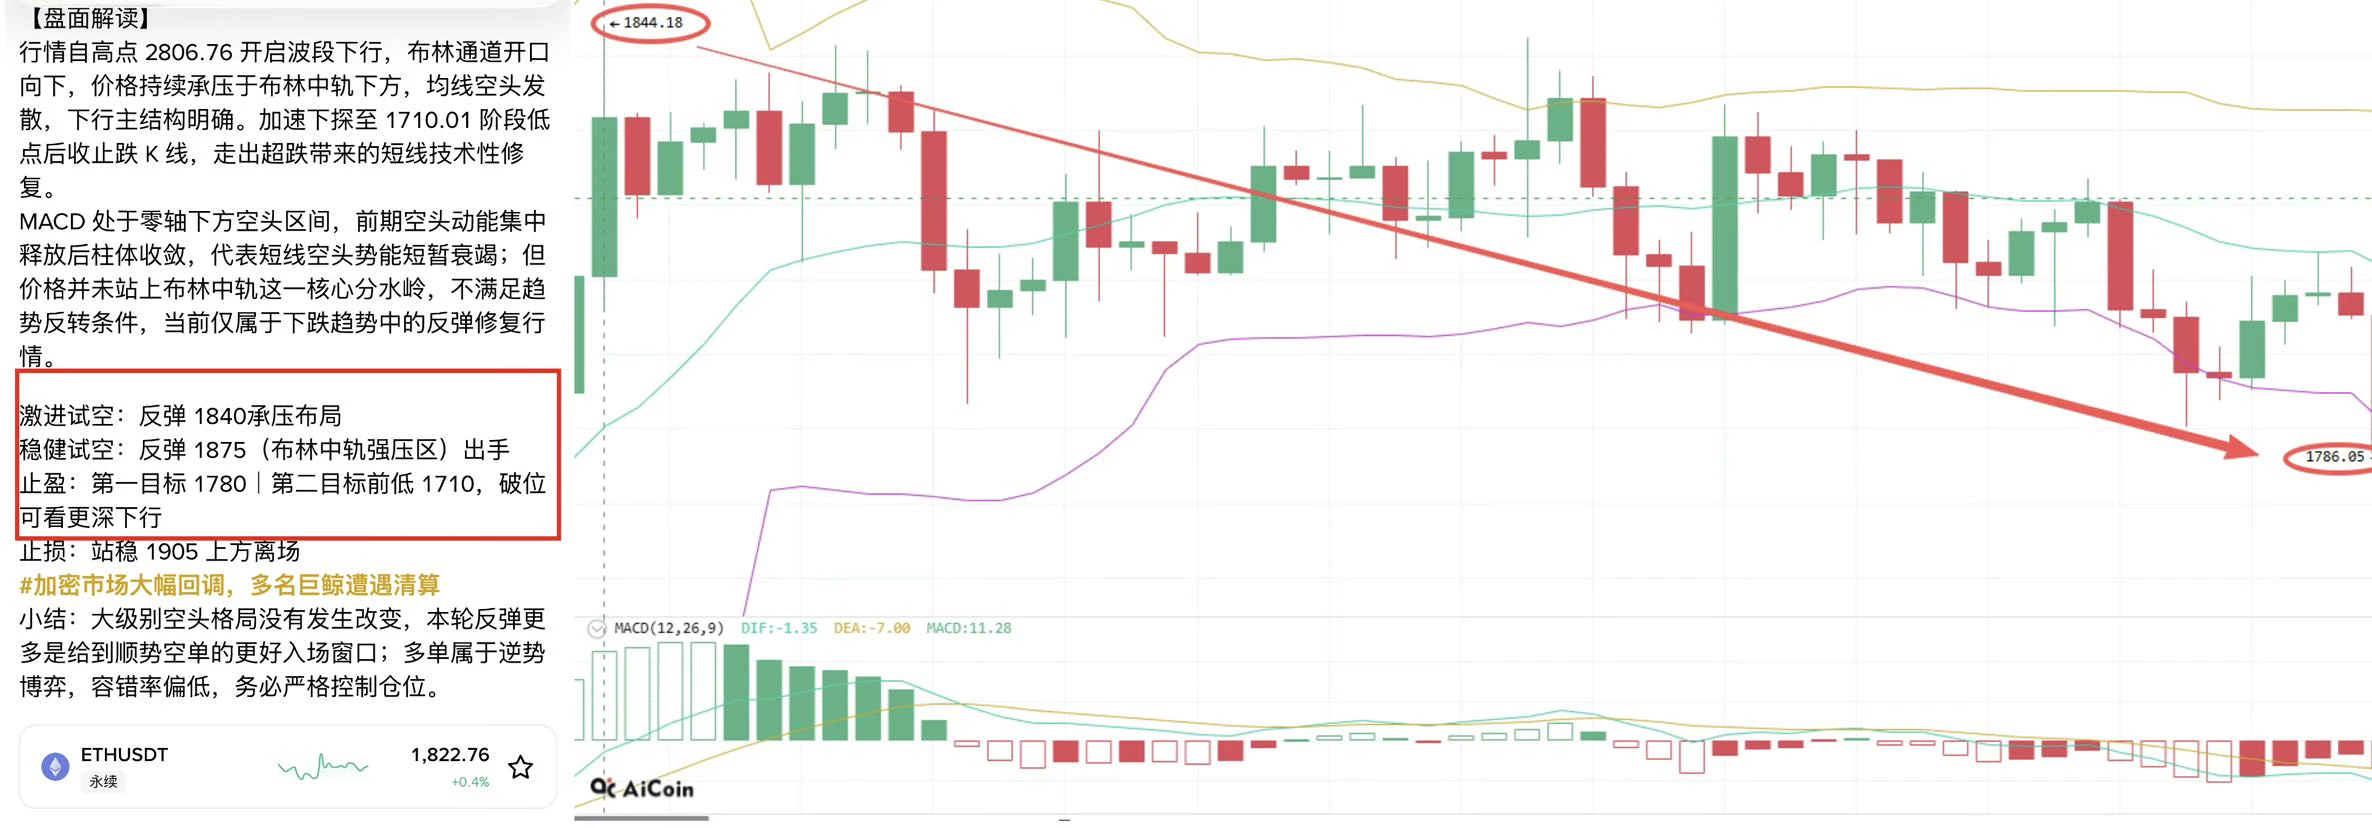
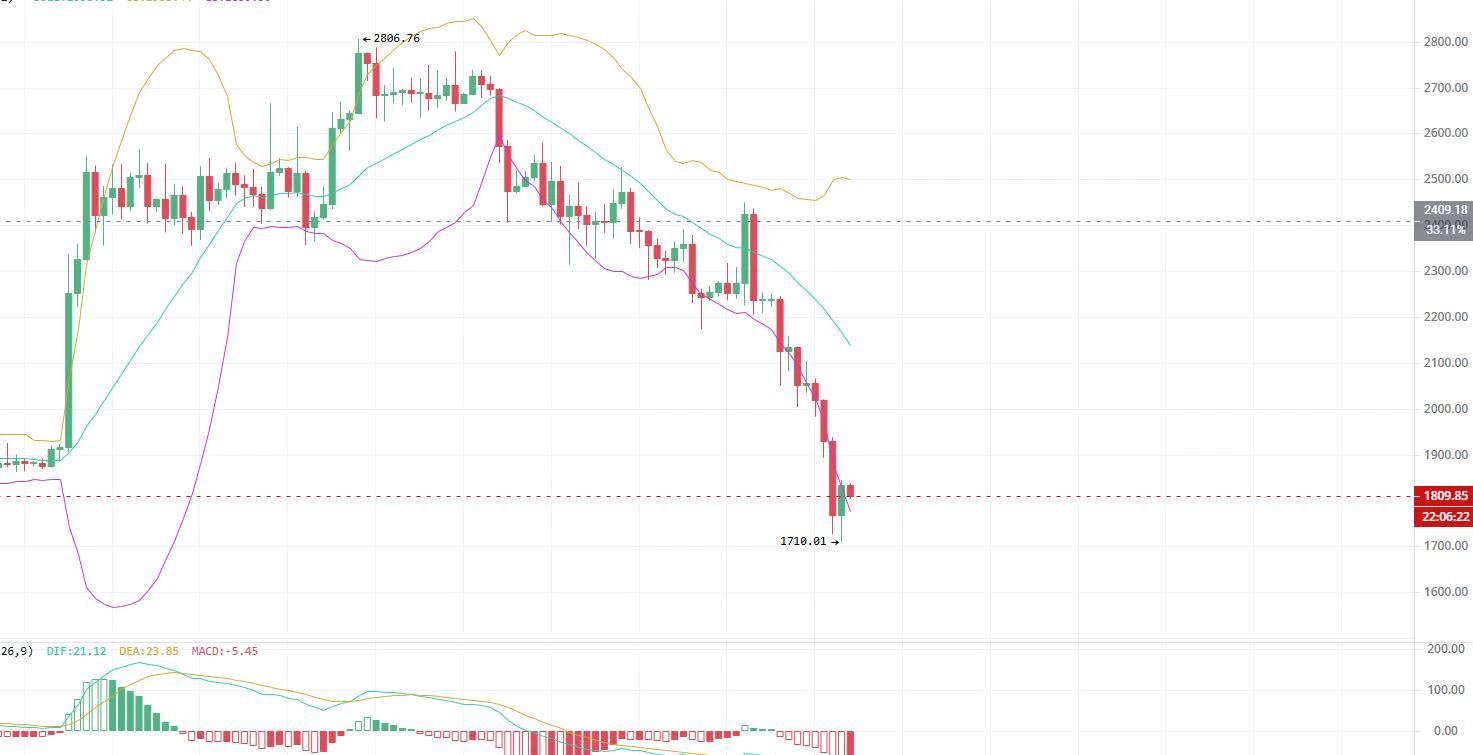
The market began a downward swing from the high of 2806.76. The Bollinger Bands opened downward, with the price remaining under pressure below the middle band. Moving averages spread in a bearish alignment, confirming a clear primary downtrend. After accelerating lower to a swing low of 1710.01, the price formed a candlestick signaling that the decline had stalled, prompting a short-term technical recovery after becoming oversold.
MACD remains in bearish territory below the zero line. After bearish momentum was concentrated and released earlier, the histogram contracted, indicating a brief exhaustion of short-term bearish momentum. However, the price has not reclaimed the Bollinger middle band, a key threshold, so trend reversal conditions have not been met. The current move is merely a rebound and recovery within the downtrend.
#BTC跌破关键支撑市场陷入极度恐慌
Aggressive short entry: Set up a position if the rebound faces resistance at 1840
Conservative short entry: Enter on a rebound to 1875 (strong resistance zone at the Bollinger middle band)
Take profit: First target 1780 | Second target: previous low of 1710; a breakdown could open the way for a deeper decline
Stop loss: Exit if the price holds above 1905
Summary: The broader bearish structure remains unchanged. This rebound offers a better entry window for trend-following shorts; long positions are countertrend bets with little margin for error, so position sizes must be strictly controlled.
repost-content-media
ETH-1.23%
$ICP vs $XRP 👀

XRP spent nearly four years inside a symmetrical wedge before its historic 2017 breakout, rallying from $0.0053 to $3.30.

Now ICP is showing an interesting long-term setup.

After almost five years in a falling wedge, ICP broke out in September 2026. Meanwhile, its monthly MACD has been printing green bars since March.

I'm not saying ICP will repeat XRP's performance, but could we see $100 $ICP in 2027?

That's roughly a $55.9B market cap.
ICP-1.14%
XRP-1.15%
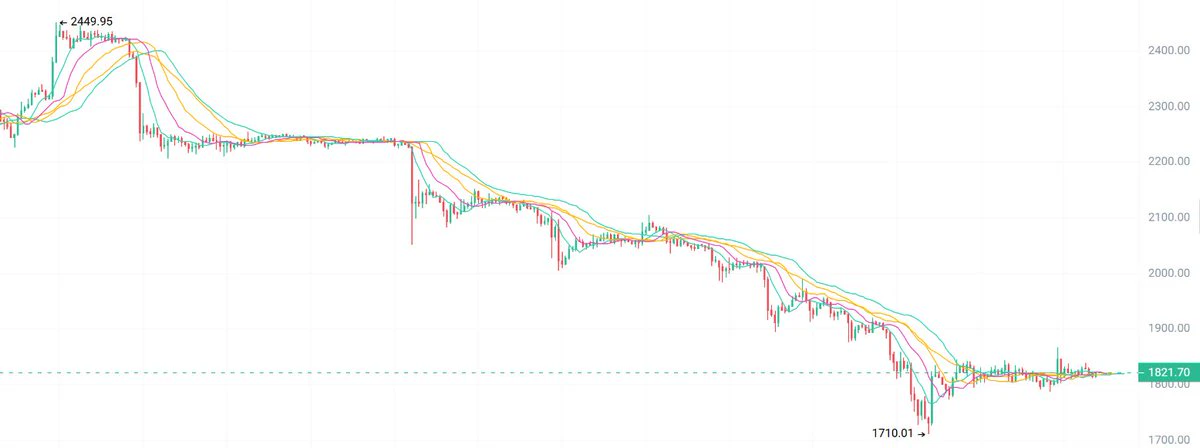
11.17 ETH is facing resistance on its rebound near 1850, with targets at 1780/1720.
For those looking to go long, wait for it to stabilize around 1720–1750 before entering. Set 1690 as your stop, with targets at 1800/1850.
On the 1H chart, ETH has steadily declined from a high of 2449, with a low wick at 1710. It is now consolidating and recovering around 1821, and the moving averages are gradually converging. However, the overall bearish structure has yet to reverse. 1850/1880 are short-term resistance levels; watch closely to see whether price can hold above them. $ETH #ETH
post-image
ETH-1.26%
Load More

Join 40 M users in our growing community

⚡️ Join 40 M users in the crypto craze discussion

💬 Engage with your favorite top creators

👍 See what interests you

Trending Topics

GateIPOAccessAnthropic

434.4K Views3.1K Discussing

Gate IPO Access Phase 3 features Anthropic (ANT), with USDT subscription interest starting from 100 USDT. Successful allocations will be delivered as real shares to Gate Stock Accounts. Indicative price: $70–$78/share Subscription: Nov 12–17 (UTC+8) Allocation is not guaranteed. Please manage risk accordingly.

Dr.HanOxfordUnionSpeech

328.3K Views1.7K Discussing

ANTPreMarketFuturesNowLive

358.5K Views3.6K Discussing

View More