Square
Following
Hot
News
Notifications
Profile
Share your thoughts
placeholder
Article
#SNDK
SNDK at $870: Is SanDisk Preparing for a Powerful Recovery or Another Major Correction?

SanDisk (SNDK) is approaching an important technical and psychological price zone around $870. After experiencing significant volatility, investors are now watching whether the stock can stabilize, attract fresh buying pressure, and recover its previous momentum. The bigger question is whether SNDK can return toward $1,000, $1,200, or even higher levels, or whether sellers will push it toward another support zone.

At approximately $870, my view is that SanDisk deserves close attention, but traders
SNDK-5.58%
MU-2.56%
SK Hynix-5.18%
SKHY-4.39%
The prompt says not to be overly polite, but the first line of the final draft is still “Hello.”
When reviewing an AI draft, the most common sticking point isn’t the facts, but the tone. You say not to preamble, summarize, or ask rhetorical questions, yet it still leads with a polite half-sentence that pushes back what it really needs to say.
【You change the wording, but miss the constraint】
The shortest prohibition in a prompt is often the first thing the next generation forgets. So reviewers start revising the same kind of opening, until they sound polite themselves.
【Memory is on, but const
post-image
Trenches
mihao
m
bade
b
mihao
4Cxj...pump
Market Cap
$.
Change
.
24h Vol
$.
Holders
.
bill
b
bade
b
bill
85Rh...pump
Market Cap
$.
Change
.
24h Vol
$.
Holders
.
rockstar
r
bade
b
rockstar
9HFU...pump
Market Cap
$.
Change
.
24h Vol
$.
Holders
.
PIEVERSE
P
bade
b
PIEVERSE
0x0e...25a9
Market Cap
$.
Change
.
24h Vol
$.
Holders
.
Socks
S
bade
b
Socks
FS1p...pump
Market Cap
$.
Change
.
24h Vol
$.
Holders
.
11.16 Qiqi Gold Commentary Morning Review: Rapid early-session rally moves above the key level; resistance on the rise—watch for a pullback!

The market surged rapidly early in the session, with gold moving directly above the 3900 level. Short-term buying was concentrated, but momentum eased somewhat after the climb, and the market entered a brief consolidation.

The sustainability of this impulsive rally is questionable, and a sharp rise can easily bring profit-taking.

Trading strategy: Resistance is in the 3908-3918 zone. If a rebound reaches this area, consider scaling into short positions
post-image
XAU+0.38%
At 10 this morning, the computing power of about 64k $BTC mining machines was quietly hijacked and redirected entirely to the OCEAN mining pool, with the payout address also changed to the attacker’s own. By 11:10, the hijacked computing power had peaked at 14.2 EH/s, about 1.5% of the network total.
I found the address in OCEAN’s public data: it accounted for 28.37T shares during the reward window, or 2.63% of the pool’s total. If fully paid out, that would amount to about 0.65 BTC, worth approximately $42k at current prices. Split across 64k machines, that’s less than $0.7 per machine—and n
post-image
BTC-0.67%
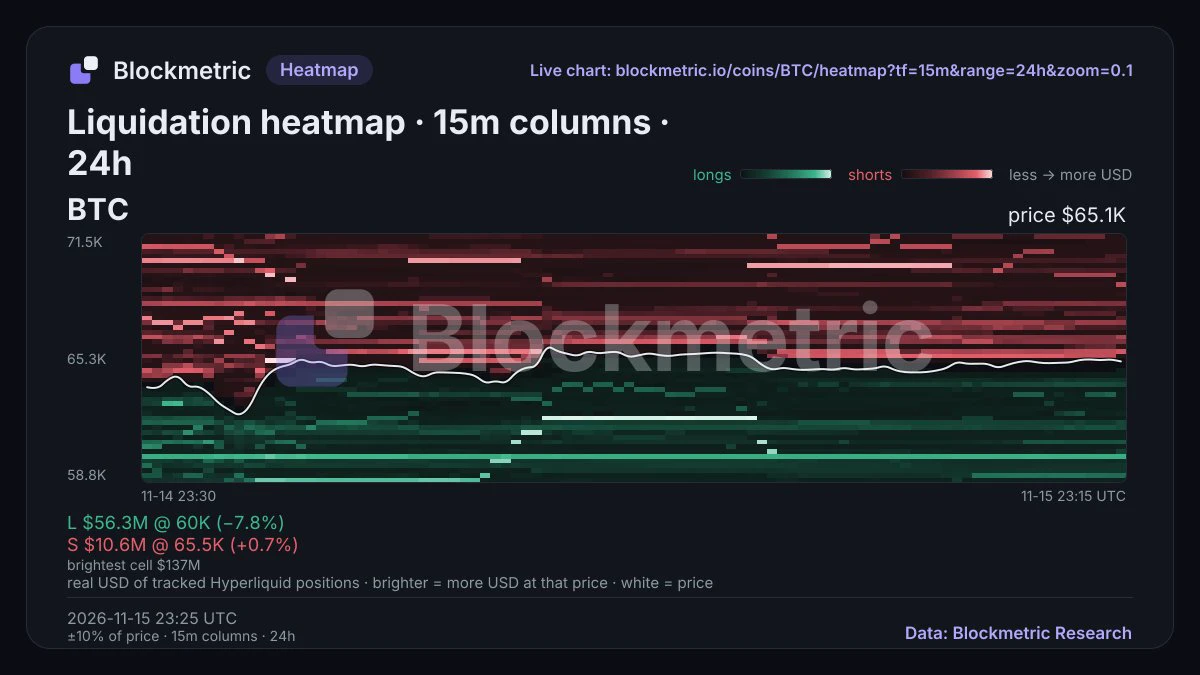
🚨 Guys, yesterday’s BTC wick was fucking brutal!
It plunged straight to a low of $61,956!
Then, within a few hours, it climbed back to around $65,000.
A lot of people are already starting to say:
“The bottom is in!”
I’d tell everyone not to rush to that conclusion.
I went back over the daily chart, liquidation map, and the entire structure of this downtrend.
There are a few levels I’m laying out in advance today.
First, why did BTC suddenly bounce near $61,900 yesterday?
In the previous leg, BTC rose from around $57,500 to $87,300.
A deep retracement of that entire uptrend:
Put $61,300 near a
post-image
BTC-0.67%
  • 4
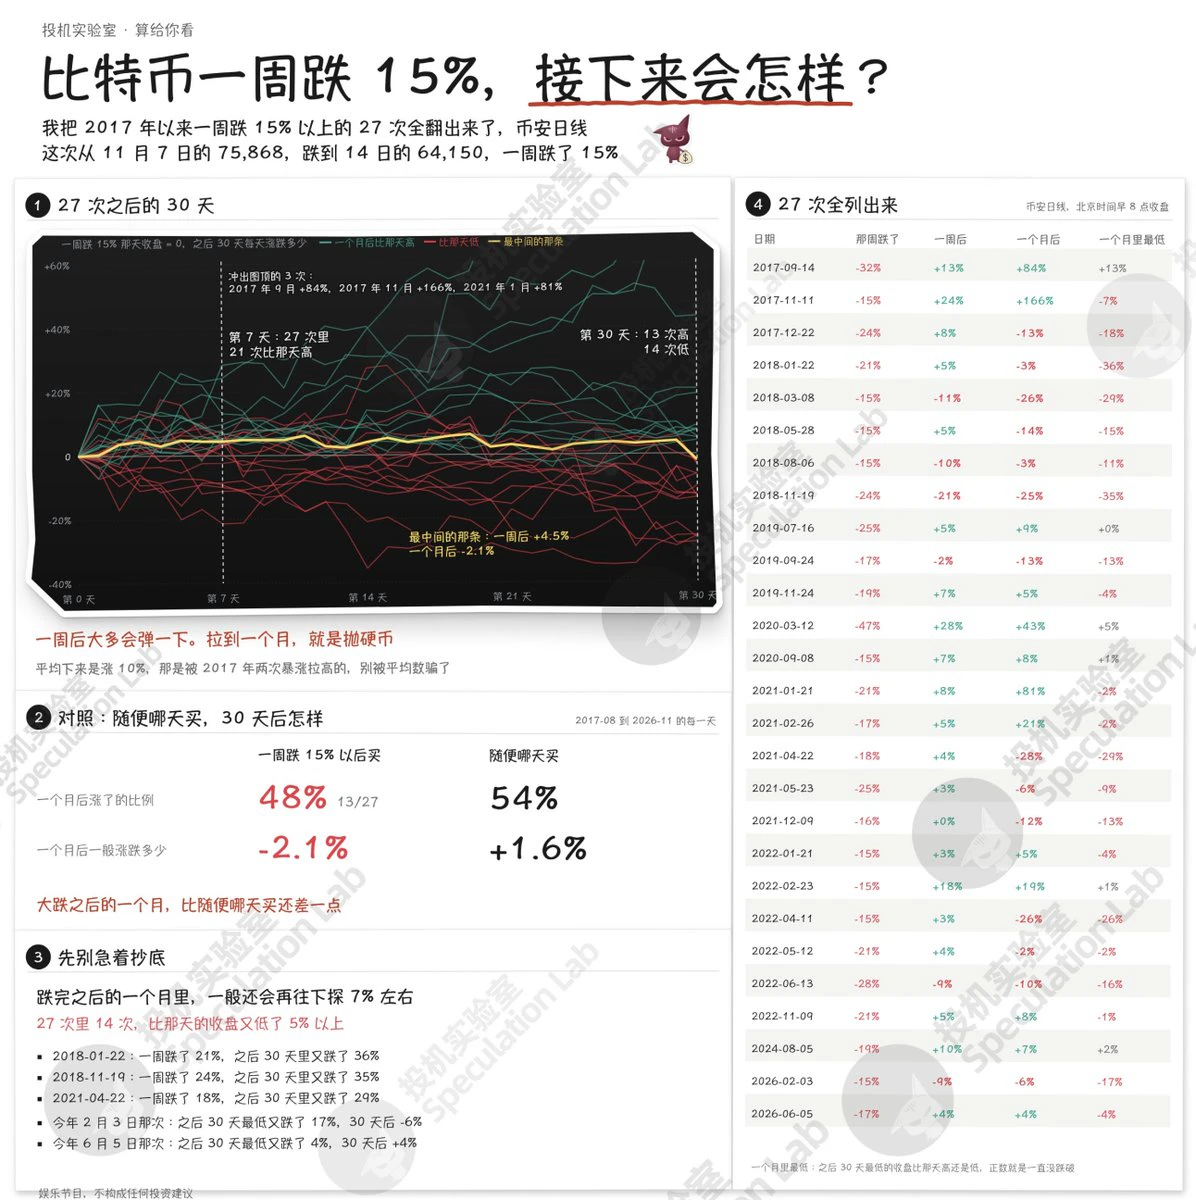
Bitcoin fell 15% this week. Since 2017, there have been 27 weeks with drops this large; buying after the drop and holding for a month resulted in roughly an even split between gains and losses🤔
Bitcoin fell from 76,000 to 64,000 this week. I went through every week since 2017 when it dropped more than 15%—27 in total.
In the following week, it rebounded 21 times, usually by a few percentage points.
But if you bought after the drop and checked again a month later, only 13 of the 27 times were profitable, while 14 were losses. In other words, buying the dip after a sharp drop gives you only a 4
post-image
BTC-0.67%
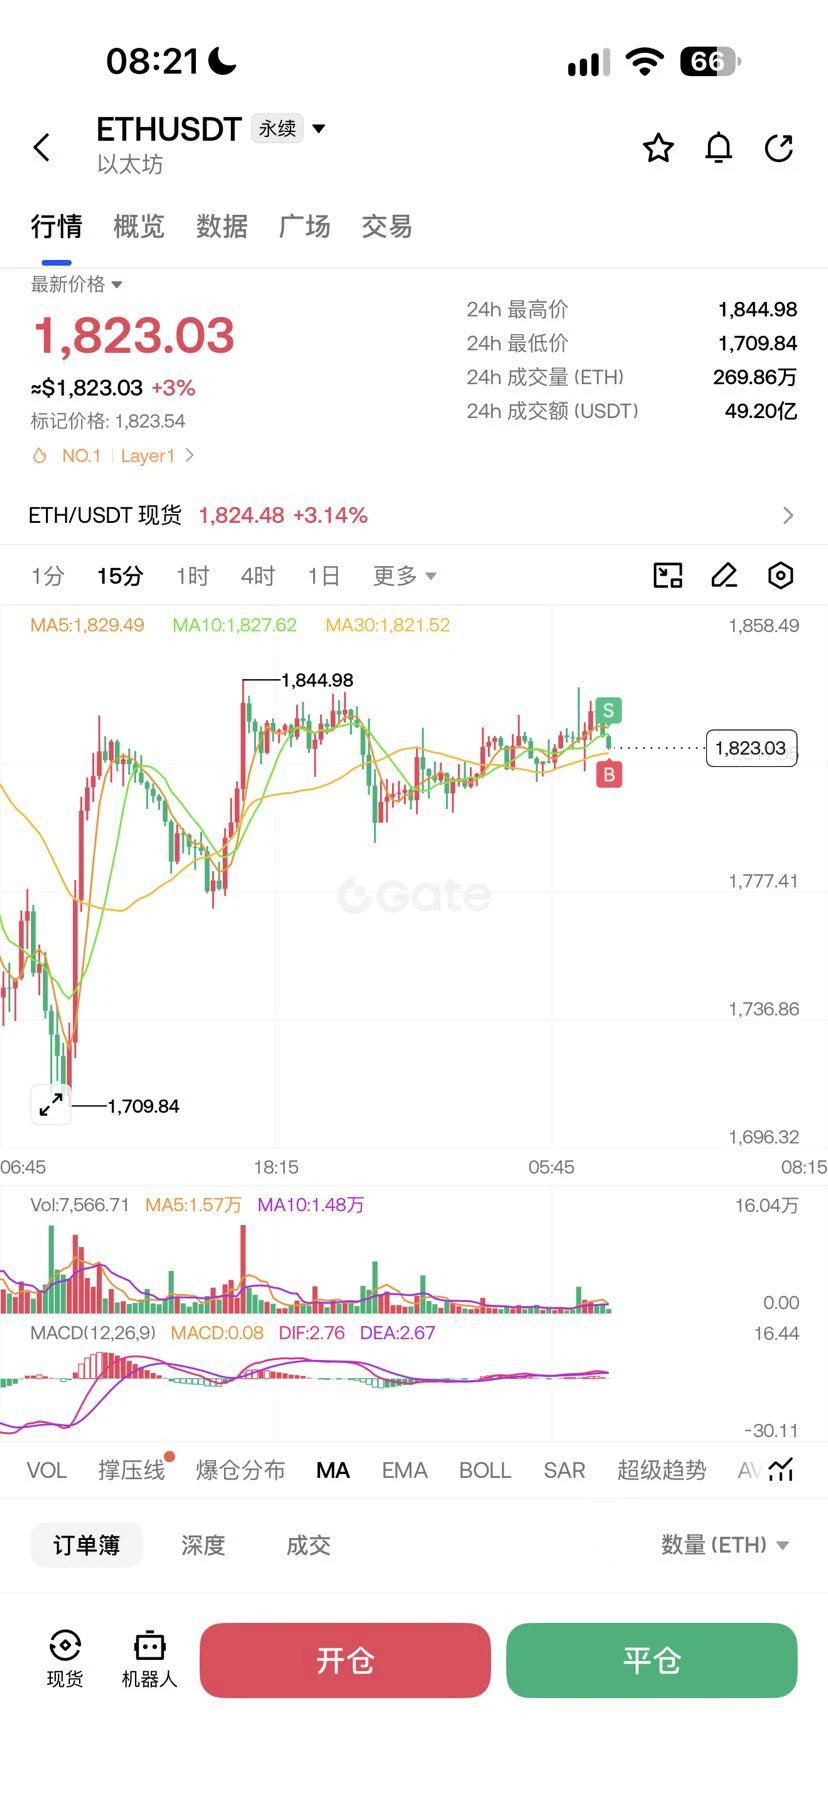
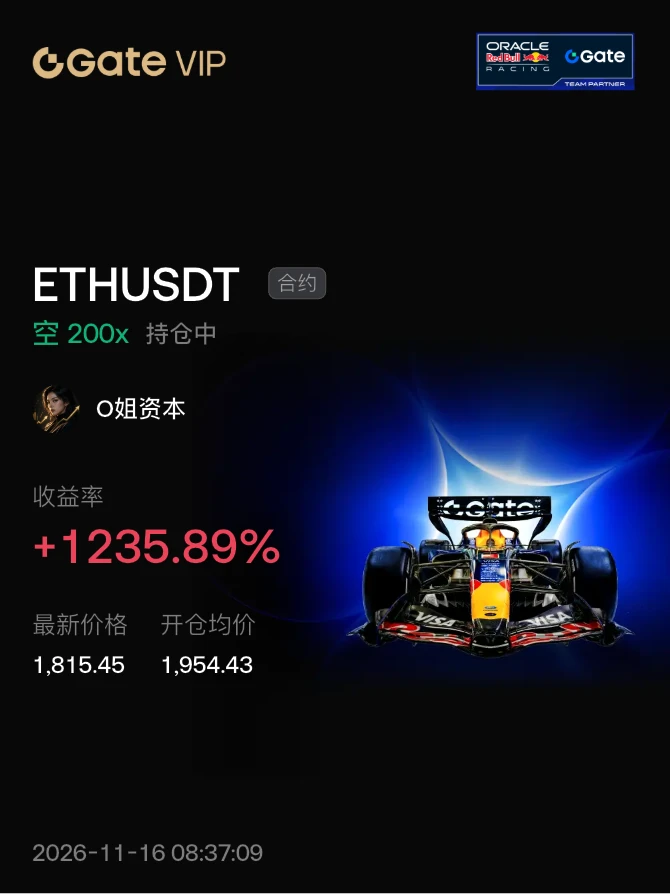
$ETH Short one lot of ETH near the current price of 1825, with a take-profit target around 1770–1880 and a stop-loss at 1860. For intraday trading, focus mainly on short positions and aim to capture a swing.#美国初请失业金人数高于预期 #Dr.Han牛津辩论社演讲
post-image
ETH-1.23%
2026.11.16 Bitcoin drops on heavy volume; short the rebound, while Ethereum continues to show divergence, rallying sharply before pulling back
ETH-1.26%
  • 1
  • 3
$SKR A sharp rise followed by a strong crash; go short quickly, target 0.010–0.0095, and welcome to the ranks of sellers.
post-image
SKR-3.71%
SOXL USDT MARKET UPDATE PREDICTION
live-cover
LIVE1,488
#晒出我的持仓收益 ETH, the second-biggest coin, looks very close to that level now—that resistance. The two accounts on my following list are live
post-image
ETH-1.23%
On November 16, Bitcoin closed, and we can now see that it touched the trendline and found support without breaking below it. The market rebounded, so we can breathe a little easier. From here, the plan is to look for a bounce around this level.

Of course, even if it bounces here, a direct reversal is unlikely. After it moves up, continue to approach the market from a short-selling perspective until a breakout from the daily chart pattern forms; only then might a reversal be possible. If it breaks below this level again, the market will need a deeper correction.

For those holding spot positi
BTC-0.67%
  • 1
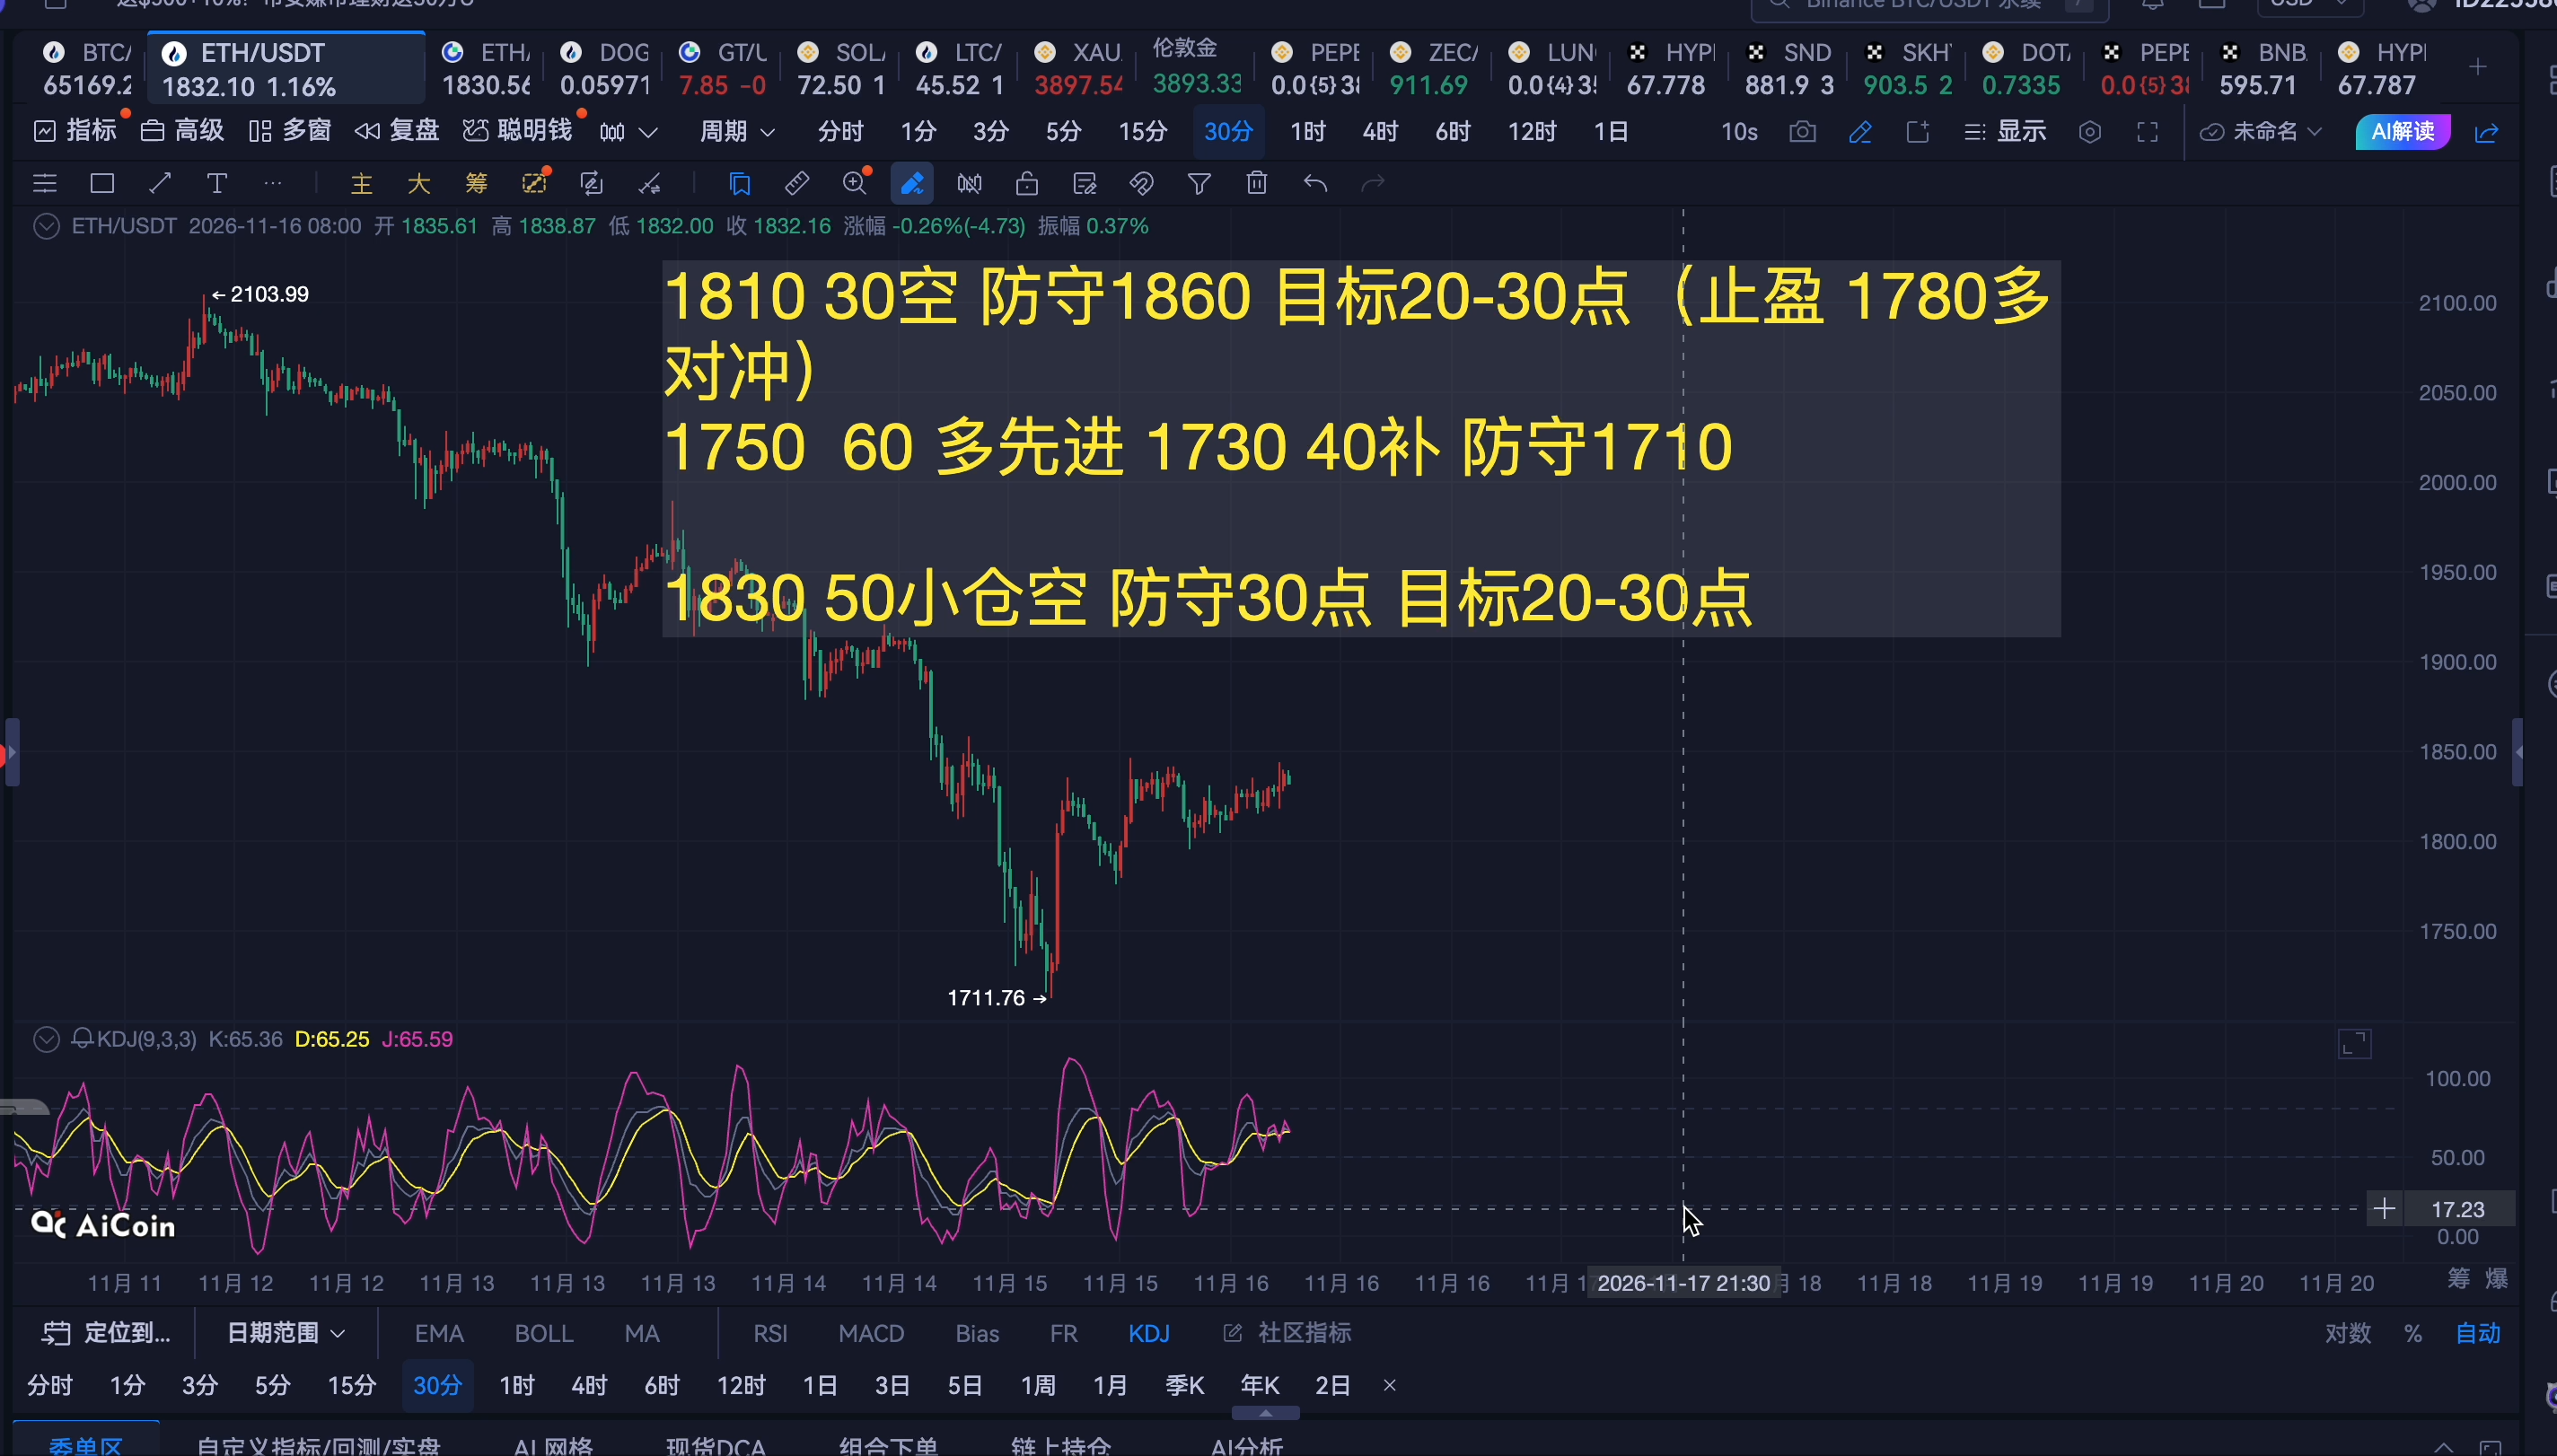
|ETH Short-Term Strategy

Timeframes: 1H for direction · 15M for candlestick patterns · 1M for entry

Current price: 1818.22|Pivotal level: 1811.45

✅ Long: Go long if price pulls back to 1811–1802 and stabilizes; target 1835–1845, stop-loss below 1796

❌ Short: Go short if a rebound to 1835–1845 meets resistance; target 1811–1802, stop-loss above 1852

Profit/loss target: $20–30

Key levels: Support 1802 / 1811|Resistance 1835 / 1845

Note: 1H pulled back after reaching a high of 1847; 15M is moving weakly sideways near 1818, with frequent wicks. Always use a stop-loss

|ETH Medium- to Long-T
ETH-1.26%
$172 million and $577 million: ETH’s next move hinges on these two figures

After ETH fell below $2,000, the two things heard most often in the market were “it’s oversold and due for a rebound” and “it’s going to $1,500.” Both takes are too simplistic. What’s really worth watching are the liquidation levels already on the table in the leveraged market.

Coinglass data is specific: if ETH falls below $1,722, cumulative long liquidation intensity on major CEXs will reach $577 million. Conversely, if ETH breaks above $1,902, cumulative short liquidation intensity on major CEXs will reach $530 mil
ETH-1.23%
CRYPTO MARKET TREND
live-cover
LIVE2,589
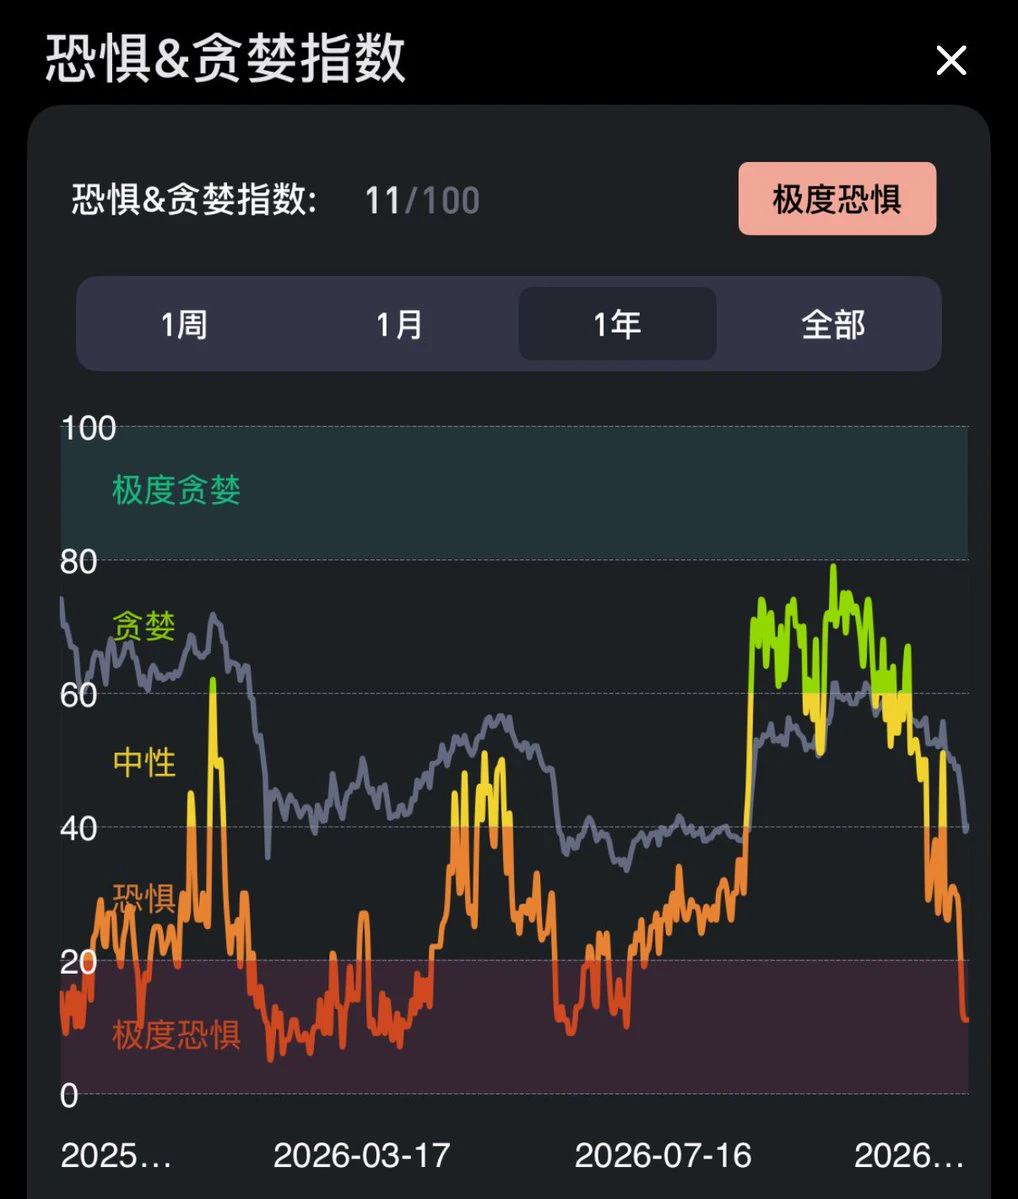
Never sell your precious holdings out of panic
A Wall Street saying: “Greed and fear are evolutionary flaws etched into human genes. Discretionary traders are most likely to sell at a loss during crashes and frantically chase highs during rallies.”
post-image
$SKR Up 27% in a day. The wildest move was the morning low of 0.0086; it’s now at 0.0113, meaning those who bought the dip early are already up 30%+. Trading volume of 5M isn’t huge, which suggests the order book is still thin: it won’t take much buying pressure to push it up, but it can fall just as fast. The price is now hovering near the 24-hour high of 0.0115. At this point, it could either be consolidating before a second push higher or luring buyers in before a sell-off—I’m leaning toward a fake breakout followed by a pullback. After all, when a small-cap token rises this quickly, profit
SKR-3.71%
  • 1
  • 1
I didn’t close my position last night, so I set a small stop-loss. When I woke up, I saw it had all been stopped out. So be it—new week, time to reassess and start again.
I adjusted my copy-trading positions and withdrew some profits. I now have $10,000 in total.
Load More

Join 40 M users in our growing community

⚡️ Join 40 M users in the crypto craze discussion

💬 Engage with your favorite top creators

👍 See what interests you

Trending Topics

GateIPOAccessAnthropic

377.9K Views2.8K Discussing

Gate IPO Access Phase 3 features Anthropic (ANT), with USDT subscription interest starting from 100 USDT. Successful allocations will be delivered as real shares to Gate Stock Accounts. Indicative price: $70–$78/share Subscription: Nov 12–17 (UTC+8) Allocation is not guaranteed. Please manage risk accordingly.

Dr.HanOxfordUnionSpeech

153.9K Views519 Discussing

USOctoberPPIBelowExpectations

493.7K Views1.6K Discussing

View More