Square
Following
Hot
News
Notifications
Profile
Share your thoughts
placeholder
Article
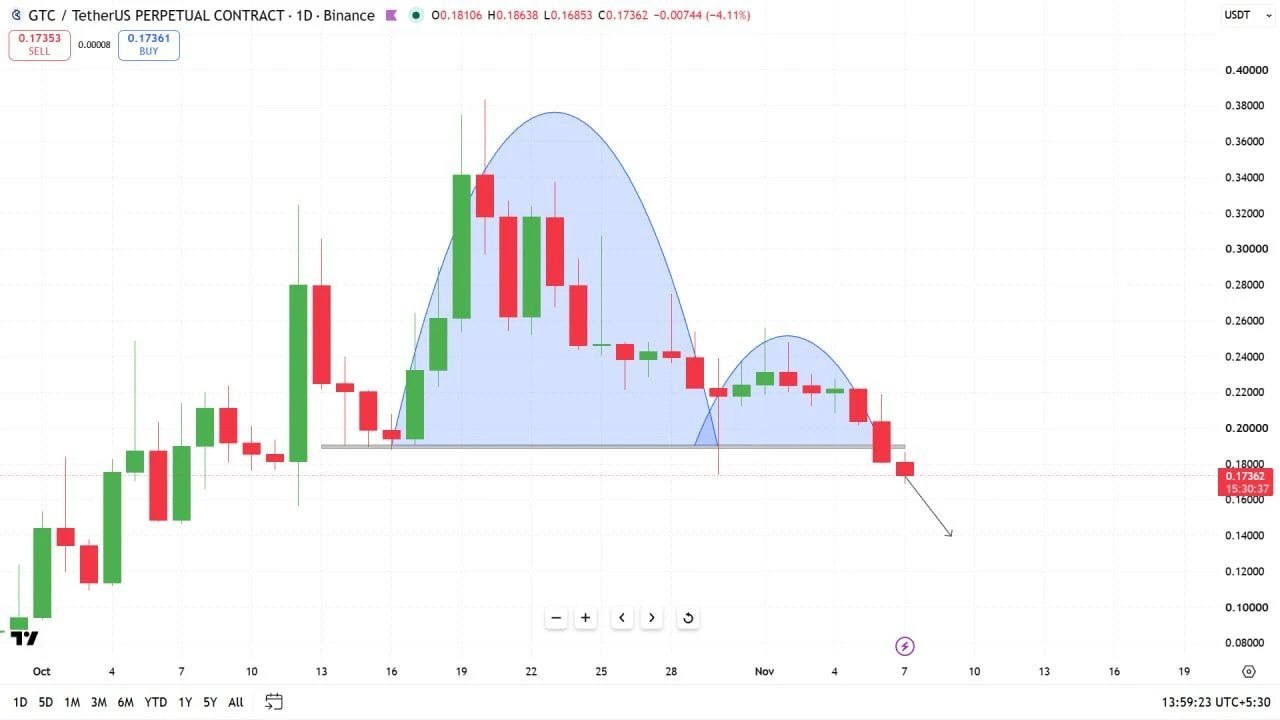
$GTC is showing clear signs of weakness after its recent breakdown.

The previous trading range has collapsed, opening the door for further downside.

Buyers are struggling to defend the price as bearish momentum builds.

Even a small recovery could turn into a trap before another sharp decline.

If demand remains weak, fresh lows could be on the horizon.

$GTC could be heading into a major correction. Stay alert!
post-image
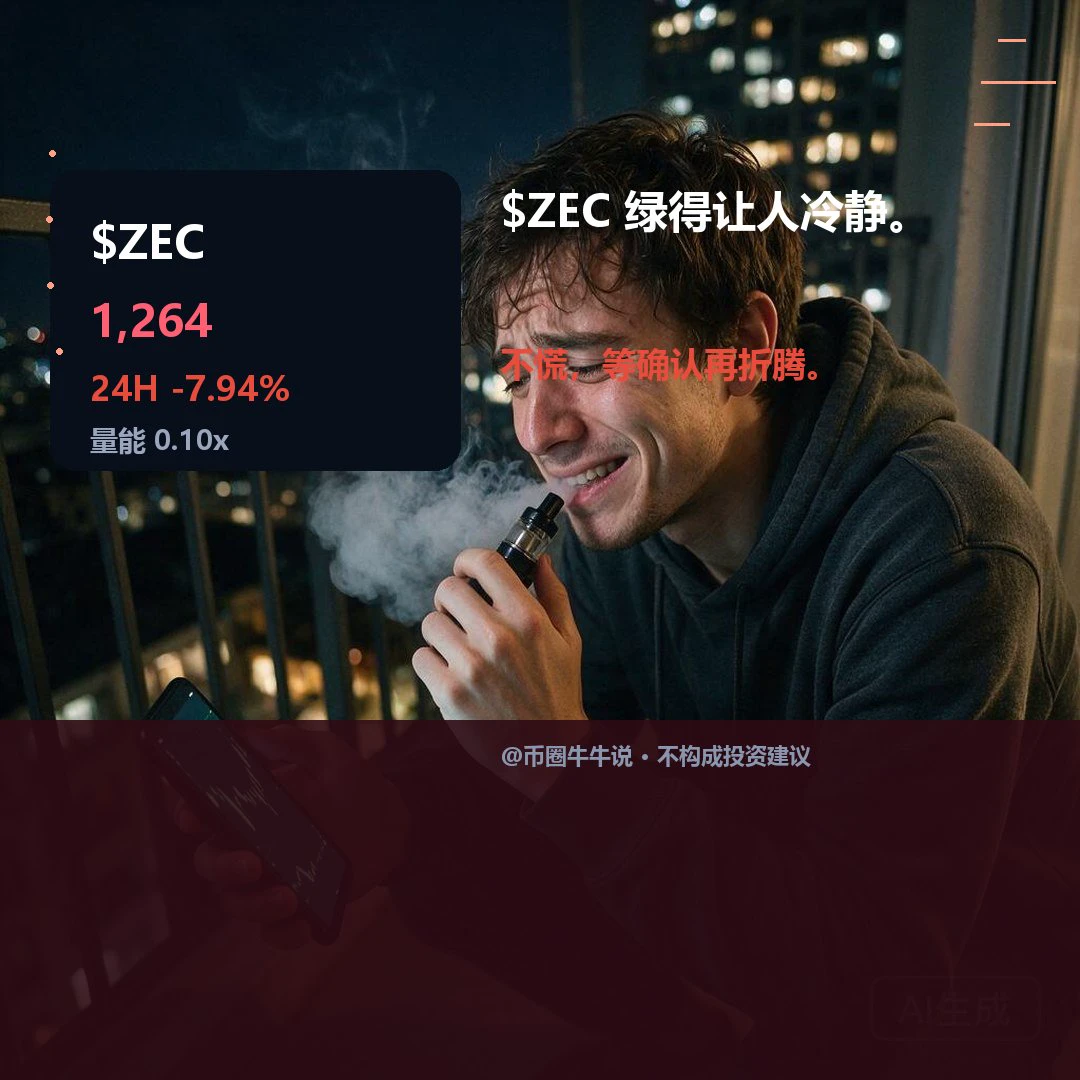
$ZEC Currently at 1264.47, down 7.94% over 24H (range: 1250.67–1374.07). The 1H outlook is weak, with RSI at 18.14, price below EMA20 at 1295.70, and a volume ratio of 0.10; the 4H outlook is weak, with RSI at 41.78 and price below EMA20 at 1286.68. A sustained move above the 1367.59 resistance level could signal further upside; a break below the 1250.67 support level would weaken the structure. In the review, focus on whether price can hold above 1367.59 and whether it can recover after losing 1250.67. Volume is only 0.10x; a low-volume hold above resistance or a break below support without a
post-image
ZEC+1.16%
Trenches
ZIG
Z
bade
b
ZIG
0x8c...1145
Market Cap
$.
Change
.
24h Vol
$.
Holders
.
BTC
B
bade
b
BTC
C5xp...pump
Market Cap
$.
Change
.
24h Vol
$.
Holders
.
scamsem
s
bade
b
scamsem
41Wp...pump
Market Cap
$.
Change
.
24h Vol
$.
Holders
.
IDOL
I
bade
b
IDOL
0x3b...ab07
Market Cap
$.
Change
.
24h Vol
$.
Holders
.
DOGE
D
bade
b
DOGE
DoGE...fm7R
Market Cap
$.
Change
.
24h Vol
$.
Holders
.
After $XRP Has Fallen This Far, What Really Matters Is Not Sentiment

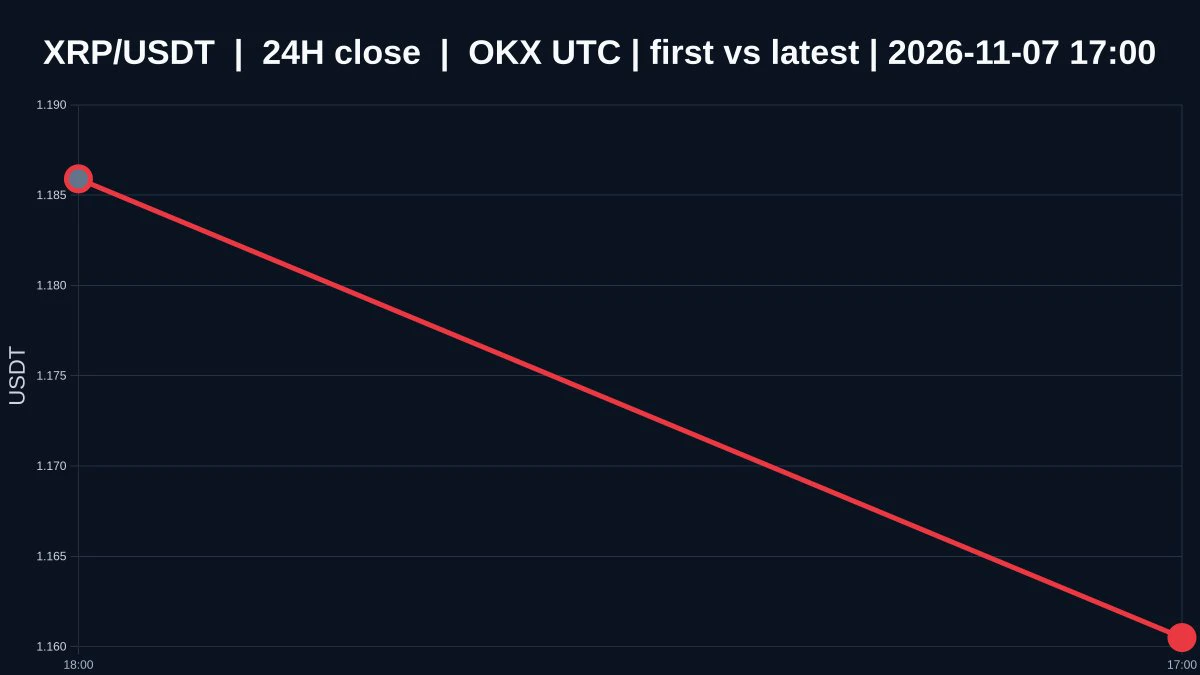
Demand for a rebound has emerged, but I won’t call oversold conditions a bottom until the structure stops weakening. $XRP is currently priced at 1.1614, down 2.7873106219134636% over 24 hours, with an intraday low of 1.1518 and a high of 1.1969. The 1-hour and 4-hour trends are both weak, the volume ratio is 0.012999983166659875, and market participation is extremely low.

A steep decline only shows that selling pressure has occurred. It doesn’t automatically mean the price is cheap, let alone prove that buyers are actually
post-image
XRP-1.15%
BTC/USDT: Critical Support Test – Is Bitcoin Preparing for a Reversal or Another Leg Down?

Bitcoin is trading around $75,707, and the 4H structure remains bearish. Price is below MA5 ($75,905), MA10 ($75,893), and MA30 ($77,337), indicating that sellers still have the upper hand.

Key Support Levels:

- $75,400–$75,500
- $74,850–$74,950
- $73,850–$74,000

Key Resistance Levels:

- $75,900–$76,000
- $76,200–$76,400
- $76,850–$77,000
- $77,300–$77,450

Trading Scenarios:

Bearish: Rejection around $75,900–$76,250 could open downside targets at $75,500, $74,950 and $74,000. A confirmed breakdown
BTC-0.67%
Applicant 24904 in the @torpornet queue. Built to sit.
I just finished translating the ZetaChain governance results
The lopsided vote made me pause for half a second
Proposal 2, also known as on-chain No. 70, passed
About 313.6 million ZETA in favor
A little over 400 against
Approval rate close to 99.99%
Voting ended around 16:12 UTC on November 7
Around December 9
Snapshot and shutdown near block 20755000
Once the L1 stops, it won't restart
ZETA migrates to native Solana SPL at a 1:1 ratio
Same ticker
Minting authority revoked
No third-party bridge
Claim through ZetaHub that day
Link your old wallet to a Solana address by signing a message
No fee
post-image
ZETA-1.29%
SOL-0.77%
$BTC Crypto Market Academician: 11.8 Ethereum (ETH) daily doji + 4-hour bearish alignment: At 2239, bulls and bears are both waiting for the other side to make the first move

  What I really want to say up front is this: The essence of trading is not prediction, but response. At 2239, neither bulls nor bears has an absolute edge. It comes down to who has the tighter stop-loss, the lighter position, and the greater patience. I share updates on key levels and evolving market structure on my Moments every day. I don’t make grand promises or post screenshots boasting 1x returns; I simply share si
BTC-0.65%
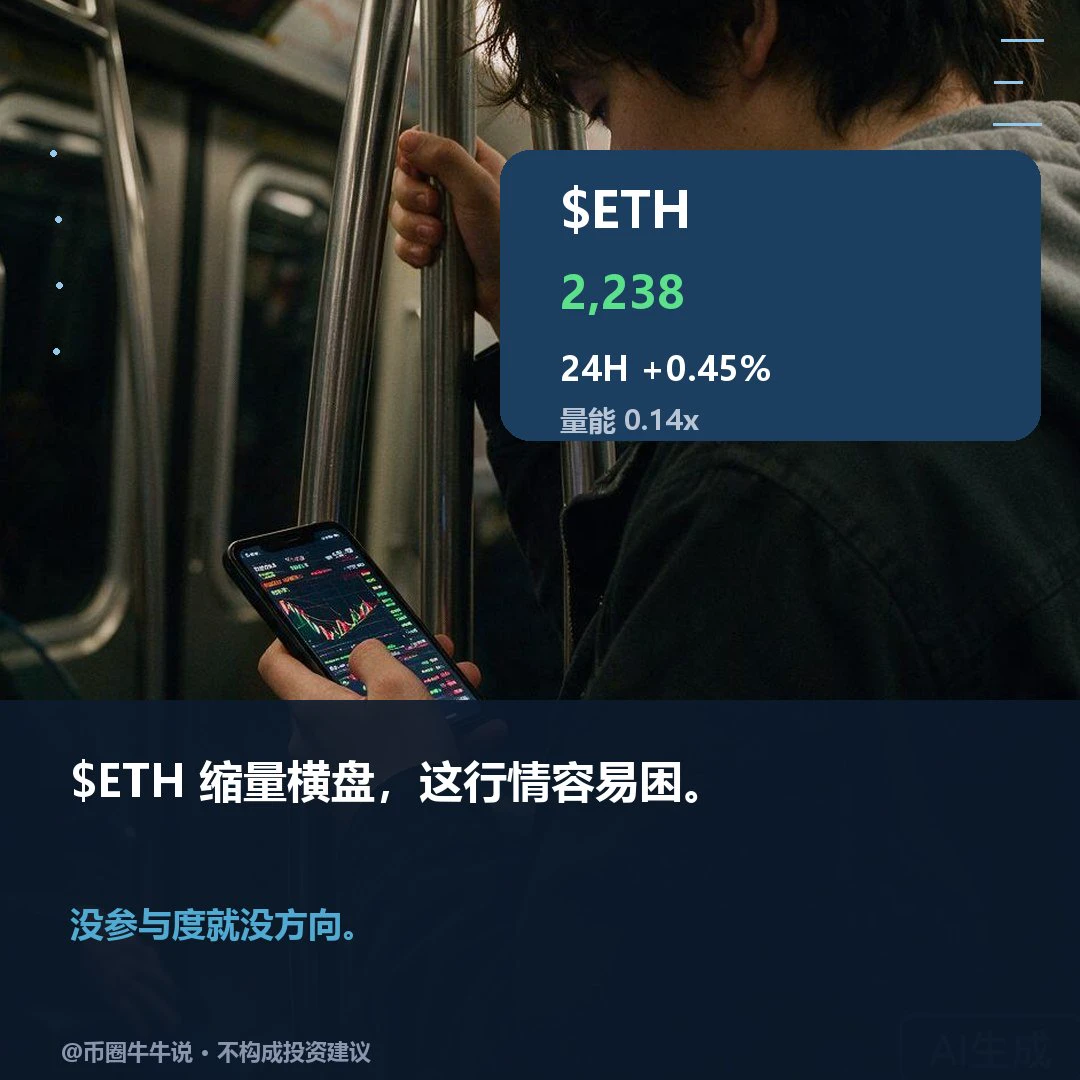
$ETH Currently at 2238.15, 24H +0.45% (range: 2216.94–2254.25). 1H is weak, RSI 38.95, price below EMA20 at 2243.64, volume ratio 0.14; 4H is weak, RSI 15.19, price below EMA20 at 2265.83. A sustained hold above the 2254.25 resistance could signal continuation; a break below the 2218.92 support would weaken the structure. On review, confirm whether price holds above 2254.25 and reclaims 2218.92; volume is only 0.14x. A breakout without volume, or a breakdown without a subsequent reclaim, invalidates the setup. Markets are volatile; for observation only.
post-image
ETH-1.26%
$SNDK I took a look around the plaza and almost everyone has multiple SanDisk orders above 1200... Holy shit, are you guys crazy?😵😵😵
post-image
SNDK-0.18%
  • 1
Crypto wallets are becoming invisible infrastructure.
In 2026, we're seeing a different approach to wallet UX: users increasingly interact with financial products, while keys, gas, transaction routing, and signing logic move behind the interface.
Several funding rounds and new products highlight this:
@turnkeyhq raised $12.5M to expand its secure signing and wallet infrastructure.
@multisig raised $18M to scale @altitude, bringing stablecoin payments and treasury management into business workflows.
@sortedwallet raised $4.4M to expand accessible crypto wallets across emerging markets.
@Foundat
post-image
SUI-1.05%
OpenAI CFO: Data center investments will not change due to the midterm elections.
live-cover
LIVE1,498
My first slab.
1999 Fossil 1st Edition Gambler. PSA 10.
Paid $1,000.
Last one sold for $615.
A year ago they were going for $155.
So I either overpaid or I'm early. Holding it forever anyway.
  • 1
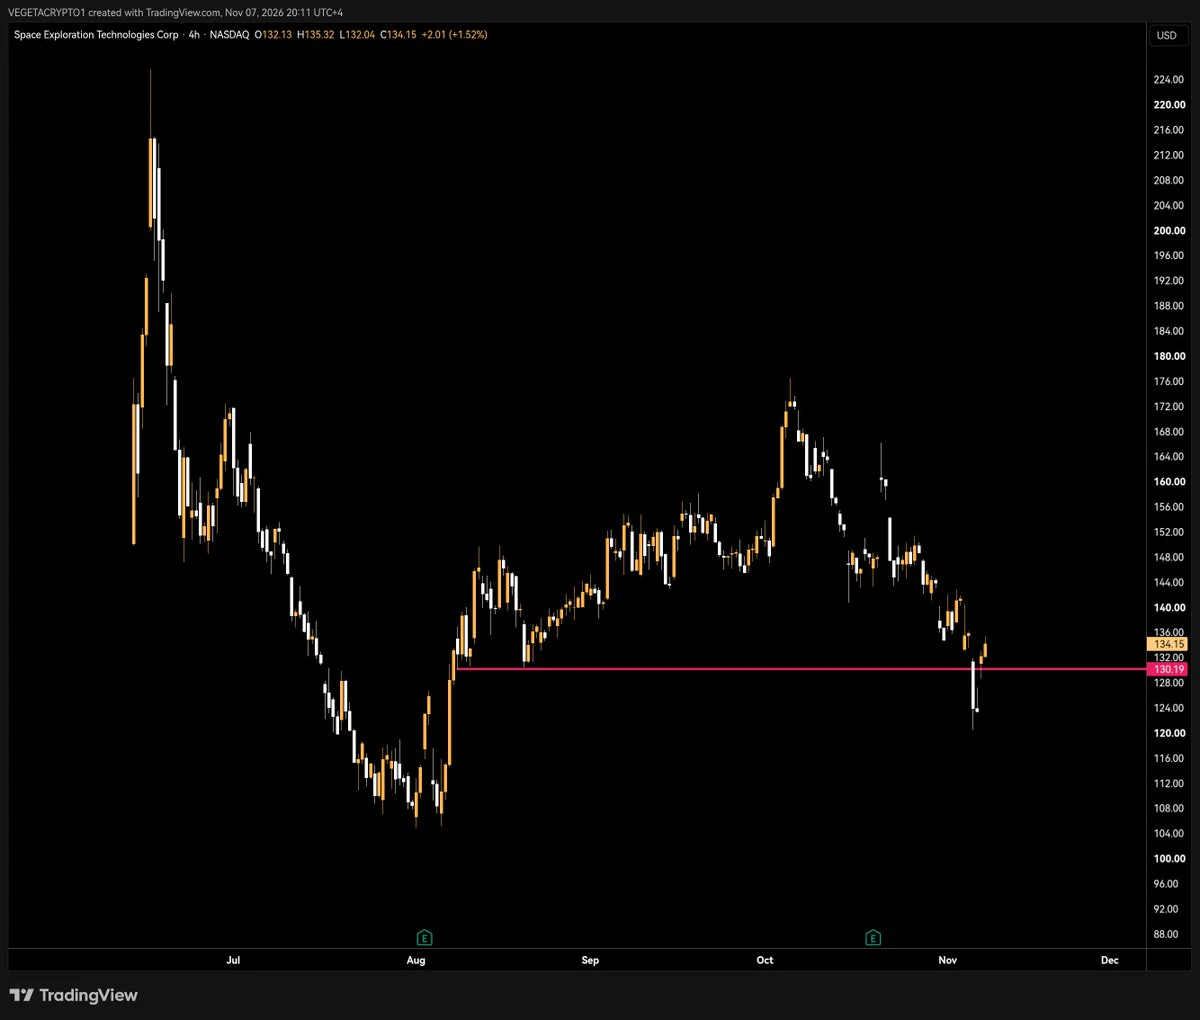
$SPCX good sweep if it can hold against the market.
post-image
SPCX+0.78%
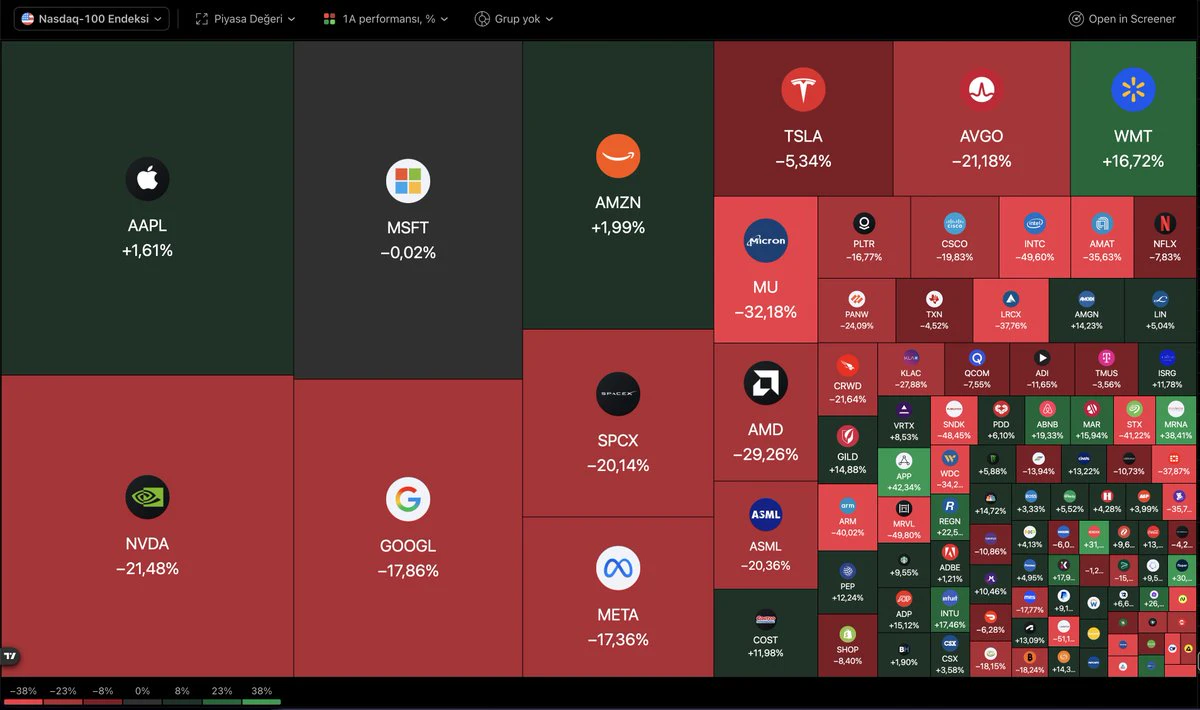
#Nasdaq 100 1-month performance...
post-image
NAS100+1.90%
  • 1
Good morning felt like crap all week. Turns out water works like magic 😂 Hydrated and back to manifesting my retirement era of slow calm mornings
post-image
“The More Indicators You Load, the Faster You Die”

I once saw an account with seven indicators stacked on the screen:
MACD, KDJ, RSI, Bollinger Bands, Fibonacci, volume, and one he had written himself.
I asked him, “When all seven give you a signal at the same time, which one do you listen to?”
He froze for three seconds, then said, “Whichever one looks right.”
More ironically, some of his biggest losses that year happened during “indicator confluence.”
Three indicators all signaled bullish, so he went all in. Then one bearish candle wiped them all out.
Indicators are shadows of price, not th
post-image
BTC-0.65%
#晒出我的持仓收益 $MU $BTC
When you get caught up in the moment, you'll try anything
post-image
MU+4.71%
BTC-0.65%
🔥Gold slammed on the brakes right after surging. The real battle between bulls and bears is still ahead!

As of 22:26 Beijing time on November 7, XAU's latest full close was around 4,081. It has quickly recovered from around 3,881 recently, rebounding about 4.46% over the past 5 days. But it failed to hold above 4,152, showing that buying support at lower levels is solid, while overhead selling pressure is also significant.

On the news front, the latest U.S. nonfarm payrolls rose by 165k and the unemployment rate was 4.1%. Strong employment is supporting the dollar and Treasury yields, which
GLDX-0.40%
PAXG+0.37%
#AI科技股大跌加密市场承压 #WCTCS9 #BTC行情分析 Bitcoin fell to $74,888, an 11-week low: Why 67% of traders are still long is the real problem

At 8 a.m. today, Bitcoin hit a low of $74,888. That was its lowest level since August, a new 11-week low.
But at the same time, if you look at the price change, you’ll find a puzzling number: it was down just 0.3% over the past 24 hours. It hit a new low, but didn’t fall much further. That contrast is the most noteworthy thing today.

1. First, let’s look at the numbers across three time frames
Looking at just one day can be misleading; we need to consider three time
post-image
BTC-0.65%
Load More

Join 40 M users in our growing community

⚡️ Join 40 M users in the crypto craze discussion

💬 Engage with your favorite top creators

👍 See what interests you

Trending Topics

USAIStocksHitHard

20.03k Views3.67k Discussing

U.S. stocks sold off sharply on Thursday, November 5 (UTC). The Nasdaq closed down around 5.5%, entering correction territory, while the Philadelphia Semiconductor Index plunged roughly 12%, with chip stocks including $NVDA and $AMD posting steep losses. Beyond profit-taking, investors are growing concerned about the pace of AI data center construction, capital spending, and future returns on investment. The key question now is whether the AI sector’s lofty growth expectations need to be repriced. Where do you think the next opportunities will emerge: chip stocks, tech giants, or other sectors?

USNonfarmPayrolls

31.86k Views4.33k Discussing

StakeOnLaunchpoolToShare450KVLX

8.28k Views822 Discussing

View More