











XRP Technical Outlook: XRP Consolidates Near $1.30 as Bulls Attempt to Defend Support
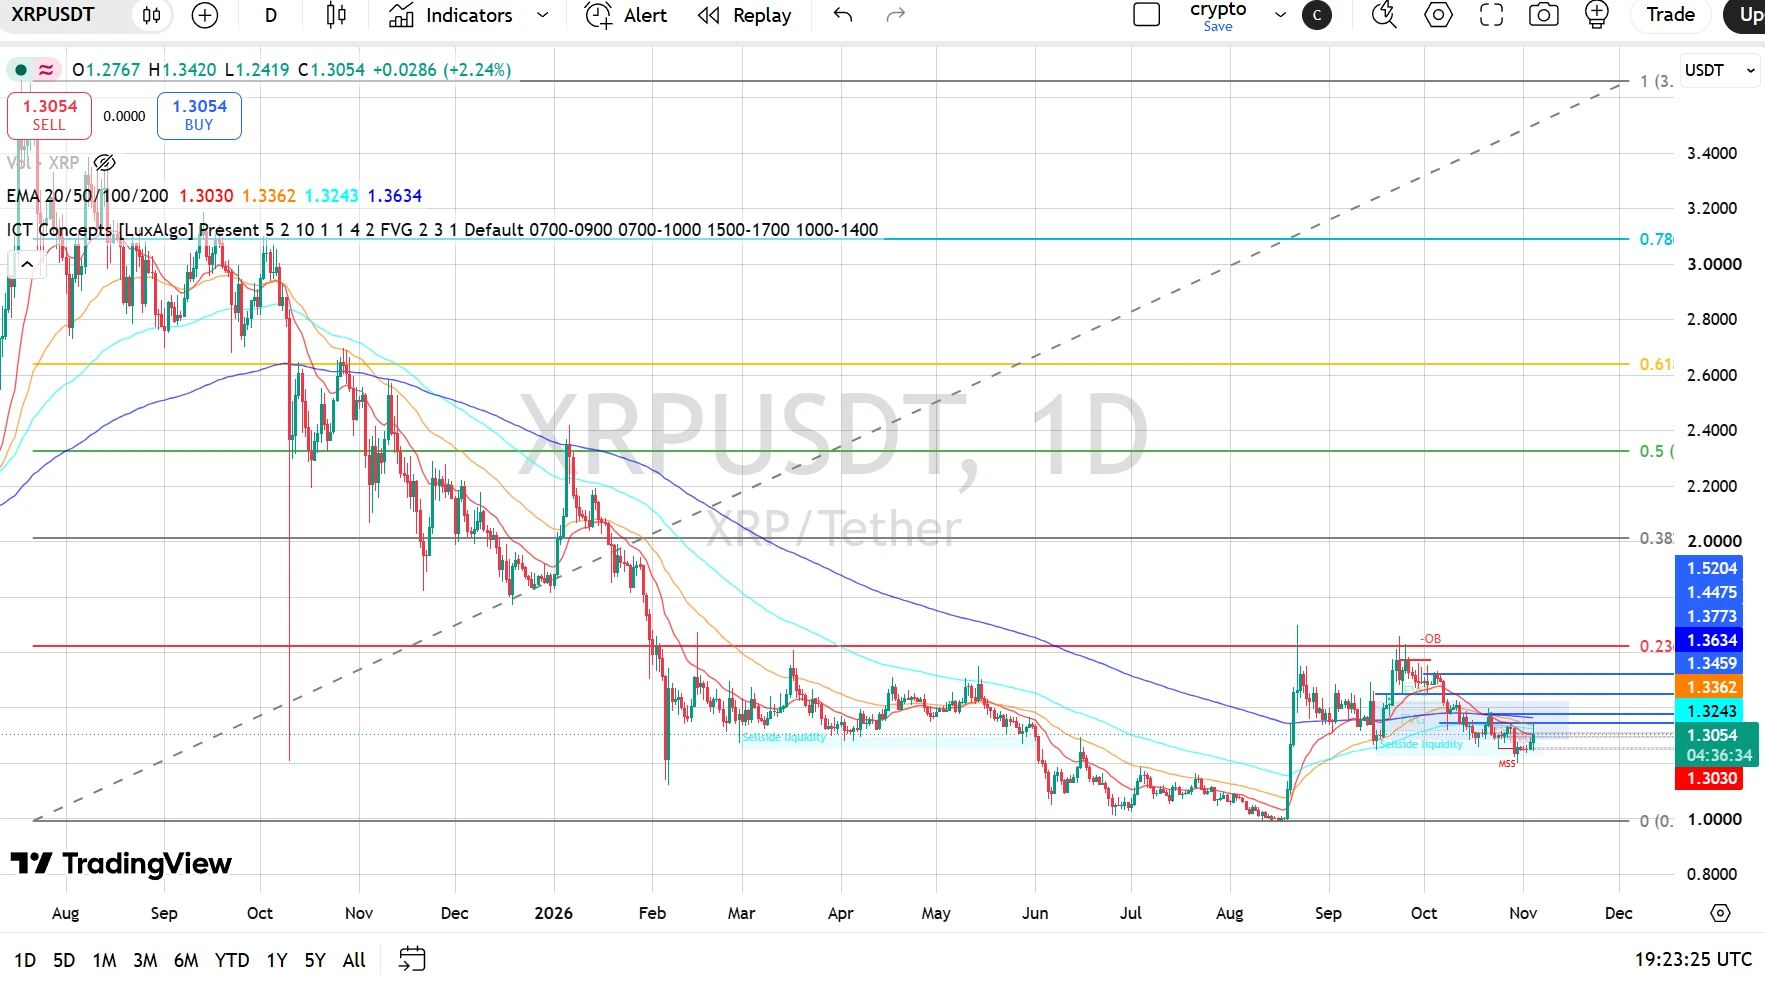
XRP is currently trading around $1.3049–$1.3051, consolidating after its recovery from the $1.00 region. The recent rally pushed price toward the $1.37 area, but XRP faced rejection and has since moved into a corrective phase.
The broader recovery has lost some momentum, with price trading below the 50, 100, and 200 EMAs. However, XRP is holding near the 20 EMA and attempting to stabilize around $1.30.
The immediate focus is whether buyers can defend the $1.30 area and reclaim the $1.3243–$1.3362 resistance zone. A sustained move above this zone would improve the recovery outlook, while a breakdown below support could expose XRP to further downside.
EMA Structure
* 20 EMA: $1.3030
* 50 EMA: $1.3362
* 100 EMA: $1.3243
* 200 EMA: $1.3634
XRP is trading slightly above the 20 EMA but remains below the 50, 100, and 200 EMAs. This indicates that short-term price action is attempting to stabilize, while the broader trend still faces significant overhead resistance.
The $1.3243–$1.3362 region is the first important resistance zone. Reclaiming the 50 EMA at $1.3362 would strengthen the short-term recovery, while the 200 EMA near $1.3634 remains a major barrier.
Fibonacci Levels
Based on the visible chart levels:
* 0.236: Around $1.3459
* 0.382: Around $2.00
* 0.5: Around $2.32
* 0.618: Around $2.64
* 0.786: Around $3.08
XRP is trading below the visible 0.236 Fibonacci resistance area. A sustained recovery above $1.3459 would be an early sign of improving momentum. The higher Fibonacci levels represent broader recovery objectives rather than immediate targets.
Bullish Scenario
If XRP holds the $1.30 support area and buyers manage to reclaim the nearby EMA resistance zone, the price could attempt a recovery toward:
* $1.3243
* $1.3362
* $1.3459
* $1.3634
* $1.3773
* $1.4475
* $1.5204
A decisive move above $1.3459 would improve the bullish outlook. Reclaiming $1.3634–$1.3773 could open the way toward the $1.4475 resistance area.
Pullback Scenario
If XRP fails to hold above $1.30 and selling pressure increases, the following support areas deserve attention:
* $1.3030 — 20 EMA
* $1.30 — Immediate psychological support
* $1.27–$1.25 — Potential lower support area
* $1.00 — Major historical support region
A sustained breakdown below $1.30 would weaken the current consolidation structure and increase the possibility of a deeper correction. The $1.00 region remains an important broader support reference on the chart.
RSI Momentum
* RSI: 47.82
* RSI Signal Average: 40.26
RSI is below the neutral 50 level, showing that bullish momentum remains limited. However, the RSI is above its signal average, suggesting a modest improvement in short-term momentum.
A move above 50–55 would provide stronger confirmation of a recovery attempt. If RSI turns lower and falls below 40, downside pressure could increase.
Market Structure & Liquidity
XRP has experienced a prolonged decline from its previous highs before finding support around the $1.00 region. The subsequent recovery pushed price toward the $1.37 area, but buyers have struggled to maintain that upward momentum.
The latest price action shows lower highs and consolidation around $1.30–$1.34. The market is currently testing whether the $1.30 region can hold as support.
The broader structure remains under pressure while XRP trades below the 50, 100, and 200 EMAs. A confirmed reclaim of the $1.3459–$1.3773 zone would be needed to establish a stronger bullish recovery.
Key Levels
Resistance
* $1.3243
* $1.3362
* $1.3459
* $1.3634
* $1.3773
* $1.4475
* $1.5204
Support
* $1.3030
* $1.30
* $1.27–$1.25
* $1.00
Final Outlook
XRP remains neutral-to-bearish while trading below the $1.3362–$1.3634 resistance zone. The price is attempting to stabilize around $1.30, but the broader recovery still needs confirmation.
A sustained breakout above $1.3459 could open the path toward $1.3773, followed by $1.4475. On the downside, losing $1.30 would increase the risk of a deeper correction.
Bias: Neutral-to-bearish below $1.3459 | Breakout above $1.3773 could strengthen recovery toward $1.4475–$1.5204.
Analysis based on the provided XRP/USDT 1D chart dated November 4, 2026. These levels represent technical scenarios, not guaranteed outcomes.
$XRP
XRP is currently trading around $1.3049–$1.3051, consolidating after its recovery from the $1.00 region. The recent rally pushed price toward the $1.37 area, but XRP faced rejection and has since moved into a corrective phase.
The broader recovery has lost some momentum, with price trading below the 50, 100, and 200 EMAs. However, XRP is holding near the 20 EMA and attempting to stabilize around $1.30.
The immediate focus is whether buyers can defend the $1.30 area and reclaim the $1.3243–$1.3362 resistance zone. A sustained move above this zone would improve the recovery outlook, while a breakdown below support could expose XRP to further downside.
EMA Structure
* 20 EMA: $1.3030
* 50 EMA: $1.3362
* 100 EMA: $1.3243
* 200 EMA: $1.3634
XRP is trading slightly above the 20 EMA but remains below the 50, 100, and 200 EMAs. This indicates that short-term price action is attempting to stabilize, while the broader trend still faces significant overhead resistance.
The $1.3243–$1.3362 region is the first important resistance zone. Reclaiming the 50 EMA at $1.3362 would strengthen the short-term recovery, while the 200 EMA near $1.3634 remains a major barrier.
Fibonacci Levels
Based on the visible chart levels:
* 0.236: Around $1.3459
* 0.382: Around $2.00
* 0.5: Around $2.32
* 0.618: Around $2.64
* 0.786: Around $3.08
XRP is trading below the visible 0.236 Fibonacci resistance area. A sustained recovery above $1.3459 would be an early sign of improving momentum. The higher Fibonacci levels represent broader recovery objectives rather than immediate targets.
Bullish Scenario
If XRP holds the $1.30 support area and buyers manage to reclaim the nearby EMA resistance zone, the price could attempt a recovery toward:
* $1.3243
* $1.3362
* $1.3459
* $1.3634
* $1.3773
* $1.4475
* $1.5204
A decisive move above $1.3459 would improve the bullish outlook. Reclaiming $1.3634–$1.3773 could open the way toward the $1.4475 resistance area.
Pullback Scenario
If XRP fails to hold above $1.30 and selling pressure increases, the following support areas deserve attention:
* $1.3030 — 20 EMA
* $1.30 — Immediate psychological support
* $1.27–$1.25 — Potential lower support area
* $1.00 — Major historical support region
A sustained breakdown below $1.30 would weaken the current consolidation structure and increase the possibility of a deeper correction. The $1.00 region remains an important broader support reference on the chart.
RSI Momentum
* RSI: 47.82
* RSI Signal Average: 40.26
RSI is below the neutral 50 level, showing that bullish momentum remains limited. However, the RSI is above its signal average, suggesting a modest improvement in short-term momentum.
A move above 50–55 would provide stronger confirmation of a recovery attempt. If RSI turns lower and falls below 40, downside pressure could increase.
Market Structure & Liquidity
XRP has experienced a prolonged decline from its previous highs before finding support around the $1.00 region. The subsequent recovery pushed price toward the $1.37 area, but buyers have struggled to maintain that upward momentum.
The latest price action shows lower highs and consolidation around $1.30–$1.34. The market is currently testing whether the $1.30 region can hold as support.
The broader structure remains under pressure while XRP trades below the 50, 100, and 200 EMAs. A confirmed reclaim of the $1.3459–$1.3773 zone would be needed to establish a stronger bullish recovery.
Key Levels
Resistance
* $1.3243
* $1.3362
* $1.3459
* $1.3634
* $1.3773
* $1.4475
* $1.5204
Support
* $1.3030
* $1.30
* $1.27–$1.25
* $1.00
Final Outlook
XRP remains neutral-to-bearish while trading below the $1.3362–$1.3634 resistance zone. The price is attempting to stabilize around $1.30, but the broader recovery still needs confirmation.
A sustained breakout above $1.3459 could open the path toward $1.3773, followed by $1.4475. On the downside, losing $1.30 would increase the risk of a deeper correction.
Bias: Neutral-to-bearish below $1.3459 | Breakout above $1.3773 could strengthen recovery toward $1.4475–$1.5204.
Analysis based on the provided XRP/USDT 1D chart dated November 4, 2026. These levels represent technical scenarios, not guaranteed outcomes.
$XRP