Square
Following
Hot
News
Profile
Share your thoughts
placeholder
Article
😁Entering BTC early doesn't matter
If the calculation is right, the pump is tonight
SAND also showed bullish divergence on both the 4-hour and 1-hour charts, and I posted them all today, guys! SAND has pumped too!$BTC $ETH #美国9月PPI大超预期
FyPaymentMadeEasy
10.15
The BTC short opened at 83590 has been fully closed.
Preparing to gradually buy the dip and go long.
There have indeed been quite a lot of negative factors during this period.
The lowest level should be around 78000. Add to the position there, and it should rebound. Keep pushing!
repost-content-media
BTC+0.93%
ETH+0.44%
#btc More likely, more gold coins will be mined tomorrow.
post-image
BTC+0.90%
AAAAHHHHH FEELS GOOD FLIPPING BIAS EVERY DAY AND STILL DOING OKE
post-image
OKE-1.17%
bullish now,gass $US
post-image
US+8.00%
🚀🔥 GATE.IO ⚡ HOT TRADER LIVE | BTC AT A CRITICAL LEVEL! ₿📊 | BIG MOVE AHEAD? 🐂🐻
live-cover
LIVE1,598
I’ve turned off the $PYTH gainers-and-losers leaderboard for now, and the chart instead leaves just one question: after $PYTH’s sharp 24-hour surge, momentum and continuation are still not the same thing.
$PYTH is currently at 0.09597, up 21.88% in 24 hours. The 1-hour support is 0.08005, resistance is 0.10094, and current volume is 1.01 times the average volume of nearly 20 recent candles.
My view for now is this: I won’t extrapolate the large move that has already occurred into the next leg. First, I’ll watch whether the price can hold in the new zone. Moving upward does not count as a win
post-image
PYTH+20.29%
$DOGE Everyone is advising me not to invest in Dogecoin, but I'm very individualistic—I insist on not listening
post-image
DOGE-0.80%
  • 1
$OSMO Current price: 0.0453. The first resistance above is at 0.0468 (MA5), while support below is at 0.0456 (MA20); this area is the short-term bull-bear dividing line.
At the broader market level, the Fear & Greed Index is 53, in the neutral range. There is neither panic selling pressure nor overheated chasing, and BTC and ETH lack directional drivers, with capital more inclined to seek rotation opportunities among small- and mid-cap sectors. $OSMO Up nearly 20% in 24 hours, with trading volume of only 5.0M USDT, this is a typical low-liquidity impulse move. The 36.42% amplitude indicates i
post-image
OSMO+16.78%
ETH+0.33%
BAT+12.09%
The Bears are shaking right now...
Bitcoin back at 81.8K turning green.
SP500 almost break even.
BTC+0.90%
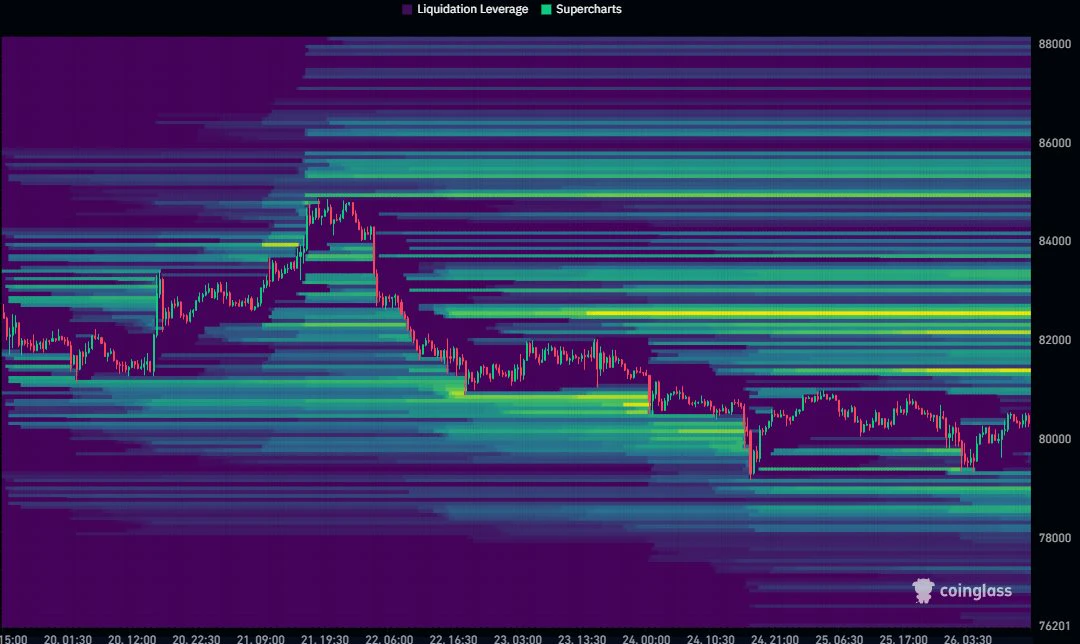
QCP Capital says $80,000 to $82,000 is a buying zone—do I believe it?

Singapore-based trading firm QCP Capital published a report in early October, identifying $80,000 to $82,000 as a potential buying zone for BTC in the fourth quarter. Their base case is for BTC to remain range-bound between $80,000 and $90,000 in the fourth quarter.

QCP's logic is a standoff between structural crypto demand and a difficult macro environment. On the one hand, ETFs are seeing inflows (although they have recently seen outflows), while long-term holders are locking up their holdings. On the other hand, high
NAS100-0.66%
ETH’s first take-profit target for the intraday trade has been reached
post-image
ETH+0.33%
After the Korean stock market hit a circuit breaker and Hynix's original stock fell 11% that day, $SKHY ’s premium rose, reaching 52.5%.
U.S. liquidity is still somewhat better; over the past 2 days, US Hynix has been following the decline less and less.
I’m planning to buy a TradingView membership in November, after which I’ll be able to share my own charts.
For now, I can only post the code today: NASDAQ:SKHY*10/(KRX:000660/FX_IDC:USDKRW)-1
post-image
SKHY-2.75%
SK Hynix-11.06%
$BTC just climbed 2.52% in about an hour to $82,185. Traders betting on a fall took the hit, with $10.3M of their leveraged positions forced shut on our streams.
post-image
BTC+0.93%
Bonds plunge as US inflation data comes in extremely high.
The Fed has to tighten its policies, but it’s clear that bonds suggest something is breaking.
post-image
CRYPTO MARKET OVERVIEW
live-cover
LIVE1,486
The most unusual detail in today’s market was not on the top gainers list, but on the top losers list: $CHIP fell 13.72% over 24 hours, with trading volume of only 8.1M USDT, yet the MACD histogram had turned positive at +0.0003693. The funding rate was -0.0002%, but the price was still being held below MA20 (0.047009). Meanwhile, $PYTH rose 14.31% and $NIL rose 16.67%, with funds clearly concentrating in stronger assets. $CHIP’s decline looks more like passive bleeding than active selling pressure—the negative funding rate combined with a bullish MACD divergence suggests short positioning
post-image
CHIP-10.29%
PYTH+20.29%
NIL+15.11%
Another Japanese project on SOL @bakeruip
Let’s apply for it; it looks pretty cool
SOL+1.91%
You can tell at a glance that this company really knows how to play the game.
post-image
#USSeptemberPPIBeatsExpectations
3ULL – PLAYA3ULL GAMES | #Gaming Token $3ULL #3ULL is a Web3 gaming cryptocurrency designed to connect gaming, blockchain technology, digital ownership, and community participation.
post-image
3ULL+2.55%
  • 1
Load More

Join 40 M users in our growing community

⚡️ Join 40 M users in the crypto craze discussion

💬 Engage with your favorite top creators

👍 See what interests you

Trending Topics

USSeptemberPPIBeatsExpectations

91.35k Views1.85k Discussing

US September PPI came in at 6.3% YoY, well above the 5.3% market expectation, pointing to renewed producer-side inflation pressure. Weekly jobless claims were 199K, broadly in line with forecasts. Could hotter inflation further reduce room for rate cuts, and what does it mean for $BTC, US stocks, and gold?

DrLinHanSpeaksAtOxfordUnion

135.63k Views1.86k Discussing

JapanAndKoreaStocksPlunge

47.27k Views1.75k Discussing

View More