Share your thoughts
placeholder
Article
$PROM It surged 18% in 24 hours, with the current price at 5.943, an intraday high of 5.957, just one step away from the 6-dollar mark.
What signal is this daily candlestick showing? A high-volume breakout. The 24-hour trading volume is 27.5M, combined with an 18% gain, which reflects real capital inflows—not the kind of false breakout on declining volume. On the 4-hour chart, the 5.0–5.95 range was almost cleared in one move, with no significant pullback in between, showing that buyer sentiment is extremely strong. The current price is trading close to the 24-hour high, which is a typical str
PROM+13.57%
Everyone is about to miss the $ENA /USDT move that was hiding in plain sight.

$ENA /USDT - LONG

Trade Plan:
Entry: 0.14067 – 0.14159
SL: 0.13667
TP1: 0.14448
TP2: 0.14671
TP3: 0.15006

Why this setup?
Why now? The daily trend is firmly bullish, giving us macro direction, while the 15m RSI sits at 41.61, showing room for a fresh leg up without being overbought. The 1h ATR of 0.00186 defines the volatility we must respect, and the entry zone between 0.14067 and 0.14159 offers a precise risk-controlled setup. We are targeting TP1 at 0.14448 and TP2 at 0.14671, with the invalidation level at
ENA-0.57%
Why is everyone suddenly talking about DOGE when the daily trend is just range?

$DOGE /USDT - SHORT

Trade Plan:
Entry: 0.08472 – 0.08496
SL: 0.08599
TP1: 0.08398
TP2: 0.08340
TP3: 0.08254

Why this setup?
Why now? The 1h price sits at 0.08484, right inside the entry zone between 0.08472 and 0.08496, giving the short bias a precise starting point. The 15m RSI at 50.62 shows the asset is neutral, not overbought, which makes a move lower from this range more plausible than a squeeze. The 1h ATR of 0.00048 tells us the hourly volatility is small, so the target TP1 at 0.08398 is a realistic fi
post-image
DOGE+0.82%
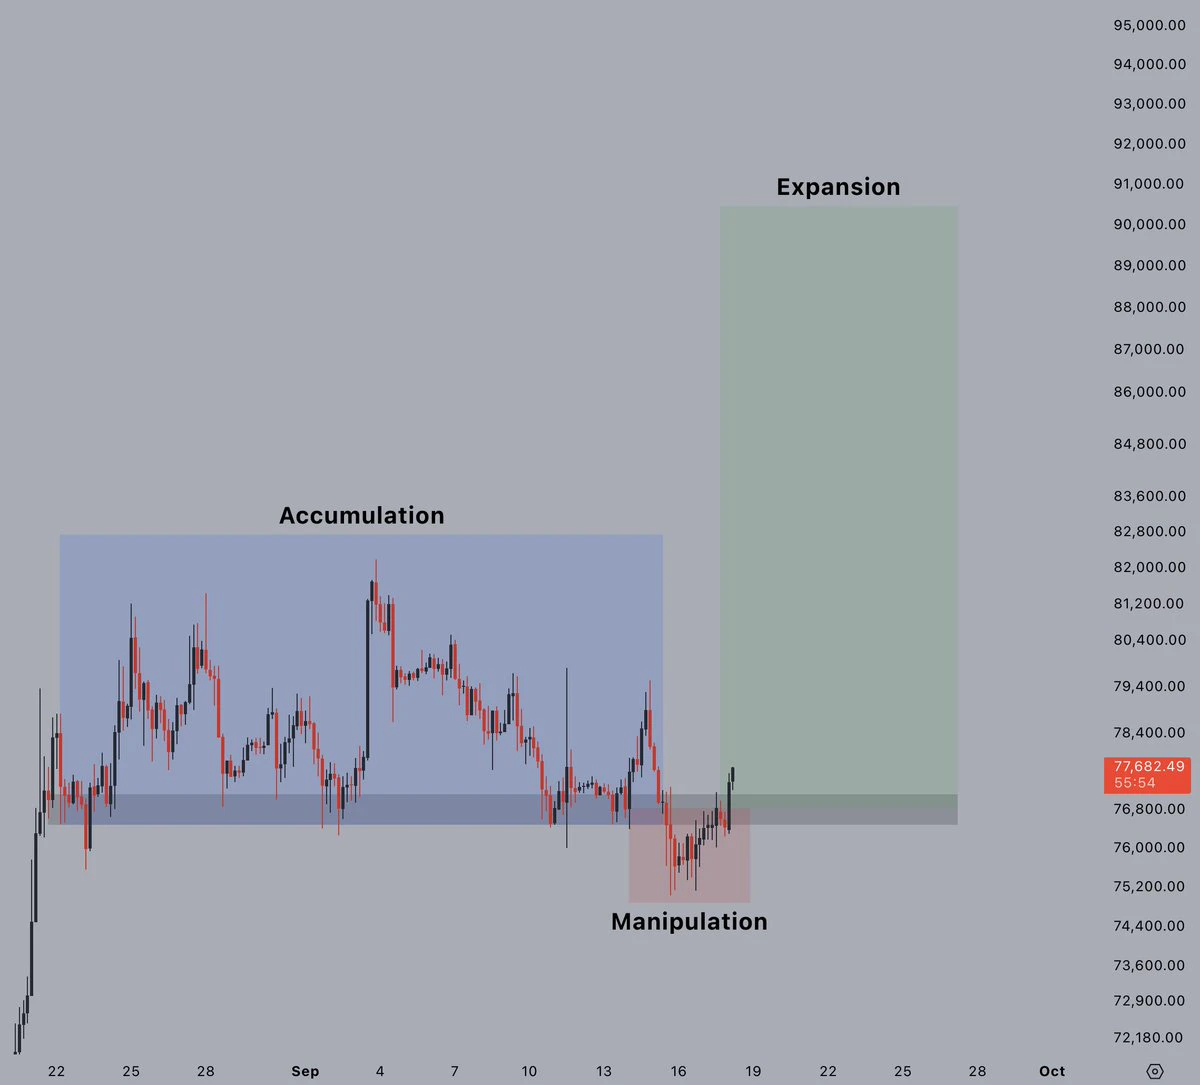
Why can’t BTC hold above 80K?
I just looked at the ETF fund flows and seem to have found a pretty direct reason. 👀
On September 3, U.S. spot BTC ETFs still saw approximately $682 million in net inflows in a single day.
But then the picture suddenly changed.
September 8: -$46.6 million; September 9: -$120 million; September 10 was even worse, at -$283 million. They finally turned positive yesterday.
I took a look: +$6 million. 🙂
Hahahaha, a few days ago they were using basins to catch the money, and now they’ve switched to mineral water bottle caps. 😂
This actually lines up pretty well with
post-image
BTC0.00%
  • 2
  • 1
I switched to the background to reply to a message, and when I came back, it had already finished the job.

When the market was just dumped in the early session, $SNDK ’s rebound was weak, volume failed to follow, and it faced resistance at the highs. I figured the short could still be held and opened a short on SNDK at 1651.77. The price has now fallen to 1634.07, with a +75.86% gain sitting there. Feels good, brothers—we nailed this move.

Take 80% off the table first, and protect the remaining 20% at breakeven. If it continues to sell off, let the profits run; if it rebounds, don’t give b
post-image
SNDK-0.05%
ZEC-2.54%
BNB+0.57%
$USELESS This long position didn’t add hastily after entry; I first waited to see whether USELESS could hold above the previous high. Support on the pullback was stronger than expected, and the false breakout didn’t damage the structure, so I continued holding.

Once the +2437.23% gain was secured, I handled it with a 70/30 split: taking 70% off the table first and moving the remaining 30% to a protective stop, rather than giving back all the profits. If it faces pressure again around 0.22777, I’ll reduce a bit more.

For now, I’m more inclined to stay bullish on the pullback. The conditions
post-image
USELESS+3.36%
ADA+1.27%
XRP+0.89%
$SNDK /USDT is range-bound on the daily but the 1h setup hints at a squeeze no one is talking about.

$SNDK /USDT - LONG

Trade Plan:
Entry: 1632.39 – 1635.77
SL: 1613.04
TP1: 1649.86
TP2: 1660.38
TP3: 1676.15

Why this setup?
Why now? The 1h price sits at 1634.08, right inside the entry zone of 1632.39 to 1635.77, giving a precise fill for the long. The 15m RSI at 57.32 shows room to run before overbought, while the 1h ATR of 6.742521 quantifies the current volatility and justifies a tight invalidation. The 1d range trend means the move is likely a breakout attempt rather than a reversal,
SNDK-0.05%
#AugustCoreCPIBeatsExpectations
August inflation data has delivered an important signal for global financial markets.
U.S. Core CPI increased 0.3% month-over-month in August, beating the 0.2% market expectation. On a yearly basis, core inflation came in at 2.4%, down from 2.5% in July but still above the Federal Reserve’s 2% inflation target.
The headline CPI also increased 0.4% in August, exactly matching expectations, while annual headline inflation remained at 3.4%.
At first glance, a 0.3% monthly core CPI number may not look dramatic.
But for financial markets, the difference between 0.2%
post-image
White House puts September 15 on the table, moving just 0.15% after the $PLUME event: the market simply didn't dare price it in
Well, the White House has put September 15 on the table—the voting window for the Clarity Act is closing. $PLUME is currently at 0.01341, moving only from 0.01339 to 0.01341 (+0.15%) after the event. I’m defensively bearish: reduce positions if it breaks below 0.0131, and turn bullish only after a high-volume move above 0.0137.

There’s only one transmission channel—the bill’s passage would give the RWA sector a compliant entry ticket, and PLUME is an RWA chain; Se
PLUME+1.15%
I was just about to curse it out, but then I looked at my account and thought, never mind—it can pump however it wants; I’ll keep quiet.
While $HOLO was grinding out a bottom during the session, it held its key level and moved sideways at the bottom. I said not to rush into long positions and to wait for a pullback to stabilize before entering. Stronger buying pressure is the signal; those who rush are more likely to lose their chips.
From 0.06140 to 0.06305, +128.72% secured. No logic, no technical analysis—I simply didn’t close the position and happened to catch the moment it wanted to pump.
post-image
HOLO-0.66%
ZEC-2.54%
DOGE+0.82%
we are gonna get some Stimmy here on $CYS
post-image
CYS+8.58%
#ZECPlungesOver13%
ZEC is now trading around $1,125, extending its pullback after recently trading above the $1,200 level.
A move from $1,200+ toward $1,125 can easily create fear, especially for traders who entered late during the rally. But after such an explosive move, a correction is not necessarily a sign that the entire trend has failed.
Sometimes the market simply needs to reset.
And right now, ZEC is entering a zone where I believe the next reaction could be more important than the size of the recent decline.
$1,125 Is Becoming a Key Psychological Area
The first thing I would watch is
ZEC-2.54%
STONKs reaction to pumpfun being a direct competitor now
post-image
STONKS-19.64%
Watch your entry on $10X
0xe58012c0990daaae0c0ef53be31b4be05b4883a5
post-image
I wasn’t watching the chart or thinking about it—it was jumping on its own, as if working overtime for me.
The last thing I saw before bed was $EDEN . Funds were quietly moving in, and the bids below were unusually thick. I only said: no need to panic at this level. When I opened the chart in the morning, it had completed the move I wanted to see.
From 0.04609 to 0.05046, +184.26% was sitting there. I took 80% off the table first, leaving the remaining 20% protected at the entry price.
The market is waited out, and profits are held onto. Take another look when a new structure appears—don’t get
post-image
EDEN+3.09%
ZEC-2.54%
ADA+1.27%
I was just about to go to the forum and rant, but then I saw my balance and decided to forget it—the market is always right🙏.
Since the topping process began, I’ve been watching $BTR . Every intraday push fell just short, and the volume visibly shrank, making it obvious that overhead resistance was heavy. A few afternoons ago, I decisively opened a short at 0.20941 and reminded everyone not to chase longs. When I opened the chart this morning, the price had already dropped to 0.04975, with floating gains of +1500.83%. Nailed the rhythm on this one🎯.
Take profits when it’s time. I closed 80% f
post-image
BTR-4.75%
LAB-13.41%
BTC-0.02%
Whale Transfers Reach Major Exchanges! Traders Watch for the Next Market Reaction
live-cover
LIVE384
market update
live-cover
LIVE2,213
This is Bitcoin dominance chart weekly, for real altseason star we need Bitcoin dominance below 57% that would be clear signal
I won't say anything complex. That's it.
post-image
BTC0.00%
#CoinDeskRevealsGateRWAPerpetualsTop3Globally
The RWA narrative is moving into a new phase, and the latest spotlight from CoinDesk highlights something important for the crypto market: Real-World Assets are no longer just a long-term concept. They are becoming part of the infrastructure traders and investors are actively watching today.
Gate’s RWA Perpetuals ranking among the Top 3 globally is a strong signal of how quickly the market is evolving.
For years, the crypto industry has focused heavily on native digital assets. Bitcoin, Ethereum, stablecoins, DeFi tokens and meme coins have domina
post-image
Load More

Join 40 M users in our growing community

⚡️ Join 40 M users in the crypto craze discussion

💬 Engage with your favorite top creators

👍 See what interests you