Square
Following
Hot
News
Profile
Share your thoughts
placeholder
Article
$ICNT Up 21% in half a day, it surged straight from 0.1015 to 0.1371, with 13.7M in trading volume pouring in. That’s not the kind of volume retail investors can generate. I took a quick look on-chain just now: the top 10 addresses’ holding concentration hasn’t declined, indicating this move is not distribution but someone accumulating. On the macro side, here’s an anchor: during the week when the Fed minutes leaned hawkish, the 30-day correlation between altcoins and the Nasdaq surged to 0.78. Small-cap assets like ICNT have higher beta, so as long as rate-hike expectations don’t rebound, it
ICNT+26.78%
$FIL5L This is very unreasonable—is it fun to play like this? What a joke, right?👎
post-image
Bitcoin is BACK over $82,000!!
We are so back!!
post-image
BTC+0.76%
$WULF had an intraday recovery of +20% which is pretty significant. It was down -65% from its high of $29 at some point today which still isn't as bad as the pullback in April 2025 where it saw -75% drawdown, but I'd say the sentiment in the space was just as bad
It almost seems irresponsible to show this chart. But it's currently forming a handle in this cup & handle pattern.
I don't make the fibs either, price currently found support around the 0.707 fib and if we get back above 0.786 and 0.887 fib then the upside targets could get wild. I don't see them happening anytime soon. For no I'd e
post-image
WULF+9.27%
CPI Comes in Hotter Than Expected
live-cover
LIVE27
BREAKING: TSMC posts a record quarter as Nvidia, Apple, Broadcom and AMD compete fiercely for its wafer capacity.
TSM-1.82%
NVDA-1.92%
AAPL-0.31%
AVGO-0.64%
AMD-1.47%
$BERA Current price 0.2275, 24h -5.88%, trading volume only 5.6M USDT, MA5 at 0.23092 has crossed below MA20 at 0.23155, RSI at 46.6 is weak, the MACD histogram at -2.941e-05 remains bearish, and the Bollinger Bands are [0.214696, 0.248404], with the 30-candle amplitude at approximately 17.58%. The funding rate is -0.0001%, with bears slightly dominant but not at an extreme, and the Fear & Greed Index is neutral at 53—this is a typical low-volume, gradual decline structure rather than panic selling, meaning downside may open slowly instead of being released all at once.
Directional view: Beari
post-image
EPIC-13.97%
$XAU Initial indicators point to an upcoming rise in gold after the liquidity withdrawn yesterday entered, with a strong timeframe breakout above $4,180.
post-image
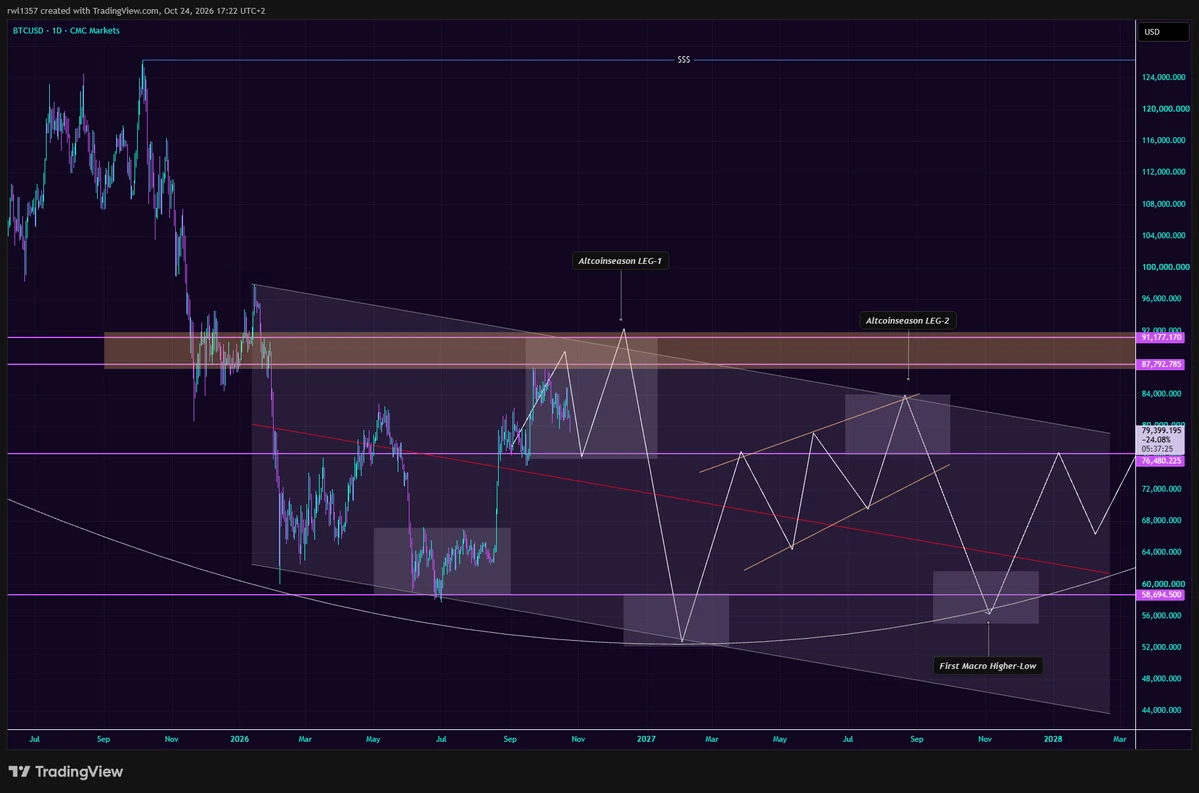
Bitcoin’s Long Term Cycle Chart Points to a Bigger Question: Are We in Another Accumulation Zone? 🙄
Bitcoin’s historical price cycles show a recurring pattern: major rallies, deep corrections, and long recovery periods.
The chart highlights previous peaks near $19,700 in 2017, $69,000 in 2021, and $126,000 in 2025, alongside earlier areas that some traders viewed as accumulation zones.
Now, the key question is whether the current price structure represents another opportunity to accumulate or whether the cycle is changing.
I think that the Historical patterns can offer useful context, but the
post-image
BTC+0.76%
$FET took me through a trade like this: the hardest part is knowing when to exit.
This feels like a good spot. Close the position right here. Watching these two today: $SO and $BAT .
post-image
FET+4.35%
BAT+29.11%
On October 16 $ETH , the ETH strategy is actually very similar to the BTC view; both are headed in the same direction, as discussed during the livestream.
Currently, 2545 is the resistance level. After the decline from the October 7 starting point, there was a natural rebound high when the price fell to 2545. This high, 2586, is tentatively set as an anchor point. From the price action, 2545 was broken and reclaimed twice. The second time, the price did not touch the area above 2545, so we will enter short in the area of selling pressure here, taking shorts in the 2500–2530 range.
The hard sto
post-image
ETH+1.70%
  • 1
JUST IN: MSCI to remove Michael Saylor's Strategy $MSTR from its indexes.
MSCI+2.49%
MSTR+5.58%
$BTW BTW, this rebound is like an old lady climbing stairs, panting every three steps😅 The downtrend is visible to the naked eye; don’t get carried away shorting, and keep leverage low to stay alive. It’s darkest before dawn—don’t throw your back out on a rebound; staying cautious makes you the winner🤙
post-image
BTW-18.88%
With the same 1,000U, some people doubled their money on $STRK last night, while others rushed in at today’s open and got trapped at the top. Which outcome would you choose?
Let’s look at the data first. $STRK is currently at 0.0881, up 14.3% in 24 hours, with a high of 0.0988, a low of 0.0717, and $465 million in trading volume. What does that mean? An intraday range of 38%, with trading volume several times the circulating market cap. This isn’t an ordinary rally—it’s a meat grinder for bulls and bears.
Bullish logic: STRK’s current move started around 0.07, with genuine volume coming in rat
STRK+13.53%
Bitcoin Mining Stocks Plunge: 4 Major Firms Lose Over 12% in One Day
Bitcoin miners took a severe hit on Wednesday as higher-than-expected US inflation data triggered a broad selloff across tech and AI stocks.
TeraWulf fell 12.64%, Core Scientific dropped 12.44%, Cipher Mining declined 12.35%, and IREN lost roughly 12.2% in a single session.
⚠️ Personal market analysis only. NFA — manage risk and DYOR.
Educational content, not investment advice or a recommendation to buy, sell, deposit, or withdraw any asset. No paid promotion or referral/affiliate links.
post-image
CORZ+7.03%
IREN-0.55%
10.16 $SNDK The strategy has once again reached everyone’s favorite moment: the “three storage clowns.” First, SanDisk’s decline is not over yet; it’s just that the short positions exited early, while long positions still have to withstand further downward pressure. We previously discussed one logic,
namely, the three underlying elements for training small and large AI models: 1. Computing power: continuously allowing small and large AI models to iterate and upgrade step by step; 2. Electricity: demand for computing power continues to rise, and stable power supply is the foundation, with typic
post-image
SNDK-0.56%
🔹Whale Dumps BTC and Loads Up on ETH! After selling 237.8 BTC and buying 7,929 ETH, is big money be
live-cover
LIVE23
$NEAR The most interesting thing right now is not guessing whether prices will rise or fall, but seeing who is forced to change their tune first.
The bulls’ test is at 5.44, while the bears’ test is at 4.527. $NEAR is currently at 5.392, up 11.96% in 24 hours. One-hour support is 4.527, resistance is 5.44, and current volume is 0.31 times the average volume of nearly 20 bars.
For now, I’ll note that $NEAR remains strong, while the crowded positioning is already out in the open. I acknowledge that the trend is strong, but what matters next is not how much higher it can surge, but whether anyone
post-image
$US Bought spot at a low yesterday, went long and bought the dip, winning across the board. As long as you hold, just wait for the pump to sell
US-10.03%
$QNT
A steady grind lower all the way, with longs liquidating longs—everyone trying to catch the falling knife got buried.😤 A rebound to 213.7 is the window to escape; if 201.8 breaks, it will head straight down. Don’t wait until the waterfall comes to run.
post-image
QNT+0.80%
Load More

Join 40 M users in our growing community

⚡️ Join 40 M users in the crypto craze discussion

💬 Engage with your favorite top creators

👍 See what interests you

Trending Topics

USSeptemberPPIBeatsExpectations

91.35k Views1.88k Discussing

US September PPI came in at 6.3% YoY, well above the 5.3% market expectation, pointing to renewed producer-side inflation pressure. Weekly jobless claims were 199K, broadly in line with forecasts. Could hotter inflation further reduce room for rate cuts, and what does it mean for $BTC, US stocks, and gold?

DrLinHanSpeaksAtOxfordUnion

135.63k Views1.86k Discussing

JapanAndKoreaStocksPlunge

47.27k Views1.76k Discussing

View More