Square
Following
Hot
News
Profile
Share your thoughts
placeholder
Article
#BTCBackAbove80K #ShareWeekly
Bitcoin Reclaims the Critical $80,000 Level: Detailed Market Analysis, Trading Strategy, and Outlook Amid Midterm Results and Upcoming Non-Farm Payrolls
Bitcoin has climbed back above the $80,000 price level. This recovery marks a notable shift after recent pressure that pushed the asset lower. The price movement shows Bitcoin once again trading above this psychological and technical threshold, reflecting renewed interest from market participants
The Bitcoin price has moved back above $80,000. This reclamation of the level is significant because $80,000 has acted
Layout: Bitcoin, Ethereum, Dogecoin
live-cover
LIVE1,659
  • 1
Trenches
ZIG
Z
bade
b
ZIG
0x8c...1145
Market Cap
$.
Change
.
24h Vol
$.
Holders
.
BTC
B
bade
b
BTC
C5xp...pump
Market Cap
$.
Change
.
24h Vol
$.
Holders
.
HIGH
H
bade
b
HIGH
7ymF...high
Market Cap
$.
Change
.
24h Vol
$.
Holders
.
STONK
S
bade
b
STONK
6GmA...UNgx
Market Cap
$.
Change
.
24h Vol
$.
Holders
.
CORLA
C
bade
b
CORLA
0xba...7777
Market Cap
$.
Change
.
24h Vol
$.
Holders
.
📡 Signal Card | Just Captured
Source: Trader Cash Asset: $XRP Long Entry: 1.3253 Target: 1.3816 / 1.4334 / 1.4893 Stop Loss: 1.2965 Time: Not specified
I’m just passing this along—the signal belongs to someone else, and your wallet is your own treasure. Whether to follow it and how much to invest are up to you. Don’t get carried away and go all in 🫠
For personal records and sharing only; not investment advice. #SpaceXTeamsUpWithQualcommToBuildUS5GNetwork
XRP-1.15%
QCOM+5.60%
$BTC $1.424 billion in liquidity is clustered below! The key zone is right around $79,900. There’s also $102 million above at $81,500! The liquidity below is nearly 14 times larger than above. Could we see a sweep below first, followed by a counterattack? The liquidity data shows about $1.424 billion clustered below BTC near $79,900, while about $102 million sits above near $81,500—a clear gap between the two sides. In the short term, it’s worth watching whether selling pressure triggers a further sweep as the price approaches $79,900, and whether buyers can step in in time. With more position
post-image
BTC-0.67%
ETH-1.26%
ZEC+1.16%
Hawk 🦅🦅First target: surpass SHIB’s market cap! Second target: 100 million holders worldwide! Driven by the global community, built together through consensus—we won’t stop until we reach our goals🔥🔥
SHIB-1.28%
  • 1
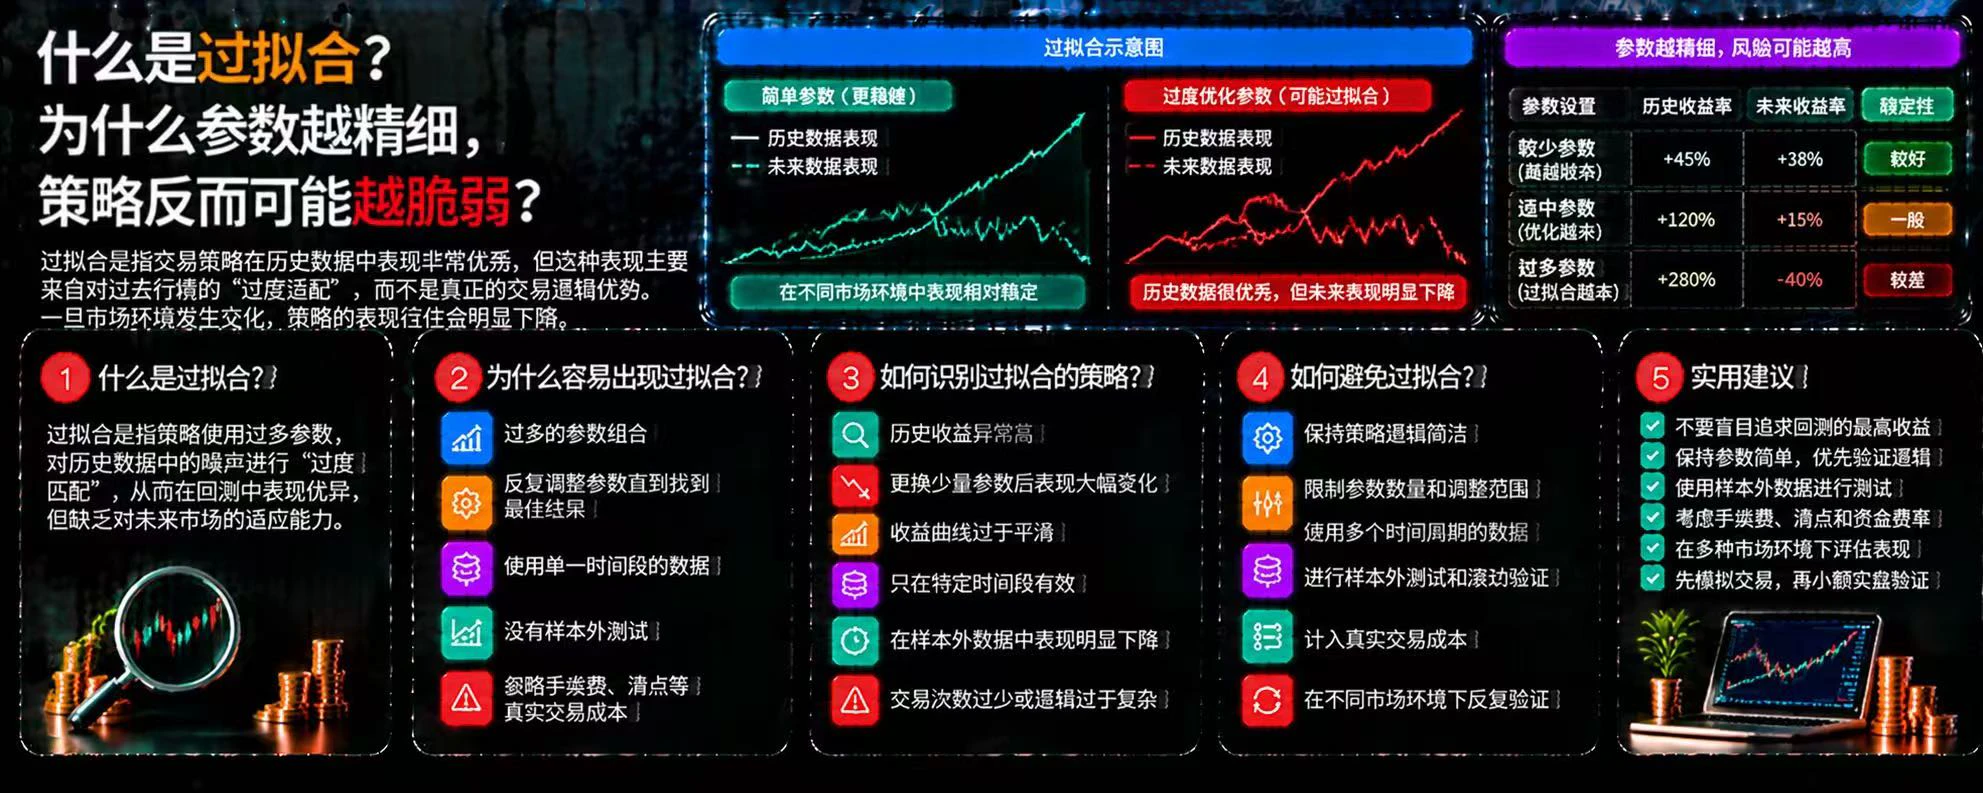
What Is Overfitting? Why Can More Fine-Tuned Parameters Make a Strategy More Fragile?
In cryptocurrency trading, some strategies show increasingly high historical returns and increasingly attractive backtest curves after repeated parameter adjustments. However, once they enter the real market, their performance may deteriorate rapidly. A common reason behind this is overfitting.
First, what is overfitting?
Overfitting occurs when a strategy adapts too closely to specific fluctuations and coincidental patterns in historical data, causing it to perform well in the past but lack the ability to ad
post-image
Bitcoin is holding steady at elevated levels and absorbing selling pressure this time, unlike previous rallies that quickly faded; buyers are providing strong support. The 90-minute MACD is bearish at high levels, and with nonfarm payrolls tomorrow, volatility will increase. $BTC $ETH
post-image
BTC-0.67%
ETH-1.26%
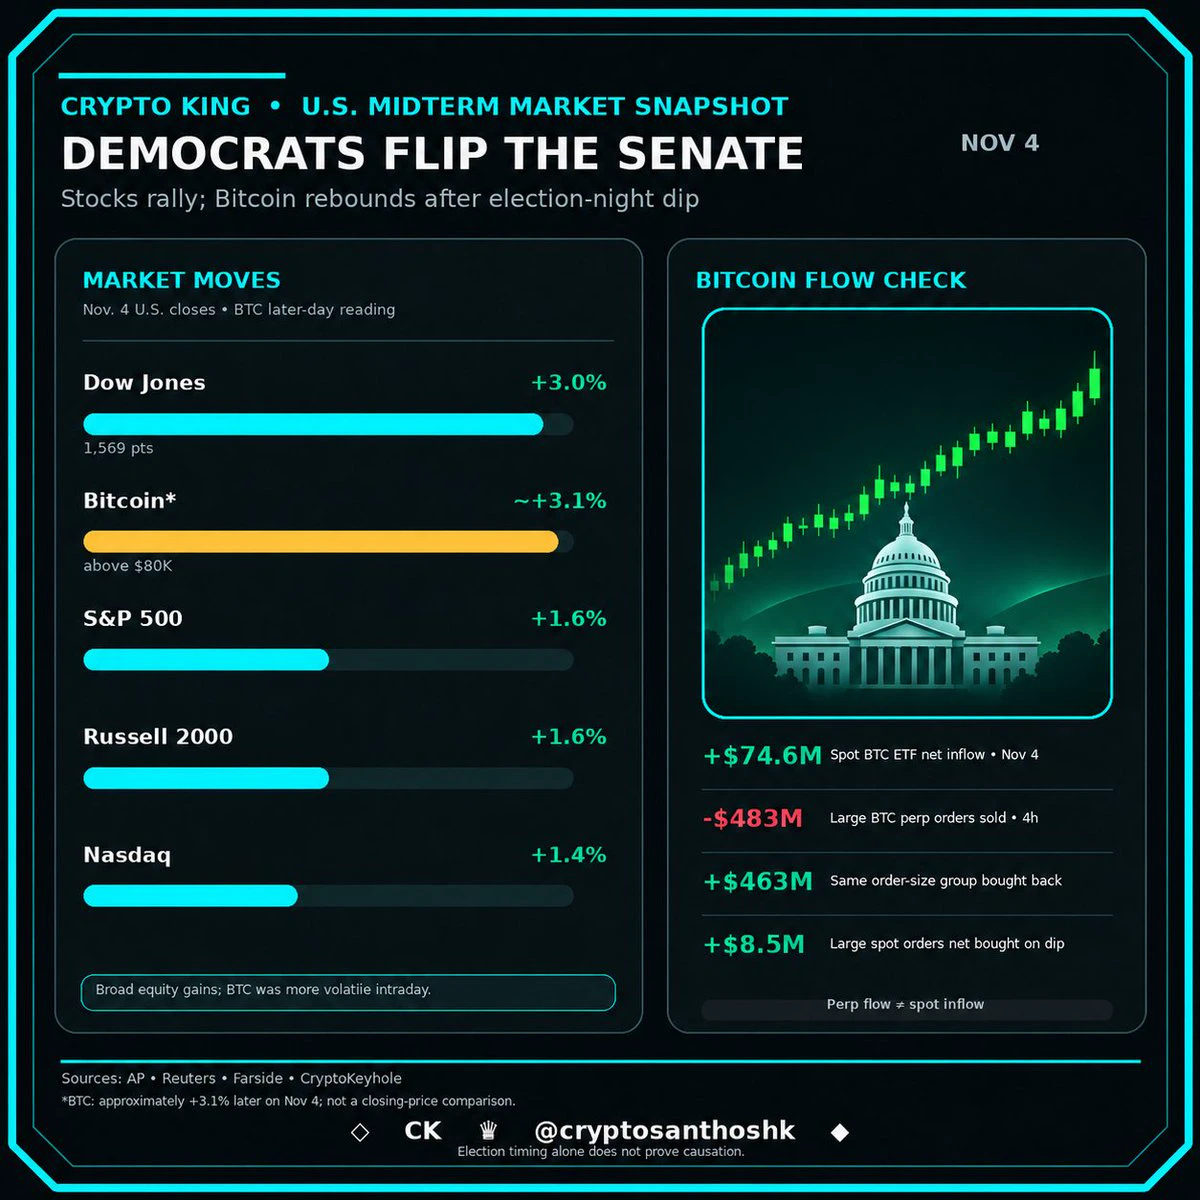
The results of democrats winning the senate elections?
Outcome is absolutely shocking. Here is how the markets reacted:
post-image
What is the funding rate? Why can perpetual contracts continue to incur holding costs even when the price has barely changed?
In cryptocurrency trading, many people focus only on price movements after opening a position and overlook the funding rate. For perpetual contract traders, even if the price stays flat for a long time, holding a position may still generate additional costs or income as long as the funding rate is non-zero.
First, what is the funding rate?
The funding rate is a mechanism in perpetual contracts through which longs and shorts periodically pay fees to each other, helping k
post-image
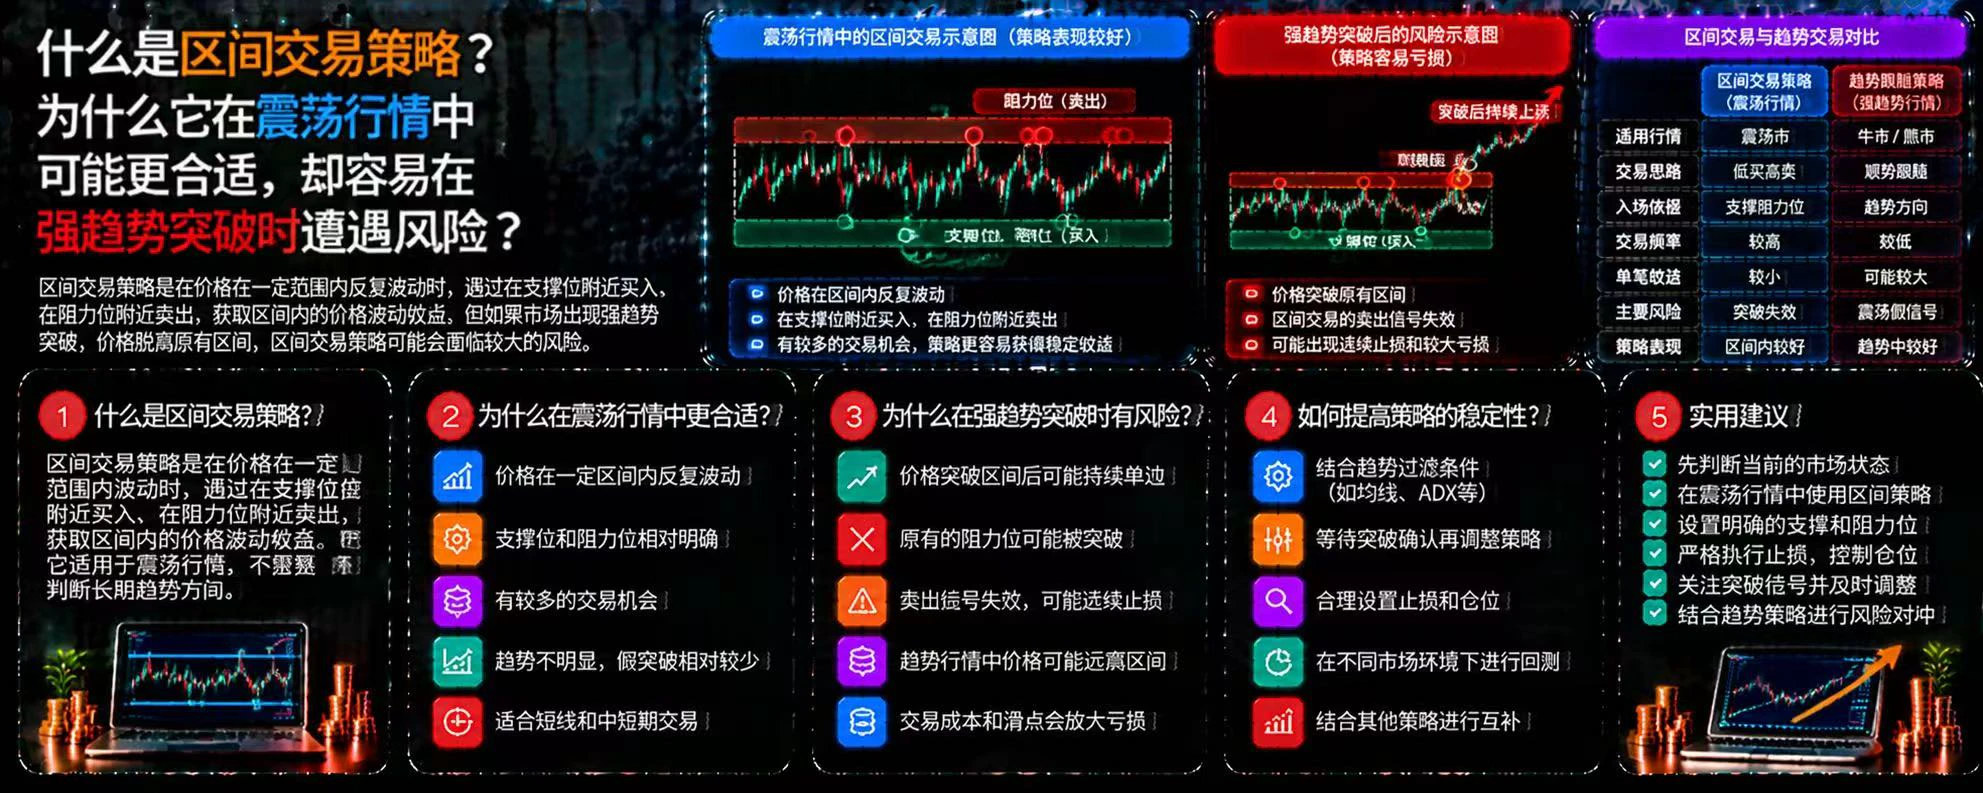
What Is a Range Trading Strategy? Why Might It Be More Suitable in a Sideways Market, Yet Risky During a Strong Trend Breakout?
In cryptocurrency trading, prices do not always move steadily up or down. When the market lacks a clear direction and prices repeatedly fluctuate within a certain range, a range trading strategy may be useful. But once the price truly breaks out of the range, the original trading logic may quickly become invalid.
First, what is a range trading strategy?
Range trading involves identifying support and resistance zones where prices repeatedly fluctuate, looking for buyin
post-image
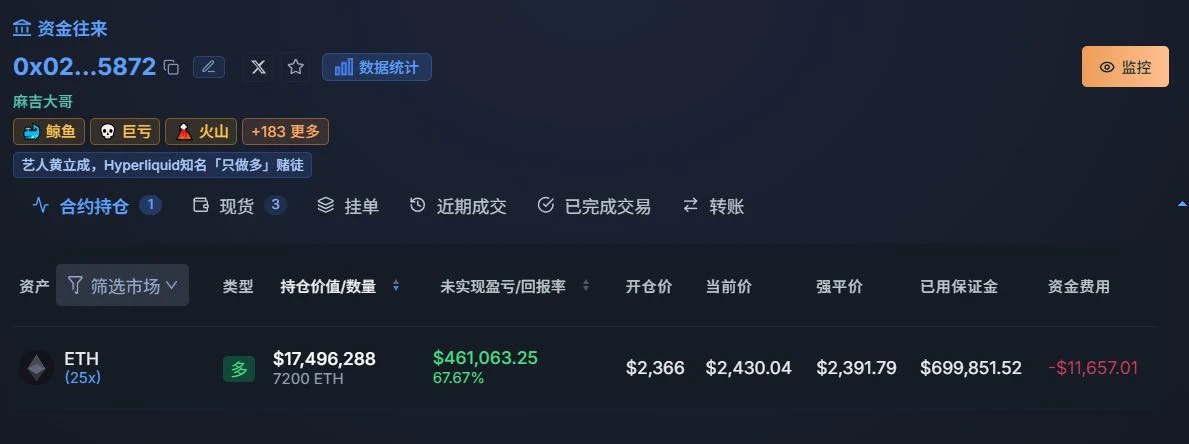
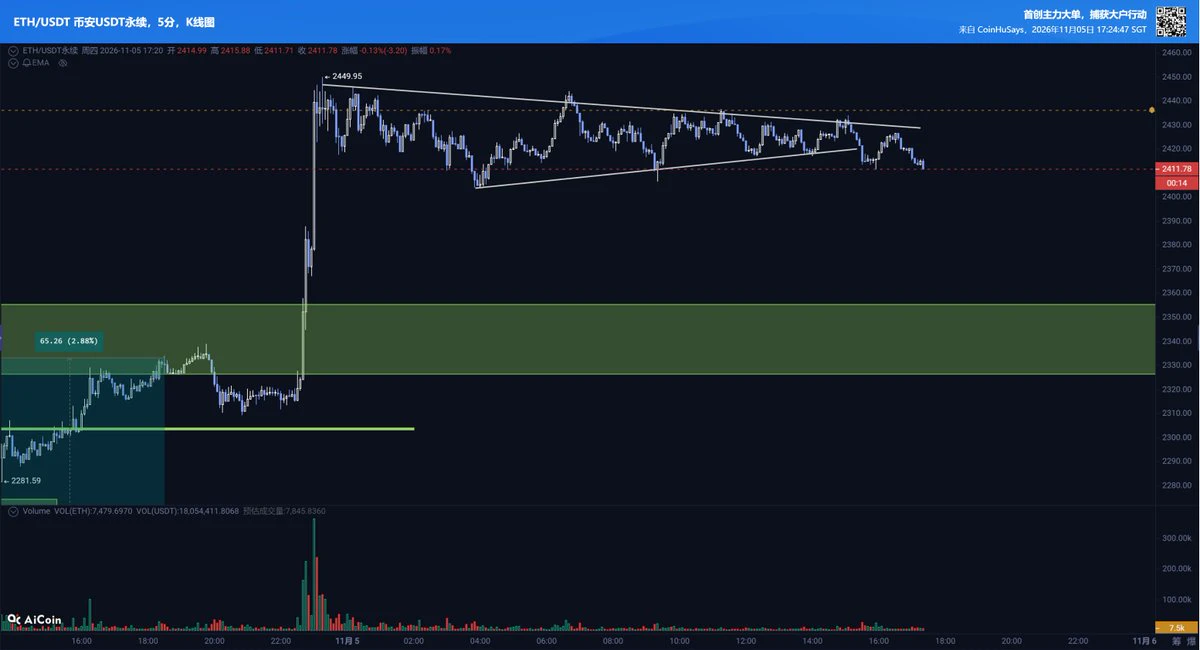
Machi Big Brother is making a killing again!
He’s not only going long but also adding to his position, increasing from over 2,000 contracts to nearly 6,700 with 25x leverage. His latest average entry price is 2366, and unrealized gains have topped $460k, but his liquidation price has also been pushed up to 2391.
Big Brother is charging ahead with total confidence, but I’m actually not very optimistic about this move in the short term. I recommend positioning for shorts near 2450.
The reason is simple:
This rebound after the election results came in looks more like a short squeeze following the
post-image
ETH-1.23%
What is the market trading now?
AI, the dollar, and U.S. Treasuries, which should be bearish, and gold and silver, which should be bullish, have basically all risen.
Risk assets—Bitcoin and the Nasdaq—also rose 2%~3% yesterday on the day of the great uprising.
Semiconductors continued to fall.
The market is currently in a quiet period. What is it trading? Nothing much.
It’s just pure positioning warfare.
After rising too much, it has to fall. That’s all.
Opened a small short position on Ethereum. ethereum:native
post-image
GLDX-0.40%
PAXG+0.37%
XAU+0.38%
XAG+0.47%
What Is the Sharpe Ratio? How Can You Measure Whether a Trading Strategy’s Returns Are Worth the Risk?
In cryptocurrency trading, a high return does not necessarily mean a strategy is good. If a strategy can generate high returns but comes with sharp volatility and significant drawdowns, we need to assess whether those returns are worth the risk. The Sharpe ratio is one tool that can help answer this question.
First, what is the Sharpe ratio?
The Sharpe ratio measures the excess return earned by a portfolio or trading strategy per unit of volatility risk. Generally, a higher value indicates be
post-image
🔹Chip Stocks Are Falling, but Demand Hasnt Weakened? With Democratic Regulatory Expectations Shakin
live-cover
LIVE1,758
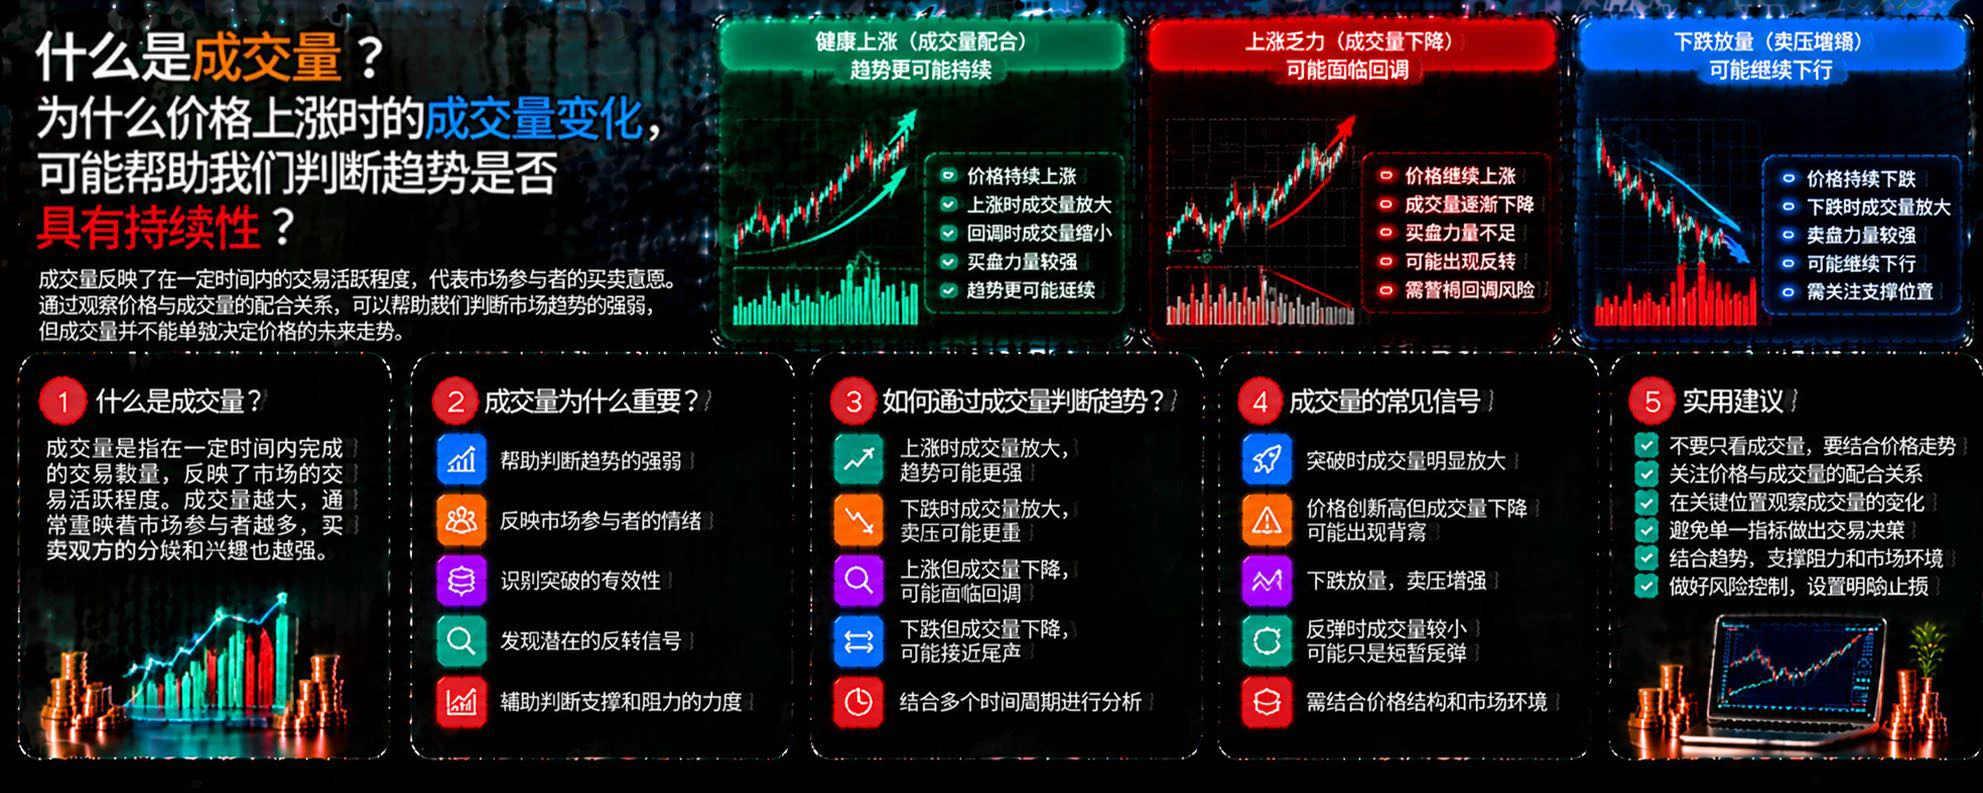
What is trading volume? Why can changes in volume during a price increase help us judge whether the trend is sustainable?
In crypto trading, price tells us which direction the market is moving, while volume helps us understand the level of trading activity behind that move. Analyzing the two together is more useful than looking at price alone, but volume cannot directly predict future movements.
First, what is trading volume?
Trading volume refers to the amount of an asset or the value of trades executed within a specific period. An increase in volume usually means market participation is risi
post-image
Bro, how much pressure do you wake up carrying every day?
post-image
$BTC $ETH This 15-minute support
is still holding pretty firm
The two large positions haven't moved
Did a bit of other trading
to stay in practice
If it really can't break below the 15-minute support
I'll consider reducing my position a bit
#非农就业数据
BTC-0.67%
ETH-1.26%
What Is the Sharpe Ratio? How Do You Measure Whether the Returns from a Trading Strategy Are Worth the Risk?
In cryptocurrency trading, a high return does not necessarily mean a strategy is good. If a strategy can generate high returns but comes with sharp volatility and significant drawdowns, we need to assess whether those returns are worth the risk involved. The Sharpe ratio is one tool that can help answer this question.
First, what is the Sharpe ratio?
The Sharpe ratio measures the excess return earned by a portfolio or trading strategy per unit of volatility risk. Generally, the higher t
post-image
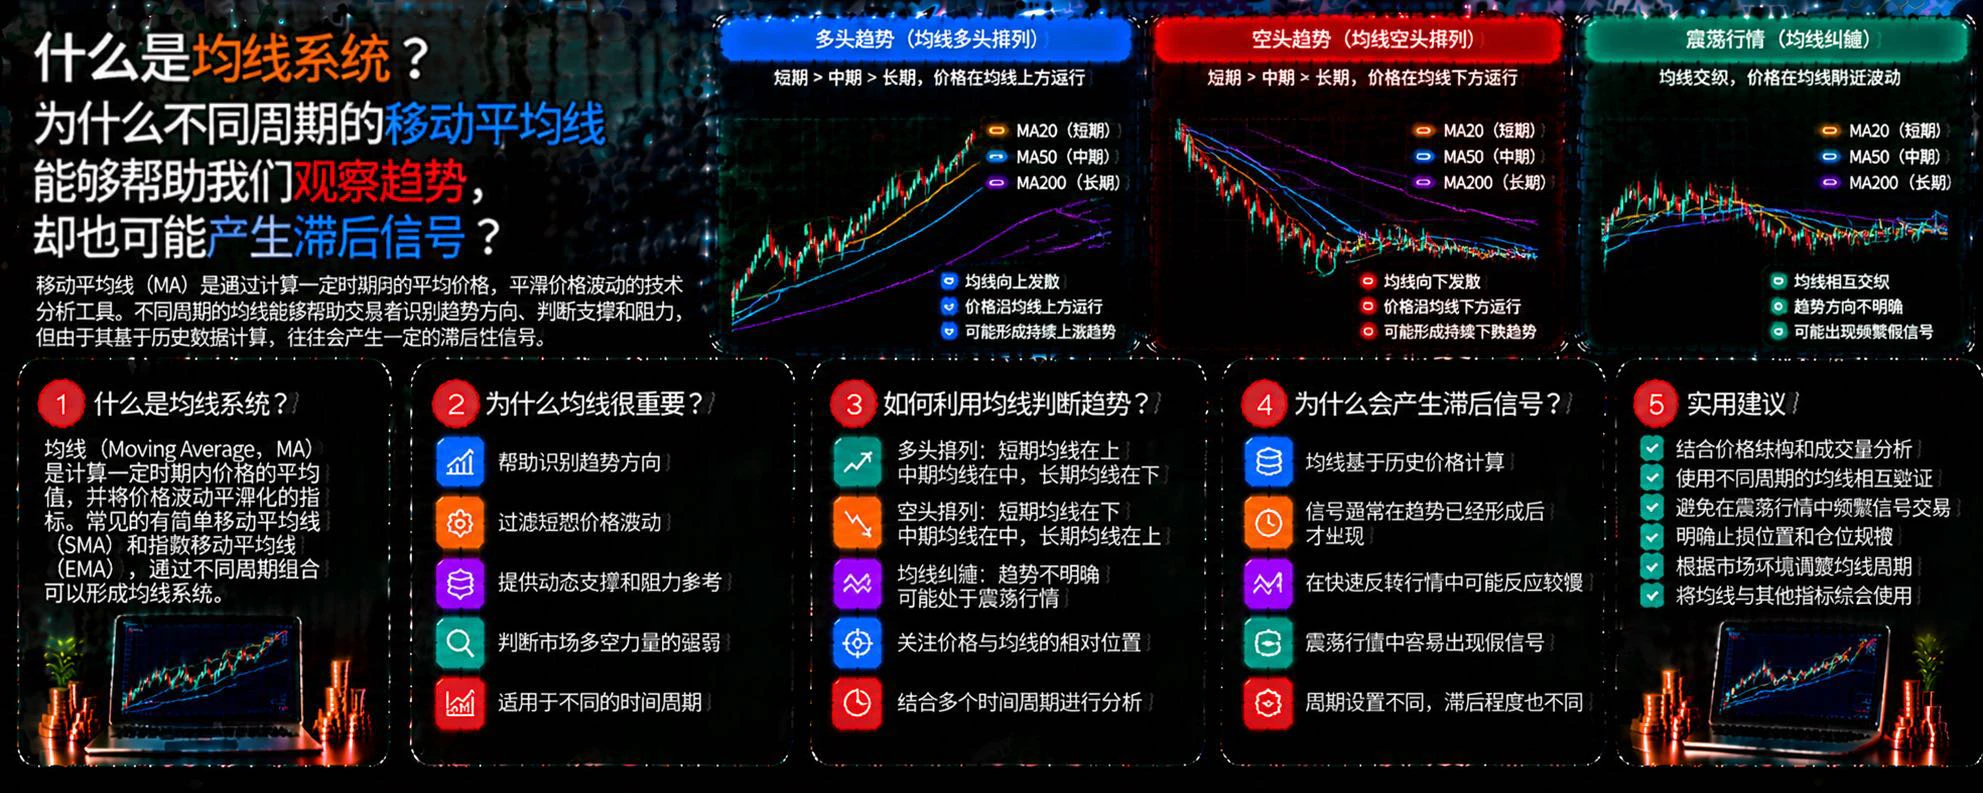
What is a moving average system? Why can moving averages with different periods help us observe trends, yet also produce lagging signals?
In cryptocurrency trading, prices fluctuate every day, and short-term ups and downs can easily cloud judgment. By calculating the average price over a given period, moving averages help traders observe market direction. However, because moving averages are based on historical prices, they are better suited to helping identify trends than to accurately predict the future.
First, what is a moving average system?
A moving average (MA) is a curve formed by avera
post-image
Load More

Join 40 M users in our growing community

⚡️ Join 40 M users in the crypto craze discussion

💬 Engage with your favorite top creators

👍 See what interests you

Trending Topics

GateLaunchesPoSECProofOfSecurity

543 Views455 Discussing

Gate has officially launched Proof of Security, or PoSEC, extending beyond Proof of Reserves by disclosing the distribution of cold-storage and hot-wallet assets and introducing a cold storage coverage ratio to measure protection under extreme-risk scenarios. Gate’s latest cold storage coverage ratio stands at 104.58%, with 88.26% of assets in cold storage and 11.74% in hot wallets. A coverage ratio of at least 100% means cold-storage assets alone would still be sufficient to cover all user assets even if hot-wallet assets were fully lost. Exchange security is not only about whether reserves are sufficient, but also how assets are stored and protected under extreme conditions. Could cold storage coverage become a new industry standard?[👉 Learn more](https://gate.com/proof-of-security)

BTCBackAbove80K

51.64k Views41.29k Discussing

DemocratsWinBothChambers

20.49k Views462 Discussing

View More