



Square
Following
Hot
News
Notifications
Profile
Share your thoughts
placeholder
Article
#每周来晒 #广场交易达人 #WCTCS9 #美股财报季
Nvidia Trading Plan for Next Week

As the leading AI tech stock, Nvidia saw a significant decline last week. On the daily chart, it also fell on heavy volume Thursday and rebounded on lighter volume Friday, showing a clear continuation pattern in the downtrend. Technically, it has already broken below an important support level on the weekly chart, with no support below. On the monthly chart, it is now testing support at 180. I think it will most likely find a bottom between 170 and 180, with limited downside. I don't recommend shorting at this level; the focus sh
post-image
NVDA+2.80%
#CPI数据前瞻 #Gate股票畅聊季 October CPI will be released at 9:30 p.m. Beijing time on November 10, and is the last inflation report before the December rate meeting. U.S. stocks have fallen for four consecutive weeks, and this report is likely to significantly amplify market volatility. Interest rate futures currently price in nearly an 80% chance of a December rate hike.

CPI will determine which way that probability moves:
Higher than expected: The probability of a rate hike could climb above 90%, with the Nasdaq and semiconductor stocks under the most pressure.
In line with expectations: The probab
NDAQ+0.28%
Trenches
ZIG
Z
bade
b
ZIG
0x8c...1145
Market Cap
$.
Change
.
24h Vol
$.
Holders
.
STONK
S
bade
b
STONK
6GmA...UNgx
Market Cap
$.
Change
.
24h Vol
$.
Holders
.
CLAUDIA
C
bade
b
CLAUDIA
2j5S...W2ZM
Market Cap
$.
Change
.
24h Vol
$.
Holders
.
IDOL
I
bade
b
IDOL
0x3b...ab07
Market Cap
$.
Change
.
24h Vol
$.
Holders
.
FLOAT
F
bade
b
FLOAT
Bv1a...BMmr
Market Cap
$.
Change
.
24h Vol
$.
Holders
.
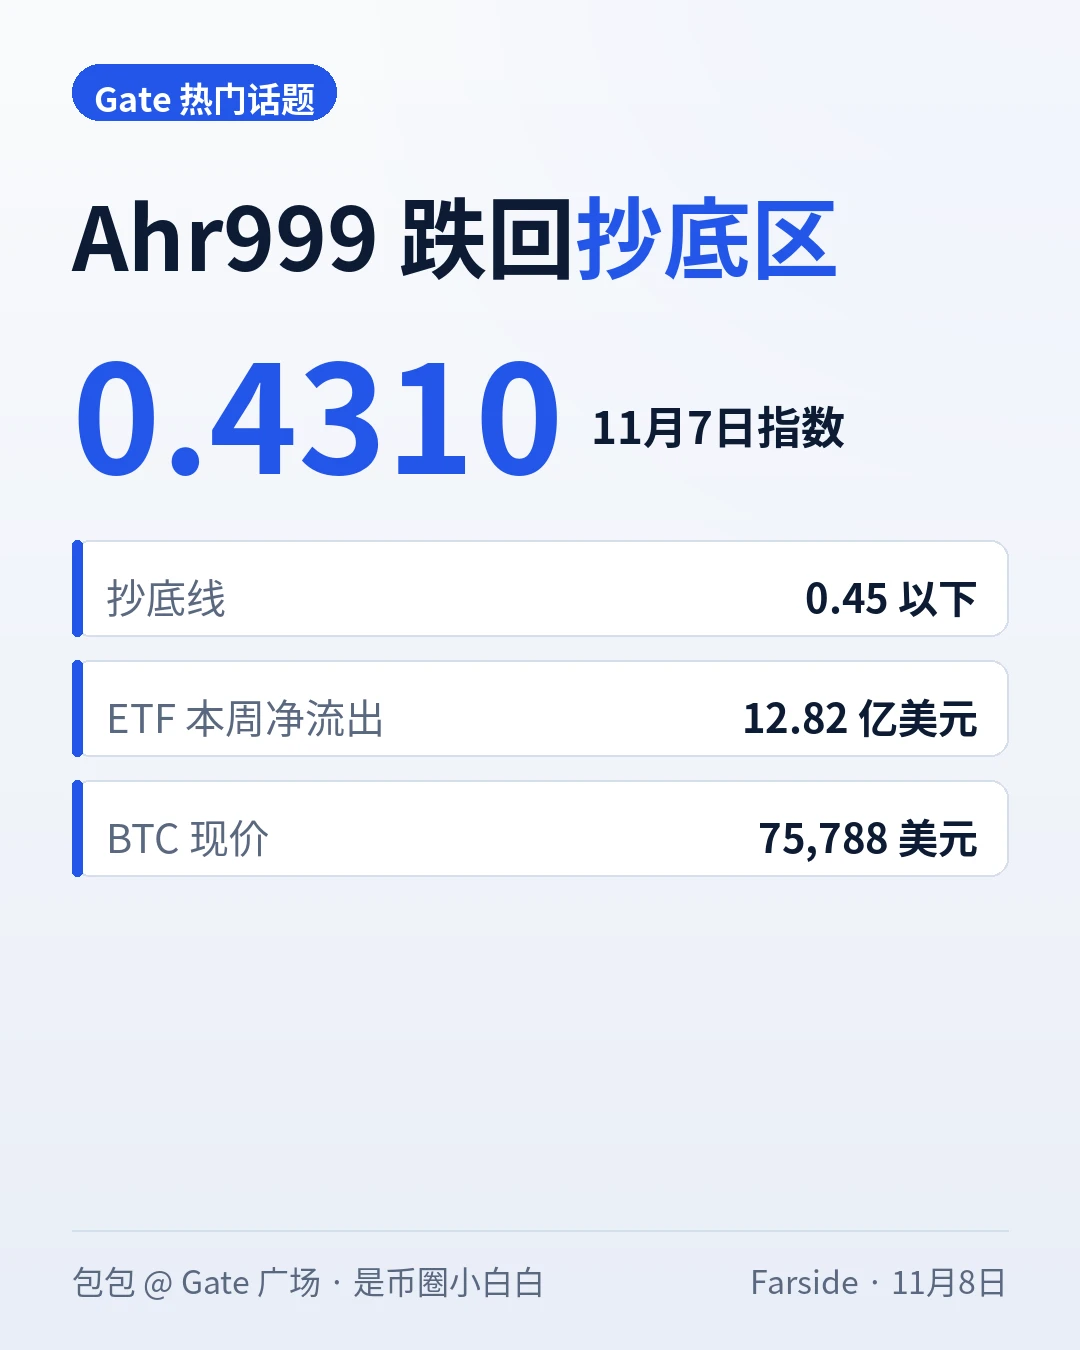
Ahr999 has fallen to 0.4310, back in the accumulation zone—but don’t rush to go all in. #Ahr999跌入抄底区间

First, what is this indicator? Ahr999 is a longtime tool for HODLers, designed to help people dollar-cost average gauge market levels: below 0.45 is the accumulation zone, 0.45 to 1.2 is the DCA zone, and above 1.2 is the overvalued zone. Yesterday (November 7), it came in at 0.4310, below the 0.45 accumulation threshold.

Why the warning not to rush? The accumulation zone lighting up doesn’t mean the bottom is in. From May 29 to August 19 this year, the indicator stayed below 0.45 for 82 st
post-image
BTC-0.67%
BLK+0.60%
#ARB

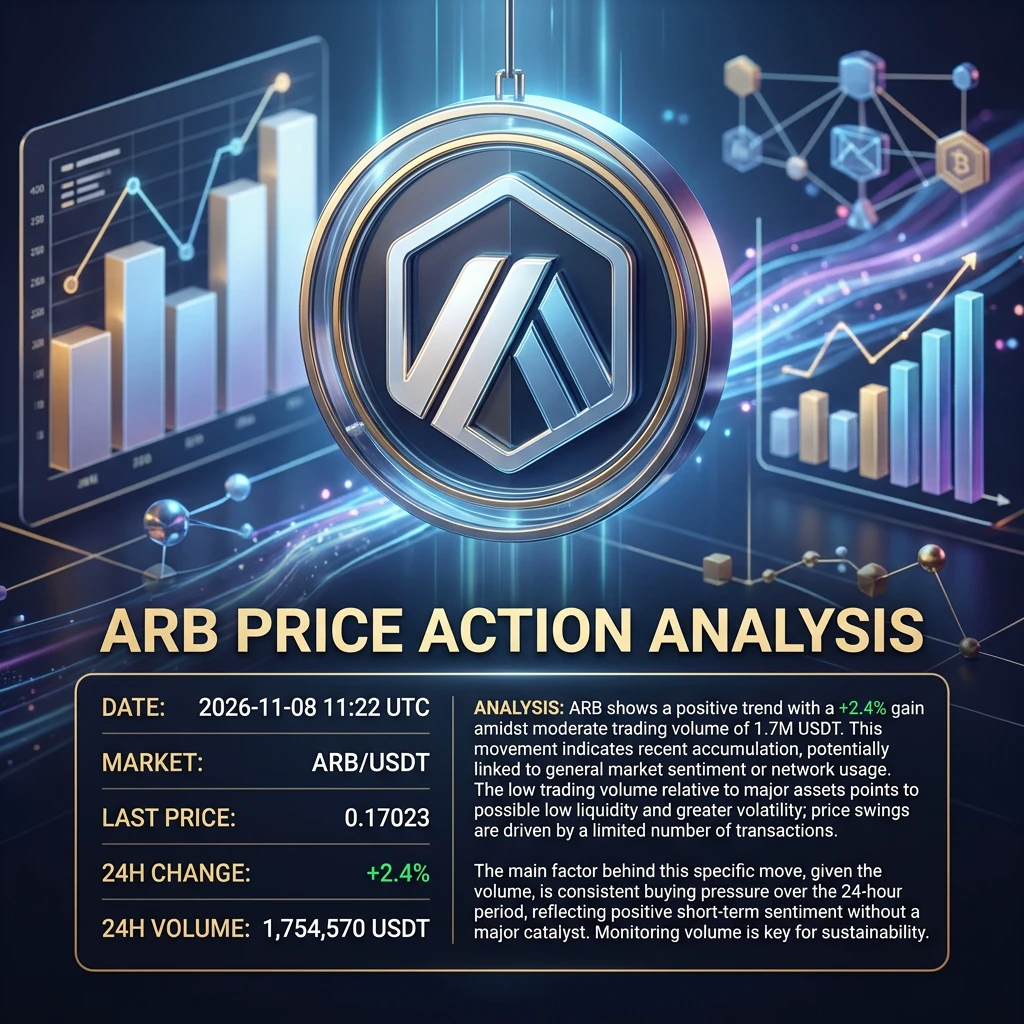
ARB Gains 2.4%: A Positive Move Does Not Always Mean a Stronger Market

A Common Market Myth

A green candle means buyers are taking control, and a rising price means a cryptocurrency is becoming stronger. This is one of the most common misunderstandings in crypto markets.

ARB provides a useful example of why investors should look beyond the colour of a chart. On November 8, 2026, ARB/USDT was trading at 0.17023 USDT, showing a 2.4% increase over 24 hours. Its reported 24-hour trading volume was approximately 1,754,570 USDT.

The move is positive, but the bigger question is whether it
post-image
ARB+1.17%
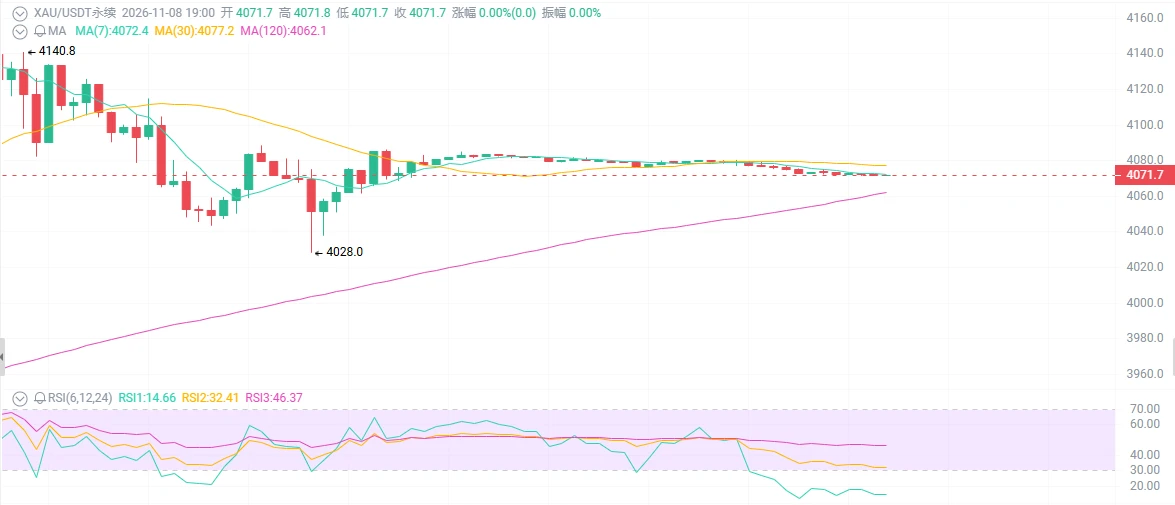
$4,070 gold, and you're still waiting for it to break below $4,000?
Nonfarm payrolls blow past expectations at 165,000, rate hike odds surge to 80%, the dollar climbs above 102—everyone says, “Gold is finished; it’s going to break below $4,000.” Just now, gold surged from 3,870 to 4,140, then plunged back to 4,070, with bulls and bears battling fiercely around the 20-day moving average. Is this rally over, or is this a buying-the-dip window?

First, the surface picture: bad news is piling on, but gold just won’t break below $4,000.

On November 6, nonfarm payrolls rose by 165,000, far above th
post-image
BTC-0.67%
ETH-1.26%
XAU+0.38%
$SOL ‌
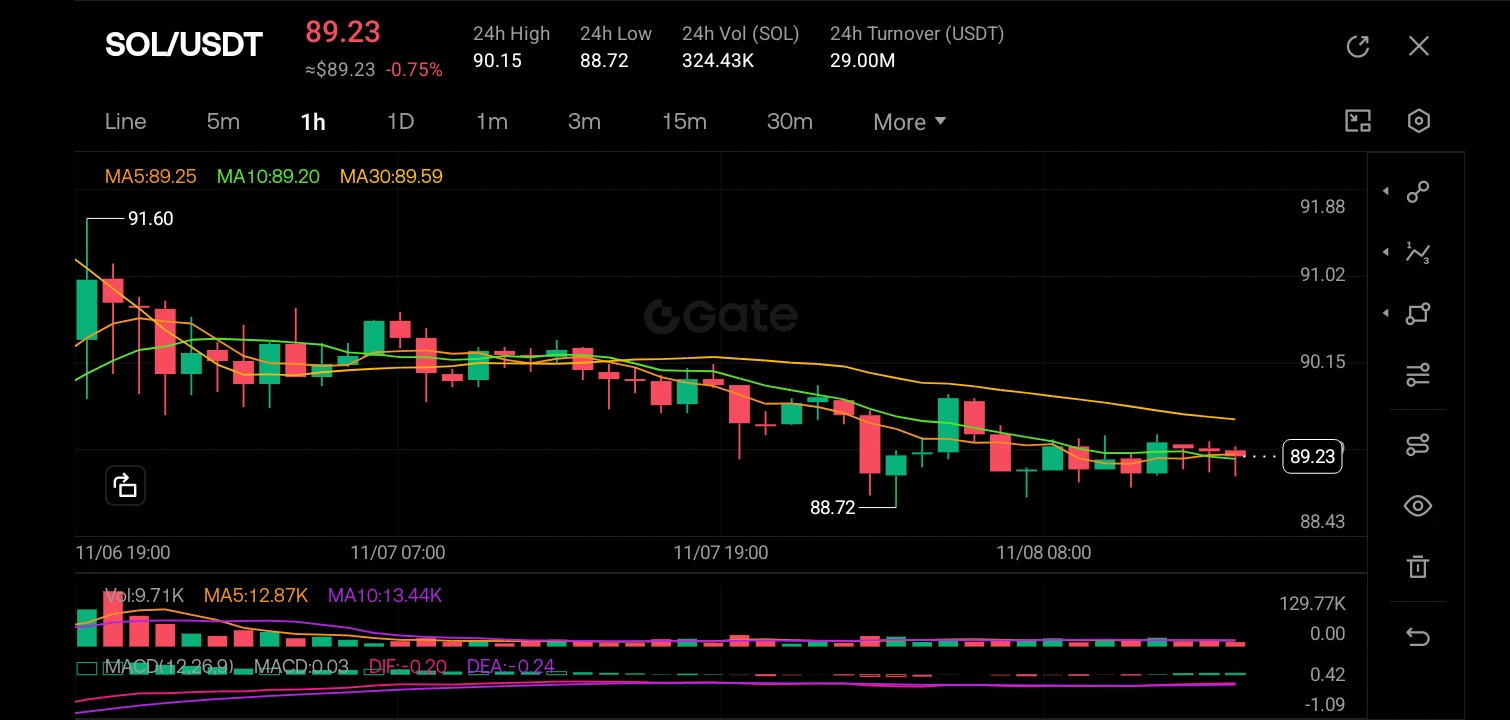
The SOL/USDT 1H chart reveals a prevailing downtrend that has recently hit a floor, currently trading at 89.23 with a -0.75% loss for the session; the price is trading below the long-term MA30 (89.59) which acts as dynamic resistance, while the shorter MAs (MA5 at 89.25 and MA10 at 89.20) have flattened out and are crossing, suggesting the aggressive selling pressure has exhausted itself. The MACD is displaying a potential bullish convergence, with the DIF (-0.020) crossing above the DEA (-0.024) and the histogram turning positive (green), indicating that despite the price being low, d
post-image
SOL-0.77%
  • 2
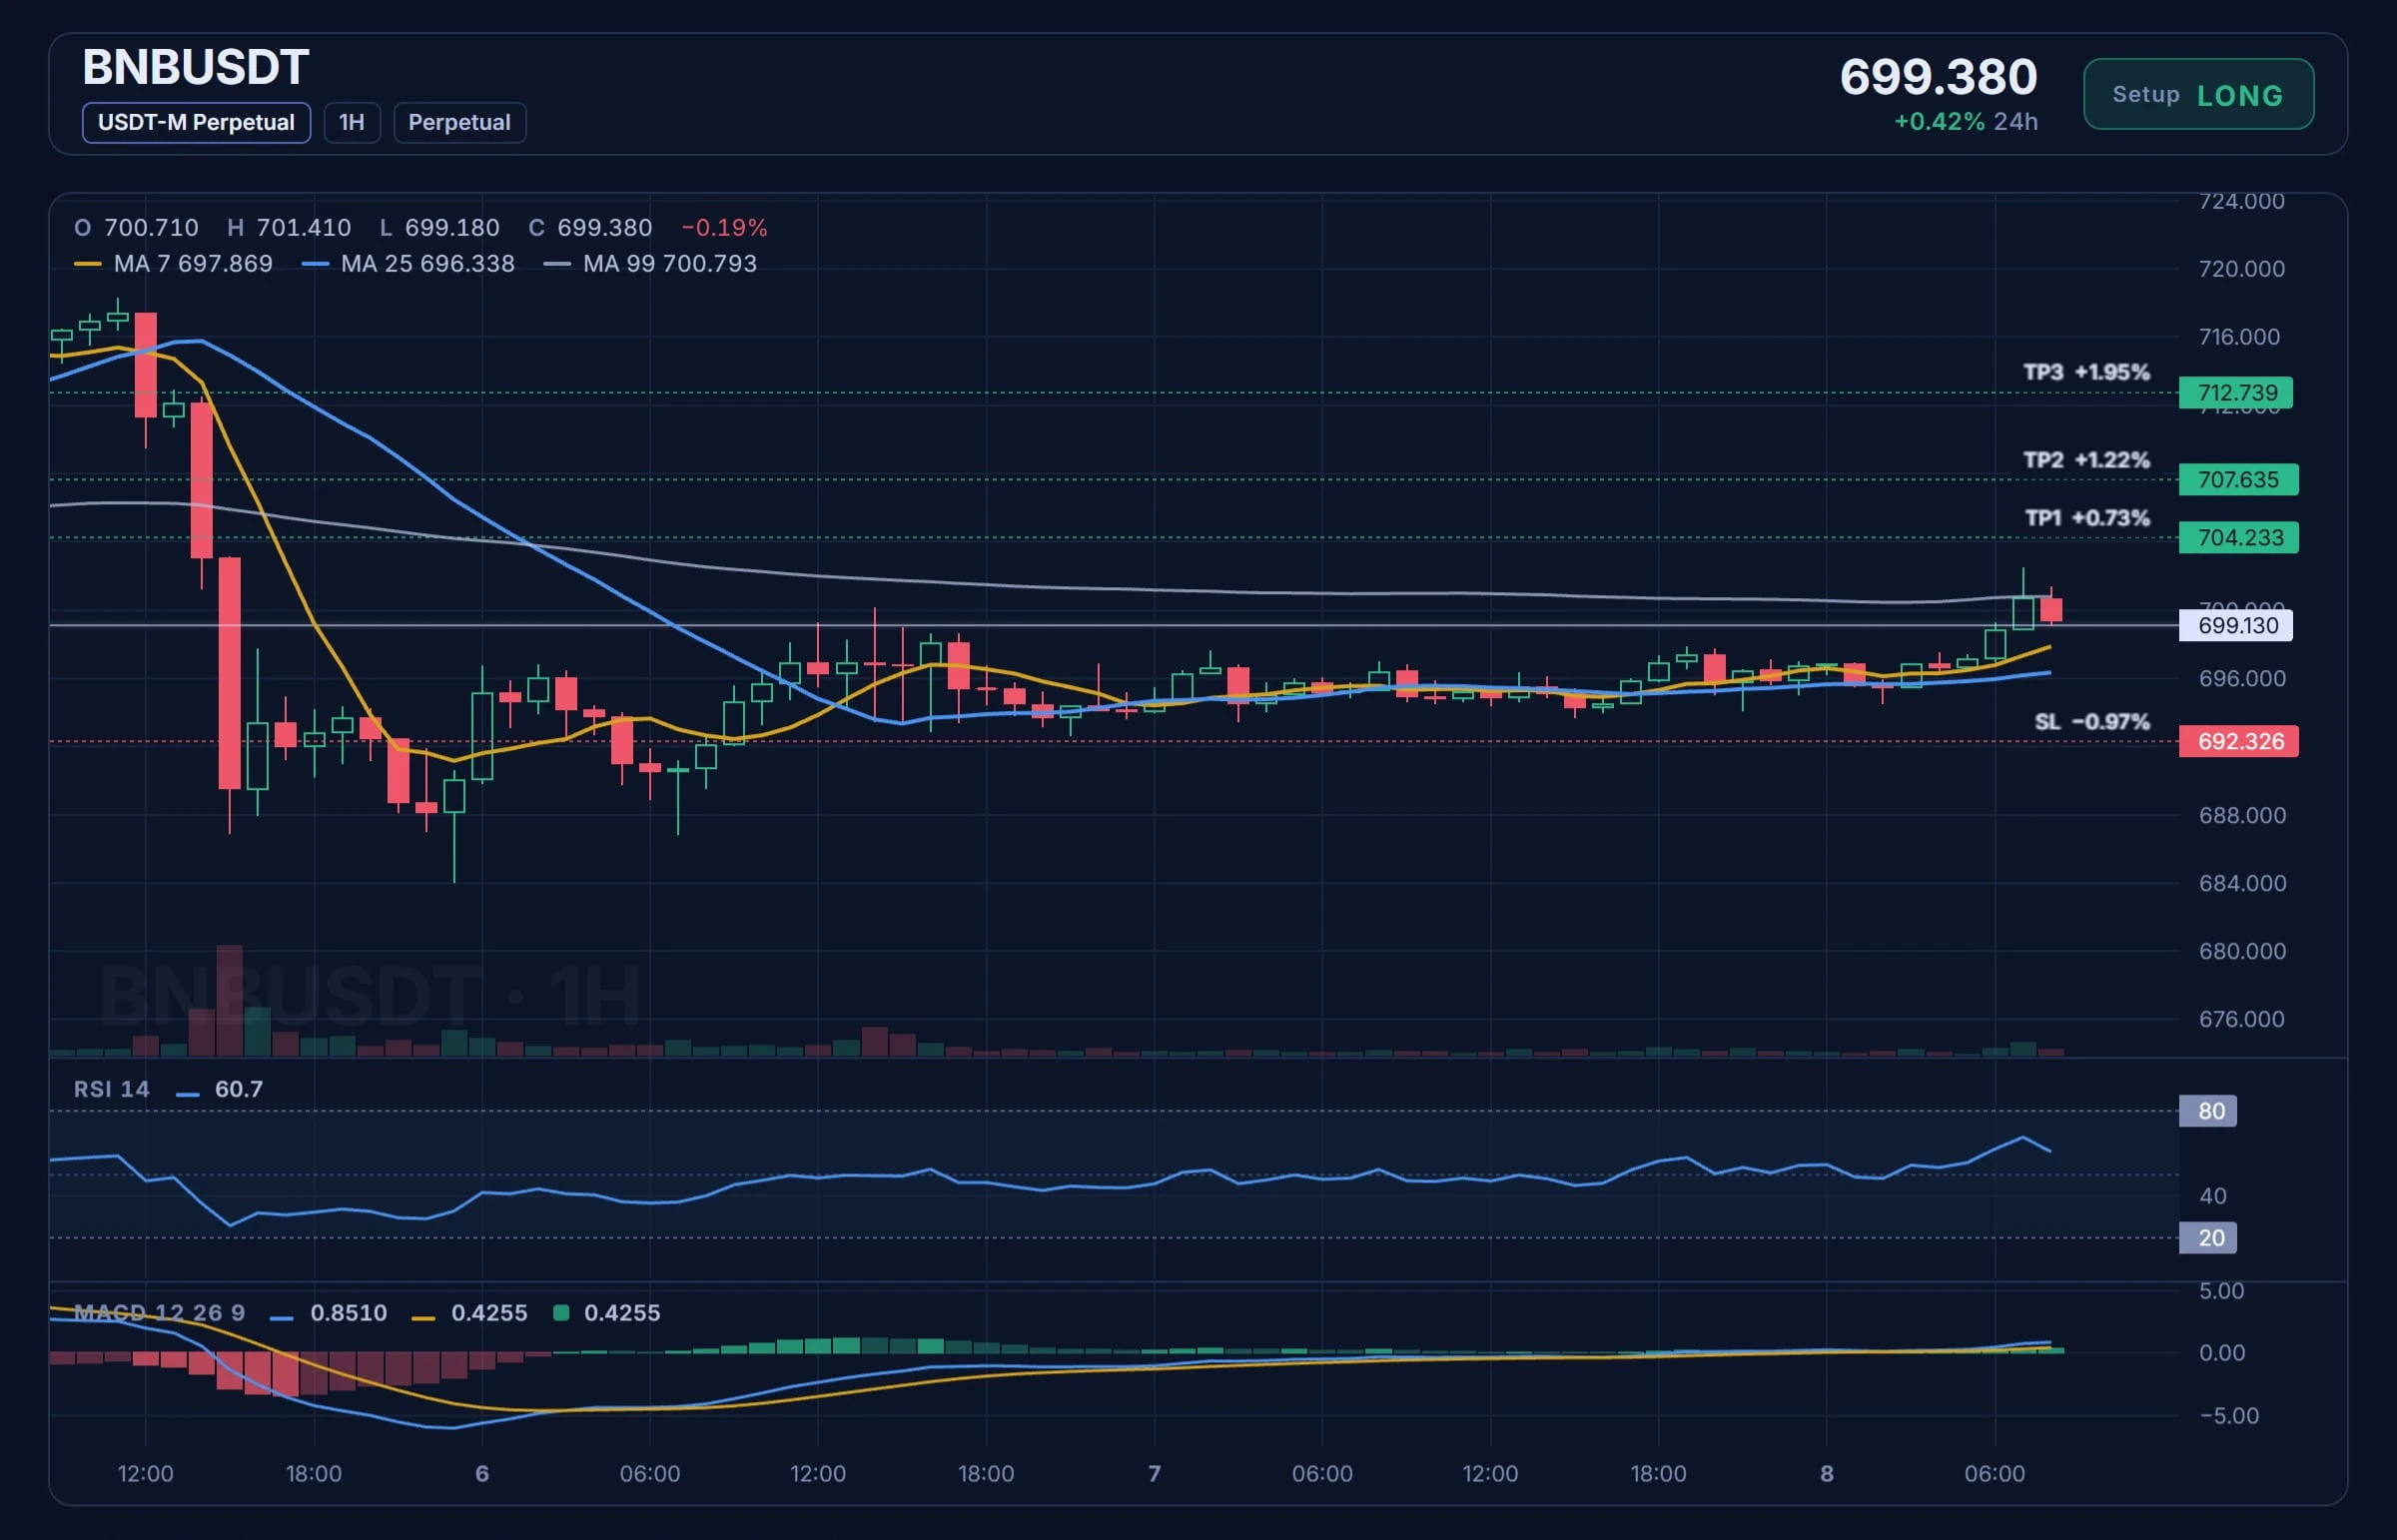
BULLS ARE TAKING OVER $BNB USDT Long Setup is Live

$BNB /USDT

Direction: LONG

Entry Zone: 699.130

Take-Profit Targets
🔹 TP1: 704.233
🔹 TP2: 707.635
🔹 TP3: 712.739

🛑 Stop-Loss: 692.326

$BNB ‌#weeklyshare
post-image
BNB-0.72%
DAILY MARKET MOVE
live-cover
LIVE1,812
$KOMA ’s price action is forming a fairly typical bullish continuation pattern, with the price moving upward in a stair-step fashion while trading volume expands and open interest continues to rise. This combination usually indicates an increased likelihood of liquidity above being swept. My current plan is to wait for the breakout setup to develop further—specifically, I’d like to see the price make another smooth test of the previous high, followed by some local consolidation below the high. If the technical structure develops as expected, I’ll consider entering. I’m placing the first local
post-image
KOMA-4.07%
Latest Northern Ireland poll: The Alliance Party is sliding and could lose half its seats in the Assembly. A centrist party being squeezed from both sides—that’s the most dangerous part. Save this, and come back tomorrow to see if it holds up.
Keep an eye on it.
Ireland
post-image
#WCTCS9 #广场交易达人 Gold bulls and bears battle; crude oil consolidates and recovers

Spot gold: Gold formed a volatile pattern this week, rebounding from its lows before rallying and then pulling back. The weekly candle had a long upper wick, showing that buying support remains at lower levels, while selling pressure overhead is also significant.
Spot gold is currently consolidating near $4,070/oz. After dipping to around 4,029 intraday on Friday, it rebounded, with bulls and bears locked in a short-term tug-of-war.
Gold remains driven in the short term by interest rate expectations and the dolla
CL-1.83%
  • 2
#CPI数据前瞻 #Gate股票畅聊季 October CPI will be released at 9:30 p.m. Beijing time on November 10, and is the last inflation report before the December rate meeting. U.S. stocks have fallen for four consecutive weeks, and this report is likely to significantly amplify market volatility. Interest rate futures currently price in nearly an 80% chance of a December rate hike.

CPI will determine which way that probability moves:
Higher than expected: The probability of a rate hike could climb above 90%, with the Nasdaq and semiconductor stocks under the most pressure.
In line with expectations: The probab
NAS100-0.07%
  • 4
Circle's Q3 earnings showed revenue of approximately $865 million, while on-chain USDC transaction volume grew nearly 49% year over year. The stablecoin sector is indeed heating up, and dollar-denominated liquidity in the market does not appear tight on the surface. However, BTC was still hovering around 75980 over the weekend, with a 24-hour range of roughly 74890 to 76380. Funding rates were near zero, and trading momentum was clearly weak.
What is really worth watching is the flow of funds: on November 6, U.S. spot BTC ETFs saw net outflows of about $412 million, including roughly $403 mill
post-image
ETH-1.26%
ZEC+1.16%
📝 Gate Square New Creator Rewards | 0.1 USDT Per Post & 2x Exposure 14 Days!
Earn up to 0.5 USDT daily. The more you post, the more you earn!

🏆 Congrats to yesterday's featured new creators:
@山樾峰途
@峡山最后的交易员
@200u做到10000u
Each wins a 100 USDT Position Voucher:

🚀 Start posting and enjoy exclusive perks and extra exposure!

Join Now 👉 https://www.gate.com/campaigns/6880
Campaign Details 👉 https://www.gate.com/announcements/article/102585

Gate_Square
📝 Gate Square New Creator Rewards | 0.1 USDT Per Post & 2x Exposure 14 Days!
Earn up to 0.5 USDT daily. The more you post, the more you earn!

🏆 Congrats to yesterday's featured new creators:
@山樾峰途
@峡山最后的交易员
@200u做到10000u
Each wins a 100 USDT Position Voucher:

🚀 Start posting and enjoy exclusive perks and extra exposure!

Join Now 👉 https://www.gate.com/campaigns/6880
Campaign Details 👉 https://www.gate.com/announcements/article/102585

repost-content-media
VIP GROUP NOW FREE FOR THE NEXT 60 MINUTES 🆓 🐋
Join now and enjoy the fast signals 🎯
Beautiful analyses are being shared, I want everyone to join.

Link friends limited to only the first 25 members⚠️
post-image
Glory days are here😂😂
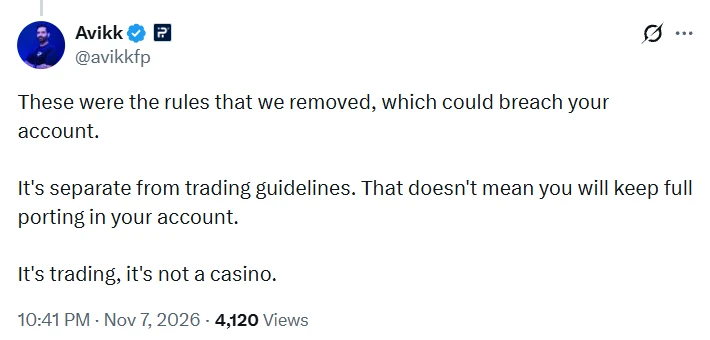
First they removed the rules, no risk per trade idea, then comes the ''Trading guidelines''.
Its not a ''casino'' but will they stop anyone from buying account who is blowing it by risking 3% or more.
Jig is up.
@Khldfx @avikkfp @fundingpips #FundingPips
post-image
Trump's close ally and right-wing political activist Laura Loomer posted! Fees usually range from $3,000 to $5,000. That's how politics works, and crypto is no different. Before reading a post, consider whether it was paid for.
post-image
Load More

Join 40 M users in our growing community

⚡️ Join 40 M users in the crypto craze discussion

💬 Engage with your favorite top creators

👍 See what interests you

Trending Topics

USCPIDataIncoming

6.81k Views1.56k Discussing

The U.S. October CPI report will be released on November 10 at 8:30 a.m. ET. September CPI came in at 3.7% year over year, and markets will be watching closely for signs that inflation is cooling, especially in core CPI. A softer-than-expected reading could strengthen rate-cut expectations, while hotter inflation may pressure risk assets through higher Treasury yields and a stronger dollar. How do you think this CPI print will move $BTC, U.S. stocks and gold?

USAIStocksHitHard

26.34k Views3.72k Discussing

USNonfarmPayrolls

48.5k Views4.46k Discussing

View More