

Share your thoughts
placeholder
Article
$ETH Signal】4H bullish expansion + 1H pullback for a long entry
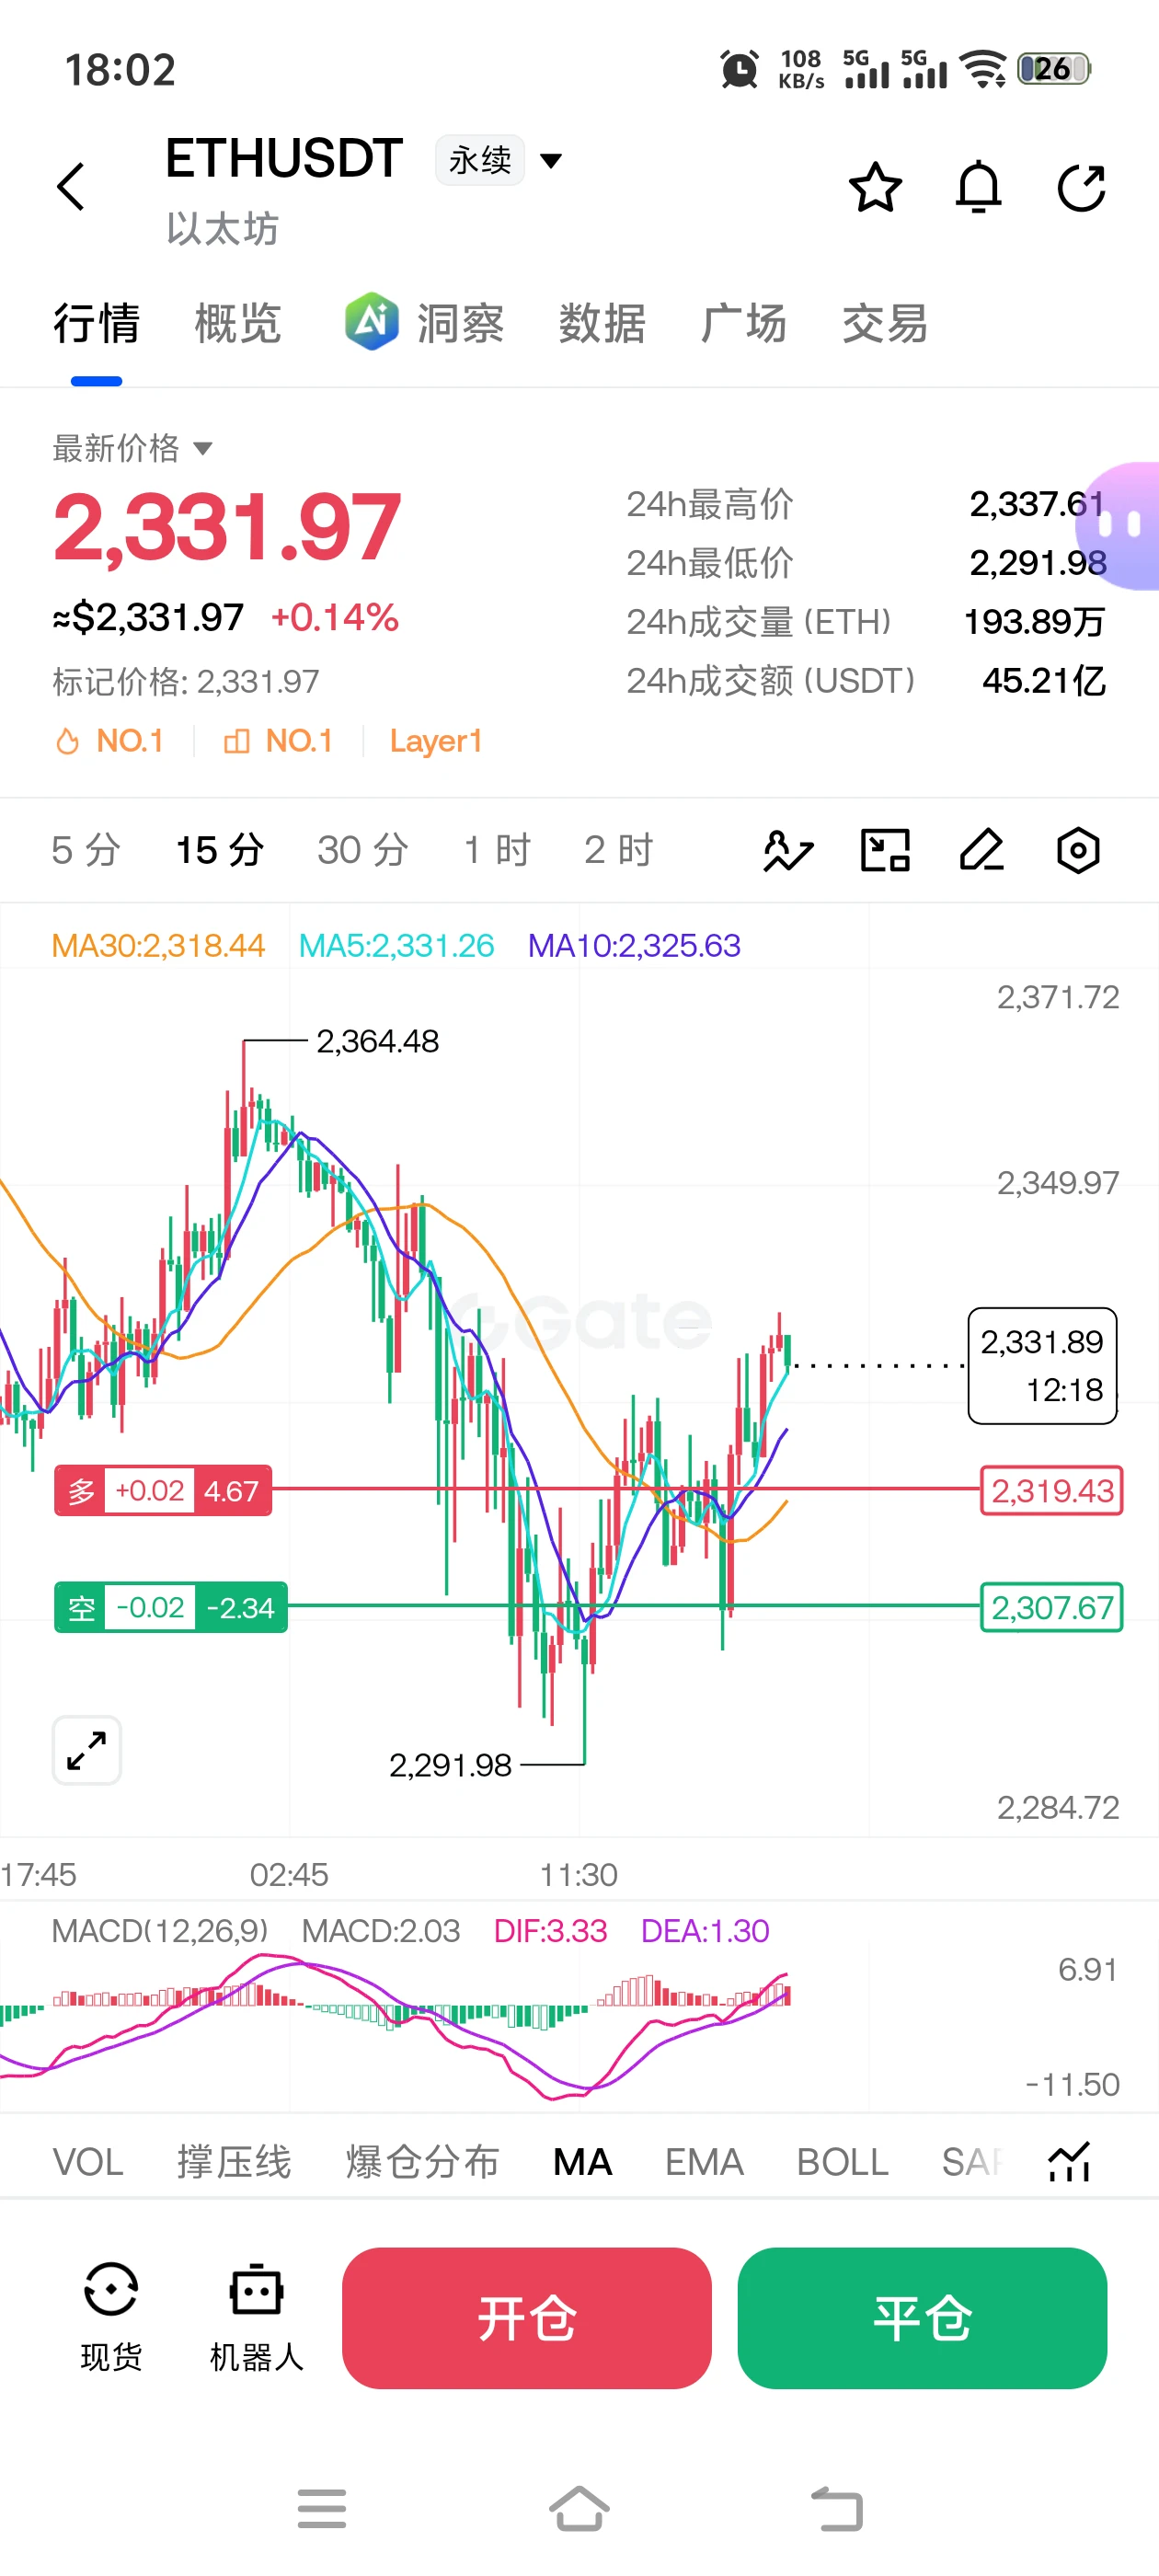
$ETH Pullback confirmation after the 1H breakout, with the 4H MACD bullish histogram expanding to 9.5016; the current price of 2570 is holding near the 1H Bollinger upper band at 2597.53.
The order book bid/ask ratio is 1.36, depth imbalance is +15.10%, and bids are densely placed below. The 1H RSI is 64.26, and the 4H RSI is 67.64. Hot-coin temperature remains acceptable, with the extreme overbought zone not yet reached. The 1H MACD histogram is contracting at 13.9415, indicating cooling short-term momentum. OI Stable, funding r
post-image
ETH+3.66%
#PI, are you an investor, are you planing to rise the market of pi? Show by like if you're an investor.
#PiNetwork
#Gateio
#Gate60MUsers
#GateMeme
post-image
PI-1.79%
BTC UPDATES
live-cover
LIVE1,956
#LAPTOPDown99%tFromPeak
LAPTOP Down 99% From Peak — What Really Happened?
LAPTOP has experienced one of the most extreme launch-to-crash moves in recent memecoin markets.
From the highest Gate print of $344.77 to around $0.853, LAPTOP has lost approximately 99.75% of its peak value. Other market trackers show different highs — around $316.75 on DexScreener and $199.51 on CoinGecko — but the bigger conclusion remains the same: almost the entire launch premium has disappeared.
The interesting part is not simply how far the price fell.
It is how the market reached $344.77 in the first place.
Fro
$ETH Signal】Long + pullback to 4H upper band support confirmation
$ETH After wicking to 2666, it gave back $122; the current price of 2543 is directly hugging the 4H Bollinger upper band at 2540.71.
The order book buy/sell depth ratio is 0.09, with extremely thick sell walls, yet the price has not been pushed down. The 4H MACD bullish histogram at 7.86 continues to expand, while the 1H histogram at 8.73 has started narrowing, showing divergent momentum across the two timeframes. The funding rate is lying at the floor at 0.0041%, while OI remains flat and leveraged longs have not accumulated.
post-image
ETH+3.66%
#AugustCPIDropsTonight
The August CPI Print Lands Today, And It Decides What September Looks Like For Crypto And Stocks
Today is the day. At 8:30 in the morning Eastern Time, which is about 5:30 in the evening in Pakistan, the US Bureau of Labor Statistics publishes the August Consumer Price Index, and this print matters more than most, because it is the last major inflation reading before the Federal Reserve meets on 15 and 16 September.
Consensus expects a headline increase of about 0.4 percent month over month and roughly 3.4 percent year over year, with core CPI, excluding food and energy
I didn’t do anything—just went to the restroom, and when I came back, the candlestick chart had already done the work for me. A few days ago, the afternoon market was still whipsawing back and forth. $LINK held on that pullback without breaking, and buying pressure was clearly getting stronger. I judged that this move wasn’t just a random bounce, so I said long positions could follow. Many people were still waiting on the sidelines at the time; I was only watching one thing: whether the pullback held or not.

From 11.416 to 11.734, +199.65% flashed straight onto the screen. That feels great,
post-image
LINK+0.45%
ADA-1.44%
BNB+1.95%
Insiders are calling this the most obvious short setup of the year on SUI.

$SUI /USDT - SHORT

Trade Plan:
Entry: 0.7364 – 0.7434
SL: 0.7731
TP1: 0.7150
TP2: 0.6985
TP3: 0.6736

Why this setup?
Why now? The daily trend is bearish, and the 1h price is sitting at 0.7399, right inside the entry zone where the 15m RSI reads 47.72, signaling fading momentum without yet confirming a reversal. The 1h ATR of 0.013813 tells us the recent volatility is compressed, which often precedes a sharp directional move, and our tight entry between 0.7364 and 0.7434 captures that explosive potential. The first
SUI-1.09%
#8月核心CPI超预期 🐺 At 1:30 a.m., the market is so quiet you can hear the breathing of pending orders.
These hours are when it’s easiest to make two mistakes:
1. Staring at a motionless chart and forcing yourself to see a direction
2. Getting a “flash of inspiration” in the middle of the night and wanting to place orders
Honestly, anything you can see clearly at this hour will still be clear during the day. Sleeping will earn you more than staring at the charts—a rule repeatedly proven.
📌 Weekend advice
• Liquidity is thin, so don’t take large positions
• Most overnight volatility is noise, not a
post-image
🎉 Up to 100 USDT per week! Gate Square’s “Weekly Share” is live!
There are market hot topics every day, weekly rewards for sharing posts, and multiple benefits waiting for you!
📌 How to participate:
① Sign up for the event 👉 https://www.gate.com/campaigns/6244
② Post with #每周来晒 and the official designated topic
③ Share original content such as crypto/stock market updates, trade reviews, token analysis, and strategy insights
🎁 Generous rewards are waiting for you
① Weekly points rewards: Earn points by posting, with up to 100 USDT
② Weekly TOP 10: Up to 300 USDT + VIP+1 trial card + creato
GT+0.32%
$22k a week keeps the 9-5 away $SPY
post-image
#GateEventPointsTop100 Institutional Money Did Not Leave, It Rotated: The ETF Flow Map Across BTC, ETH, SOL and XRP
Every headline this week said the same thing - crypto ETFs are bleeding. The aggregate number supports it: spot Bitcoin ETFs printed about $282.6M of net outflow in the prior session, with roughly $440M leaving across the week so far. But aggregate numbers hide the part that matters, which is where the money actually went. And the answer is not "out."
THE FULL FLOW MAP, ONE SESSION
On the same day, spot Bitcoin ETFs saw about $282.6M leave, spot Ethereum ETFs lost about $29.8M, a
post-image
live market updates
live-cover
LIVE1,792
After pumping $MINA 17 points, the time window left for you is less than 4 hours.
Current price: 0.1061. In 24 hours, it surged from 0.0877 to 0.1099, with a trading volume of 24.1M—the volume is not particularly large, but the gain is fierce enough. The on-chain light-client narrative is still intact, and the technical chart has just broken above the previous high and 0.105 resistance level, with short-term bulls in control.
Two possible scenarios: If it holds above 0.105 within 4 hours, the next target is 0.118-0.122. You can cautiously go long with a small position, setting a stop-loss at 0
MINA+14.31%
I really don’t want to say any more about how valuable Brother Peng’s strategy is, guys—just look for yourselves.
Today, the conservative gold long at 4297 was entered precisely, banking 100 points. 🥩
The conservative short at 4402 once again precisely caught the wick, taking 50 points. 🥩
Guys, just look for yourselves—gold was absolutely feasting today.
PAXG+0.23%
XAU+0.21%
Insiders are calling ZEC the next 40% move waiting to happen

$ZEC /USDT - LONG

Trade Plan:
Entry: 1164.19 – 1181.07
SL: 1091.63
TP1: 1233.38
TP2: 1273.88
TP3: 1334.62

Why this setup?
Why now? The daily trend is firmly bullish, setting the stage for a continuation play. The 1h price is sitting at 1172.57, right inside the entry zone of 1164.19 to 1181.07, which gives us a precise reference of 1172.63. With the 15m RSI at 54.83, momentum is neutral to slightly bullish, avoiding overbought exhaustion while the 1h ATR of 33.75 tells us the current volatility is substantial enough to fuel a m
ZEC+4.19%
$RAYSOL 24 hours surged 23.39%, with the current price at 1.6174 and trading volume reaching $480 million. Look at the low of 1.2806 and the high of 1.7495—a nearly 40% range in between. This isn’t volume retail traders can generate. Everyone in the group should remember I said a couple of days ago that the SOL ecosystem meme rotation was coming, and this move in $RAYSOL is capital rushing to grab tokens. The question now is whether to chase—the strategy I suggest is to scale in on a pullback to the 1.50–1.55 range, place a stop-loss below 1.38, and set the first take-profit target at 1.90. Ke
I originally only wanted to freeload a breakfast, but the market ended up wrapping half a year’s worth of dumplings for me.

A few days ago, I was watching $HEMI in the early morning. It repeatedly pushed up around 0.015588, but the volume failed to follow, and every move up fell just short. I judged that the resistance above was obvious, support was insufficient, and it strongly smelled like a bull trap. I said at the time that bulls could get ready, but not to rush in. Before the chart had fully started moving, I already felt this short setup had potential.

So what happened? Now at 0.0069
post-image
HEMI-5.52%
ETH+3.66%
ZEC+4.19%
The online romance was a bust—the person wasn’t the same as in the picture🥵
post-image
$SNDK /USDT is quietly coiling inside a narrow range while the 1h RSI drops to 38.54.

$SNDK /USDT - LONG

Trade Plan:
Entry: 1628.14 – 1639.40
SL: 1563.54
TP1: 1686.44
TP2: 1721.56
TP3: 1774.23

Why this setup?
Why now? The 4h trend is range-bound, but the 1h ATR of 22.51 shows latent volatility ready to expand. The entry zone sits between 1628.14 and 1639.40, with the entry reference at 1633.77 anchoring the position. A push to TP1 at 1686.44 would confirm the breakout, while TP2 at 1721.56 extends the move higher. The invalidation level at 1683.47 is the hard line that protects the trade
SNDK-4.47%
Load More

Join 40 M users in our growing community

⚡️ Join 40 M users in the crypto craze discussion

💬 Engage with your favorite top creators

👍 See what interests you

View More